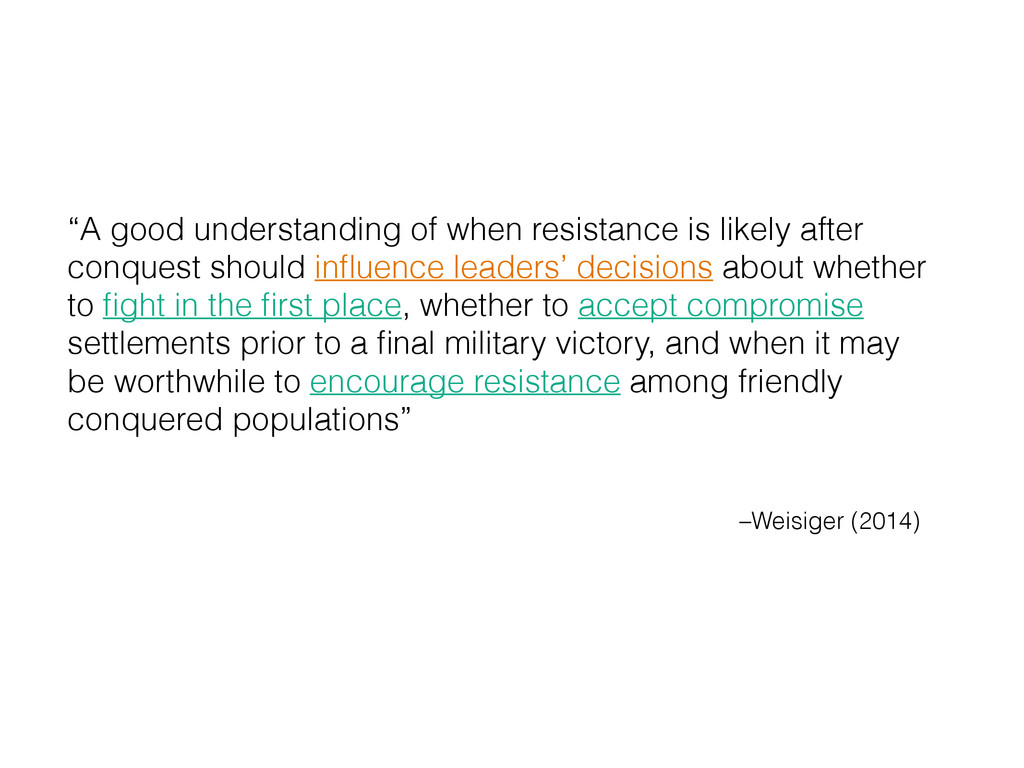
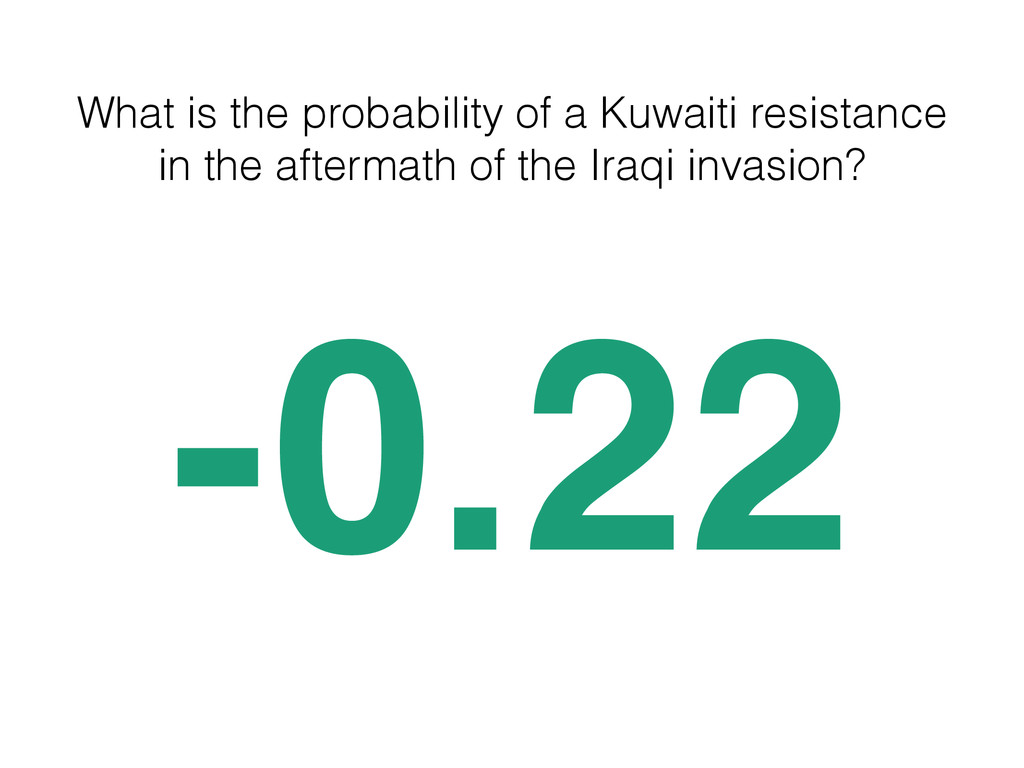
after conquest should influence leaders’ decisions about whether to fight in the first place, whether to accept compromise settlements prior to a final military victory, and when it may be worthwhile to encourage resistance among friendly conquered populations”
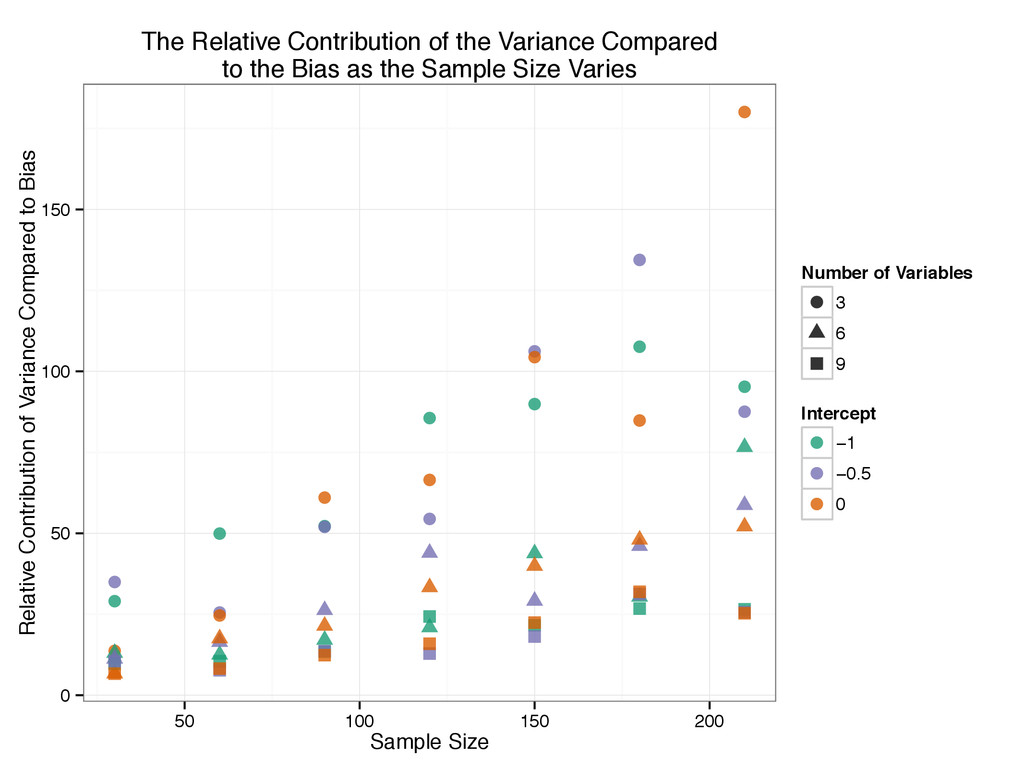
Relative Contribution of Variance Compared to Bias Number of Variables 3 6 9 Intercept −1 −0.5 0 The Relative Contribution of the Variance Compared to the Bias as the Sample Size Varies
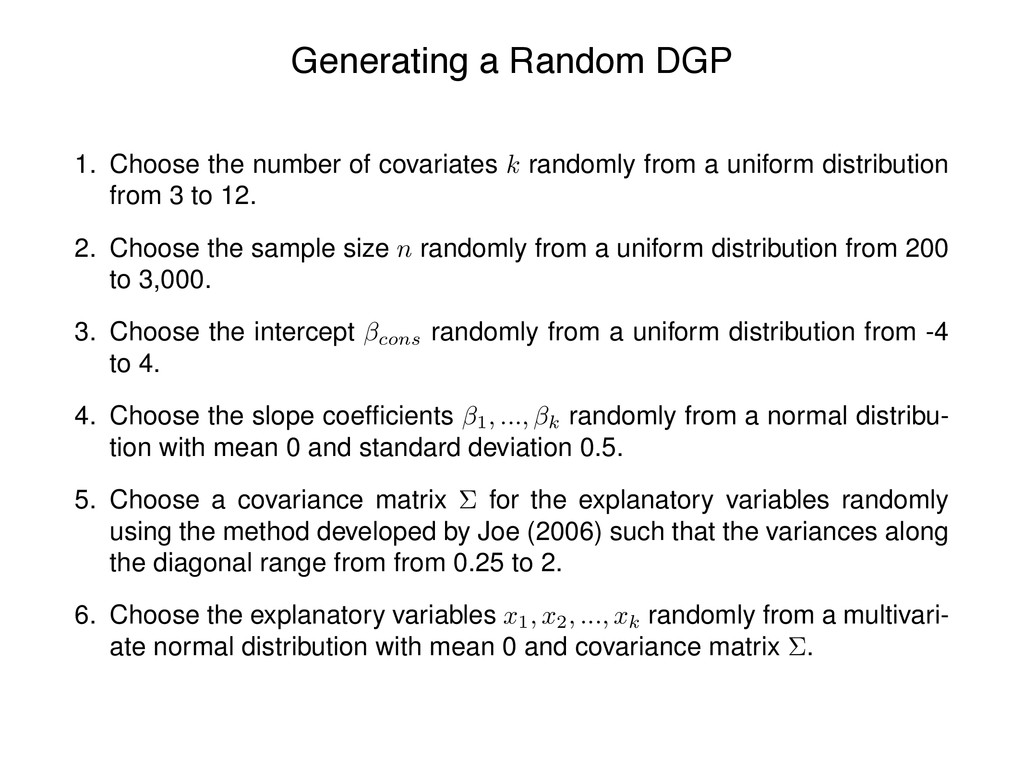
uniform distribution from 3 to 12. 2. Choose the sample size n randomly from a uniform distribution from 200 to 3,000. 3. Choose the intercept cons randomly from a uniform distribution from -4 to 4. 4. Choose the slope coefficients 1, ..., k randomly from a normal distribu- tion with mean 0 and standard deviation 0.5. 5. Choose a covariance matrix ⌃ for the explanatory variables randomly using the method developed by Joe (2006) such that the variances along the diagonal range from from 0.25 to 2. 6. Choose the explanatory variables x1, x2, ..., xk randomly from a multivari- ate normal distribution with mean 0 and covariance matrix ⌃ . Generating a Random DGP
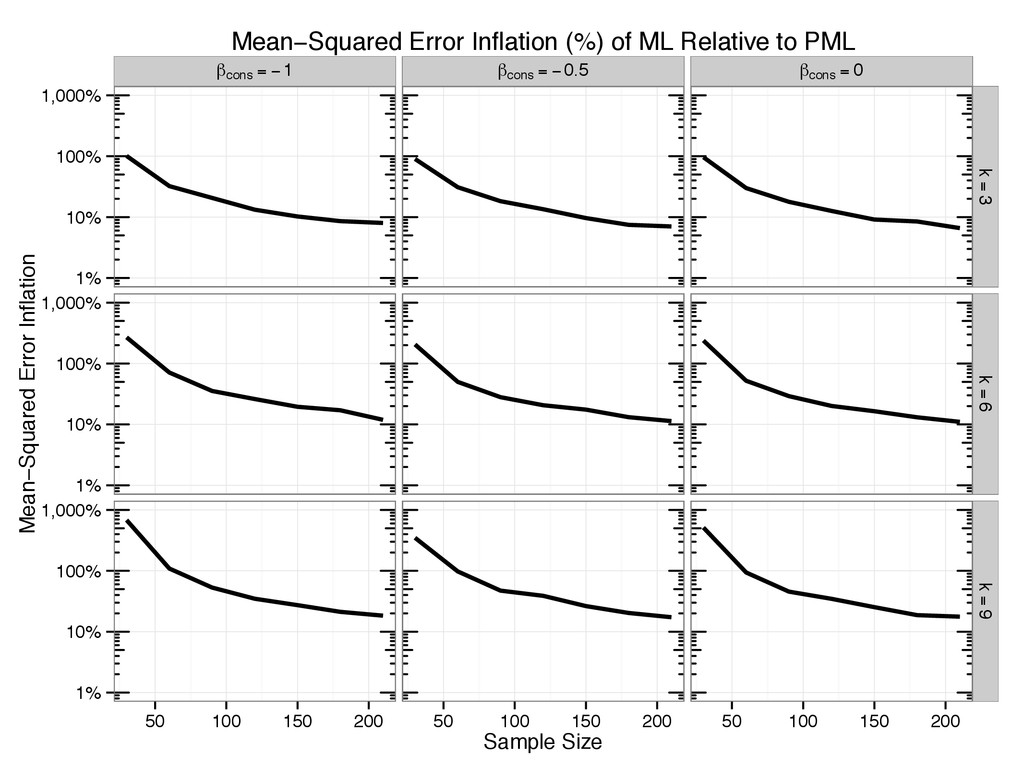
![MSE(ˆ) = E[(ˆ true)2] = V ar(ˆ) + [E(ˆ)]2](https://files.speakerdeck.com/presentations/0a5f63a8203141ba9ad74eadecd38882/slide_21.jpg)