Upgrade to Pro — share decks privately, control downloads, hide ads and more …

Thesis Presentation: Cultural Context

Carys Jenkins
February 26, 2015
62

Thesis Presentation: Cultural Context

Carys Jenkins

February 26, 2015
Tweet

Transcript

  1. RECAP: “Information/Data Visualization of News Stories -with a particular focus

    on UK politics and the General Election in May 2015”
  2. CULTURAL CONTEXT: -  A History of Data Vis. -  Why

    so Popular? - Data Vis Technology & How it reflects modern society - Why the Web? -  Needs of my Target Audience -  Q&A and example of Data Vis.
  3. W illiam Playfair: Scottish Engineer & Inventor of the Line

    Graph and Bar Chart (1786) and the Pie Chart (1801) -  Piechart from Playfair’s Statistical Breviary (1801)
  4. -  1900s: Data Vis. used in textbooks and Science Curriculums

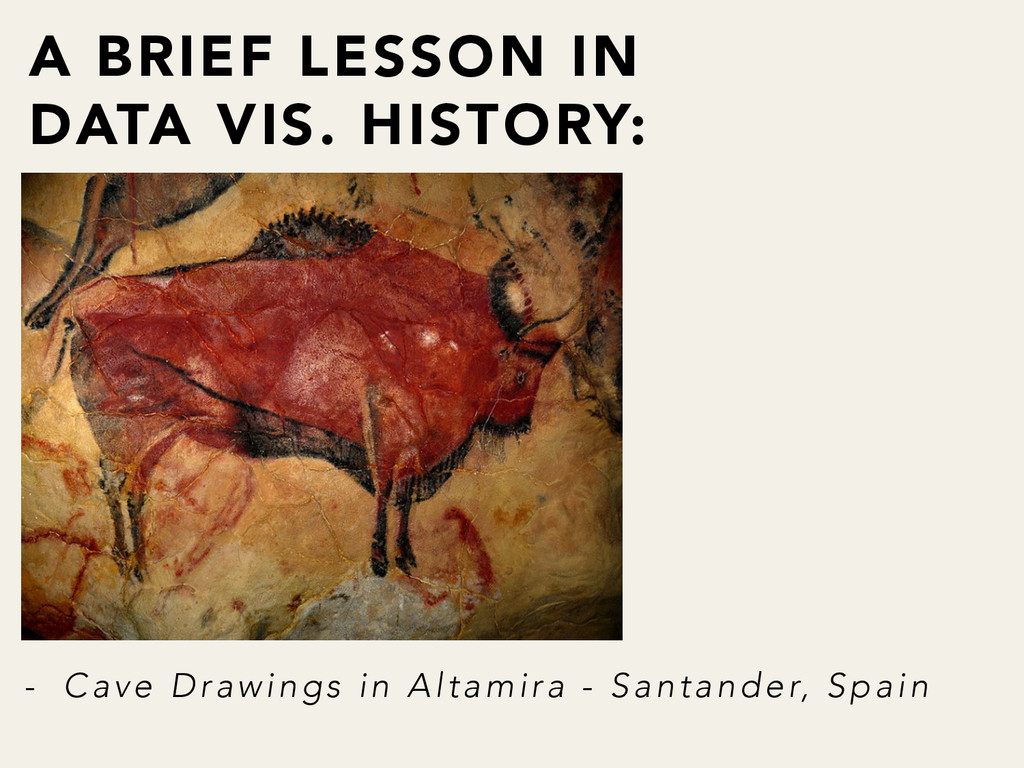
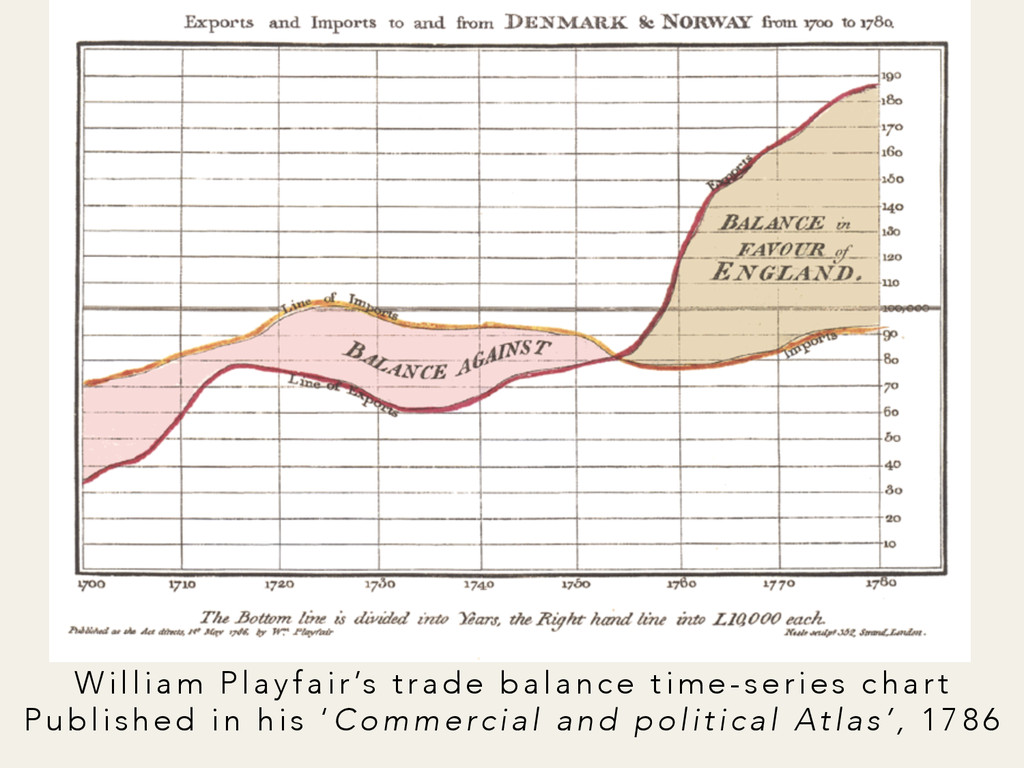
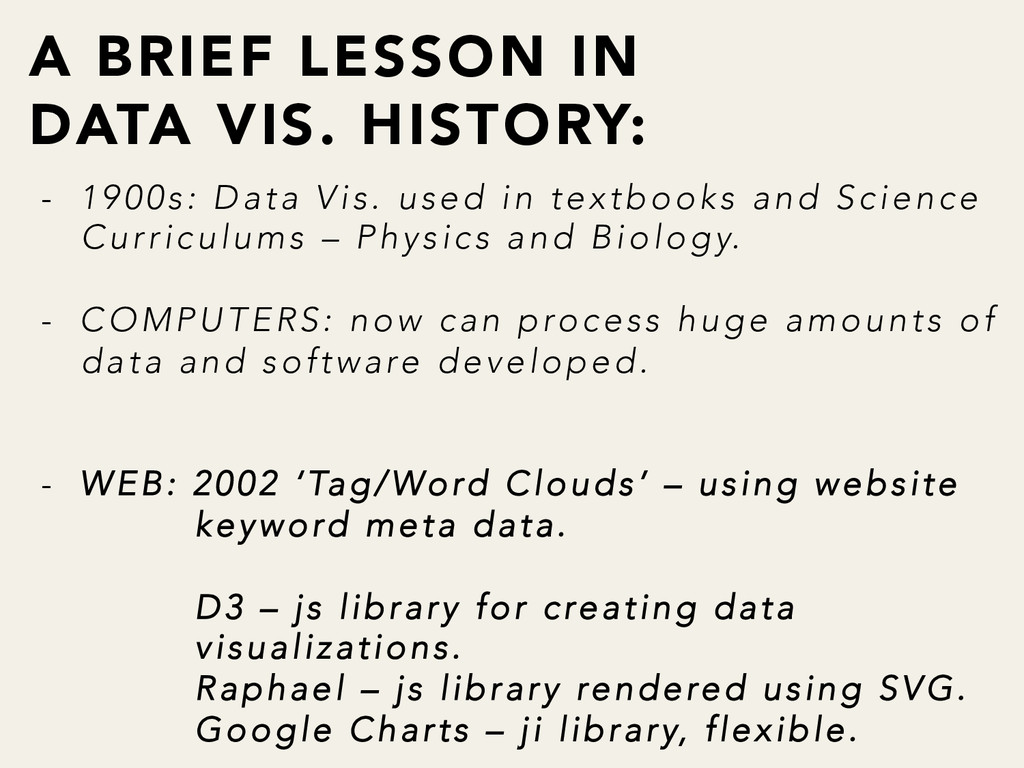
    – Physics and Biology. -  COMPUTERS: now can process huge amounts of data and software developed. -  WEB: 2002 ‘Tag/Word Clouds’ – using website keyword meta data. D3 – js library for creating data visualizations. Raphael – js library rendered using SVG. Google Charts – ji library, flexible. A BRIEF LESSON IN DATA VIS. HISTORY:
  5. -  Humans are visual! -  Fastest way to communicate to

    others in a information dense world. -  Visualization done accurately is expert storytelling - Easily shareable. WHY IS DATA VIS. SO POPULAR?
  6. DATA VIS. TECH & OUR SOCIETY: -  As we’ve seen

    Data Vis. has evolved with our tech. -  Presentation of Data: static to dynamic. -  Movement away from static Infographics (used and abused? Or still relevant – Pintrest?) -  Development of Web Technologies means more exciting and dynamic Data Vis. software.
  7. WHY ON THE WEB? -  Visualizations aren’t true visuals unless

    they are seen – web is a great platform to a global audience. -  Interactive data – empower people to explore and engage with data themselves. -  Lots of open source tech. -  Using Web Standards make accessible visualizations = greater audience and impact!
  8. AUDIENCE: John Doe: - 25yrs old -  Young professional - 

    Uses social and web media to find News and express opinions. - Plays IOS games and apps. Jane Smith: - 34yrs old -  Teacher -  Is a self-confessed Pinterest addict. -  Has an android phone.
  9. Q&A: Data: -  gov.co.uk -  Lord Ashcroft Polls -  World

    Health Organization (WHO) – health -  The Guardian Data Blog (data via google docs) -  Data Market -  Google Public Data Tech: -  Google Charts API -  JS -  Raphael -  D3