Upgrade to Pro — share decks privately, control downloads, hide ads and more …

Beyond Data Review

Beyond Data Review

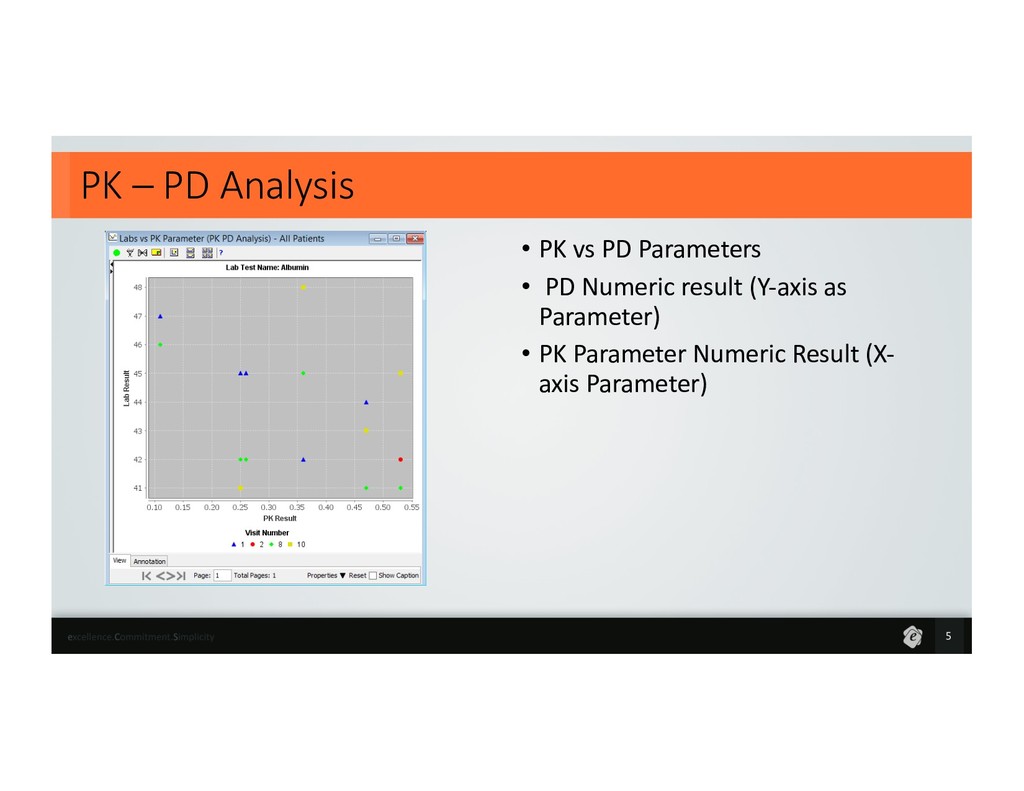
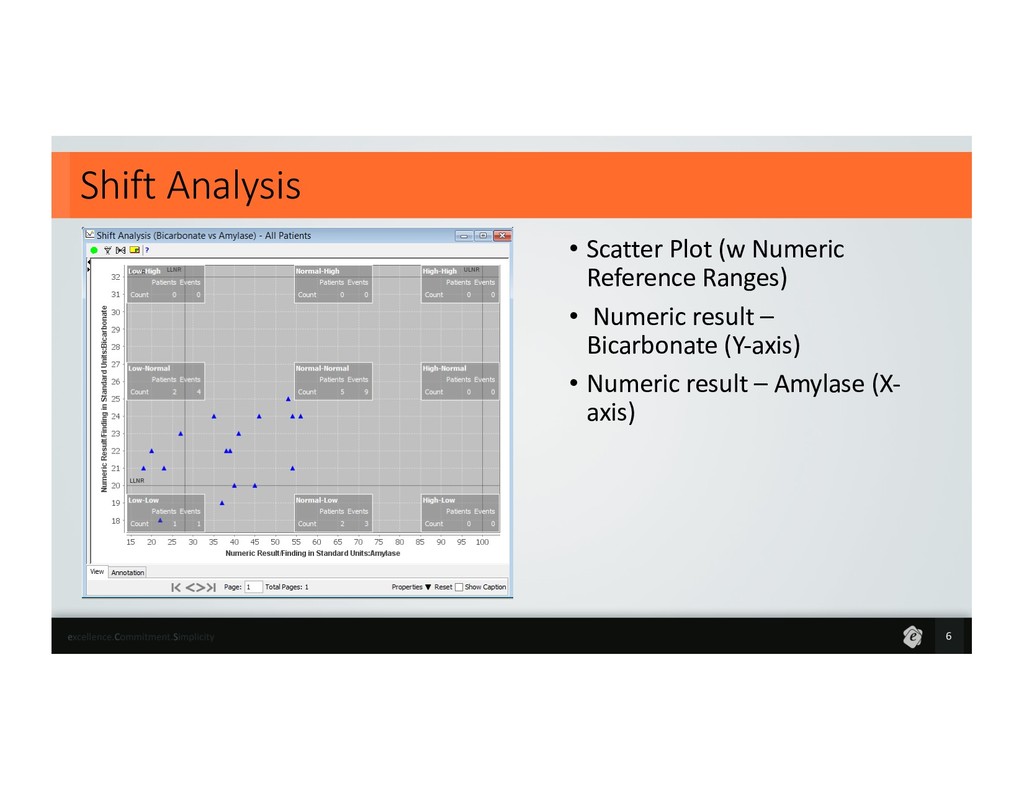
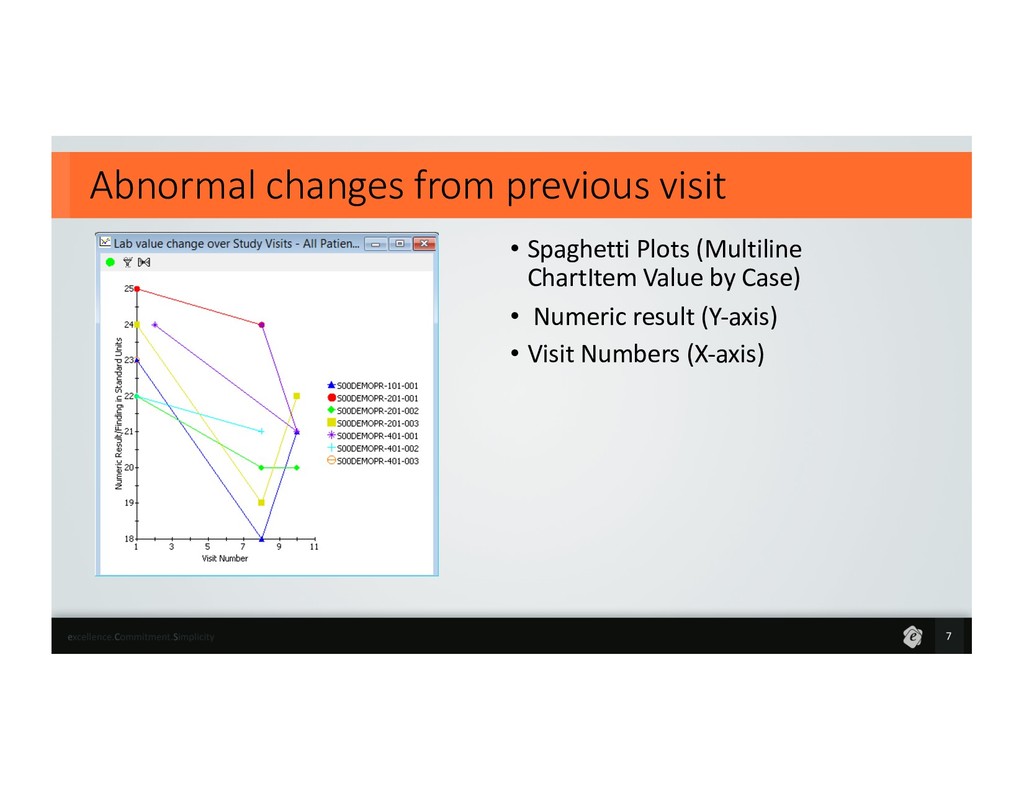
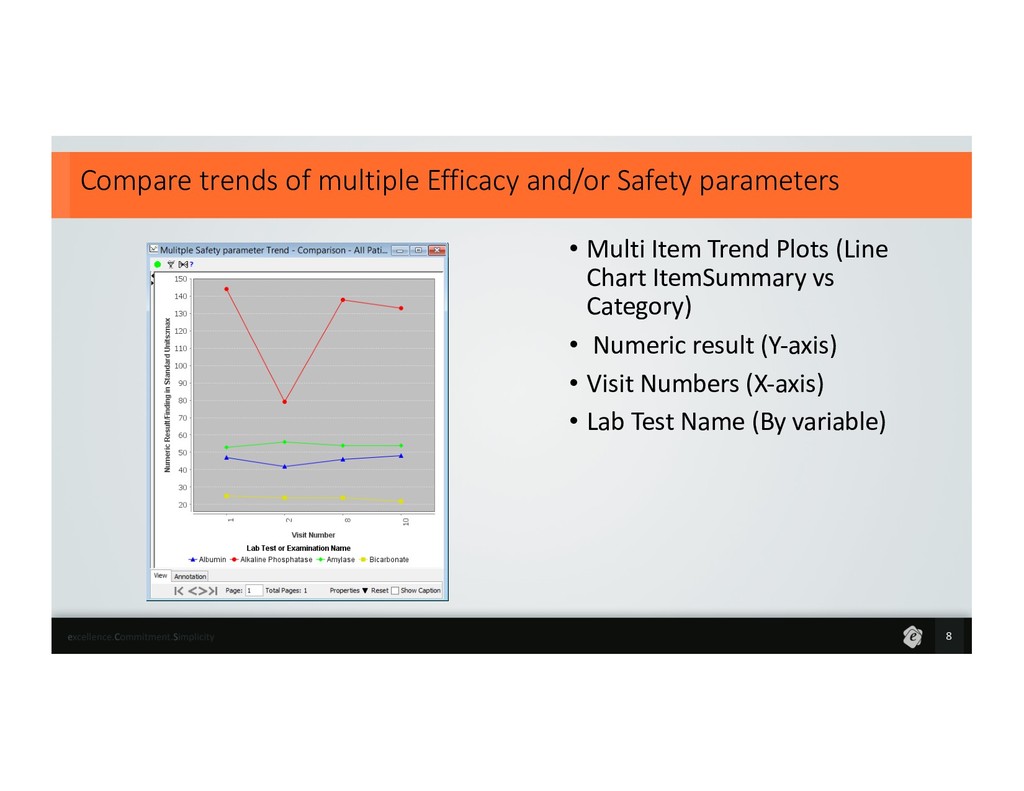
In this presentation we will do a walkthrough of how to use your EDC systems’ Audit trail feature in conjunction with JReview’s Patient review tracking functionality to support cumulative data review process for data managers.
We will demonstrate a use case by integrating Medidata Rave® EDC trial data with JReview® and look at examples on how patient review tracking functionality could be leveraged to support data management activities.

Chandi Kodthiwada

September 15, 2013
Tweet

More Decks by Chandi Kodthiwada

Other Decks in Technology

Transcript

  1. Why JReview Graphs? •Supports self-service analysis •Get data insights in

    near real-time for ongoing trials •Leverage drill-down capabilities to: • Visually make it easy to identify Outliers • Safety and Efficacy analysis •Reduce dependence on SAS Programmers •Overall increases speed and efficiencies for data review and analysis 2
  2. Typical Analyses • Trends of Change from Baseline across visits

    • PK – PD Analysis • Shift Analysis • Abnormal changes from previous visit • Compare trends of multiple Efficacy and/or Safety parameters • Visit level or Treatment Group level review 3
  3. Trends of Change from Baseline across visits 4 • Numeric

    Result – Post Baseline Visit – Y-axis • Baseline Result – X-axis • Visit Number (By variable)
  4. PK – PD Analysis 5 • PK vs PD Parameters

    • PD Numeric result (Y-axis as Parameter) • PK Parameter Numeric Result (X- axis Parameter)
  5. Shift Analysis 6 • Scatter Plot (w Numeric Reference Ranges)

    • Numeric result – Bicarbonate (Y-axis) • Numeric result – Amylase (X- axis)
  6. Abnormal changes from previous visit 7 • Spaghetti Plots (Multiline

    ChartItem Value by Case) • Numeric result (Y-axis) • Visit Numbers (X-axis)
  7. Compare trends of multiple Efficacy and/or Safety parameters 8 •

    Multi Item Trend Plots (Line Chart ItemSummary vs Category) • Numeric result (Y-axis) • Visit Numbers (X-axis) • Lab Test Name (By variable)
  8. Visit level or Treatment Group level review 9 • Change

    of Mean of Test Result Plots (Mean+sStdDev vs Category) • Numeric result (Y-axis) • Visit Numbers (X-axis)