Upgrade to Pro — share decks privately, control downloads, hide ads and more …

Metrics Collection with Elasticsearch

chendo
November 21, 2013

Metrics Collection with Elasticsearch

Presented at Melbourne Search Meetup, November 21st, 2013

chendo

November 21, 2013
Tweet

More Decks by chendo

Other Decks in Programming

Transcript

  1. The Problem • Needed to track and store performance and

    usage metrics for Shortcat • No reasonably-priced services existed • Most services aggregate, i.e. no access to raw data
  2. Service Examples • Mixpanel - web-focused, not flexible, high cost

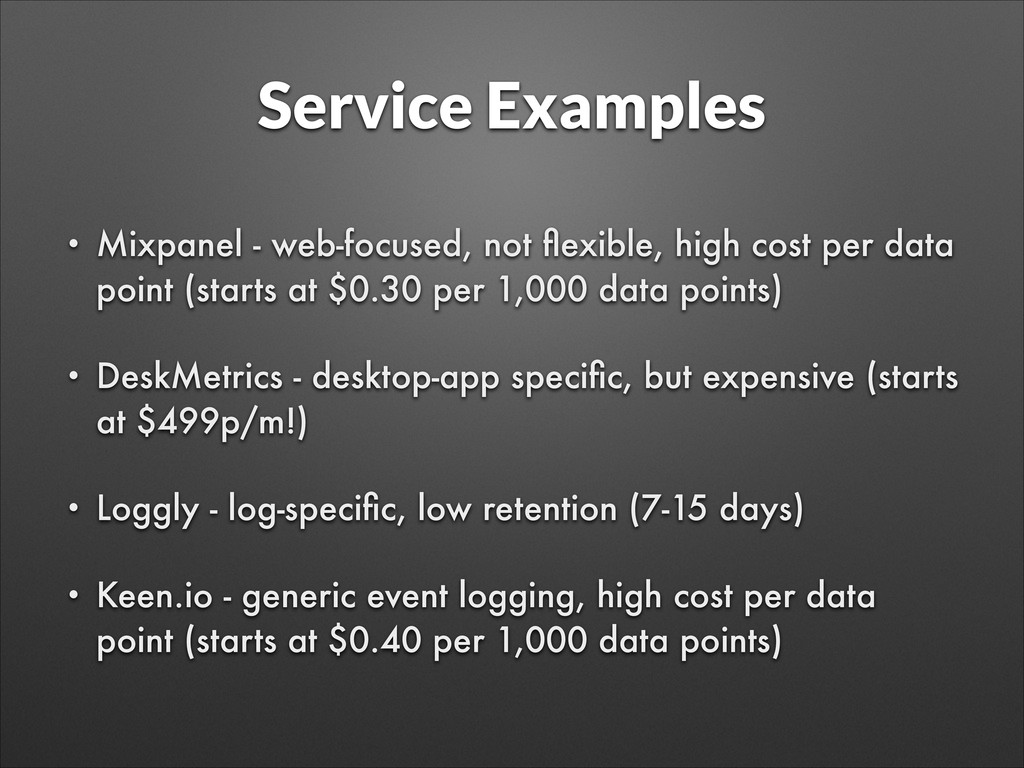
    per data point (starts at $0.30 per 1,000 data points) • DeskMetrics - desktop-app specific, but expensive (starts at $499p/m!) • Loggly - log-specific, low retention (7-15 days) • Keen.io - generic event logging, high cost per data point (starts at $0.40 per 1,000 data points)
  3. Why Elasticsearch? • Able to store structured data • Easy

    to scale • Super flexible querying • Statistical and date histogram facets • Soon: Aggregations!
  4. Recording a metric curl -XPOST -H "Content-Type: application/json" "http://localhost:9200/metrics/event" -d

    '{! "name": "movement_saved",! "data": {"amount": 200},! "occurred_at": "2013-11-18T17:29:10+11:00",! "environment": {! "build": 63,! "version": "0.6.3",! "os_version": “10.9.0”,! “session_id": “9C8593B6-21D3-4A35- B92F-76A337E92334”! }! }'
  5. Metric recording tips • Don’t log metrics directly to ES:

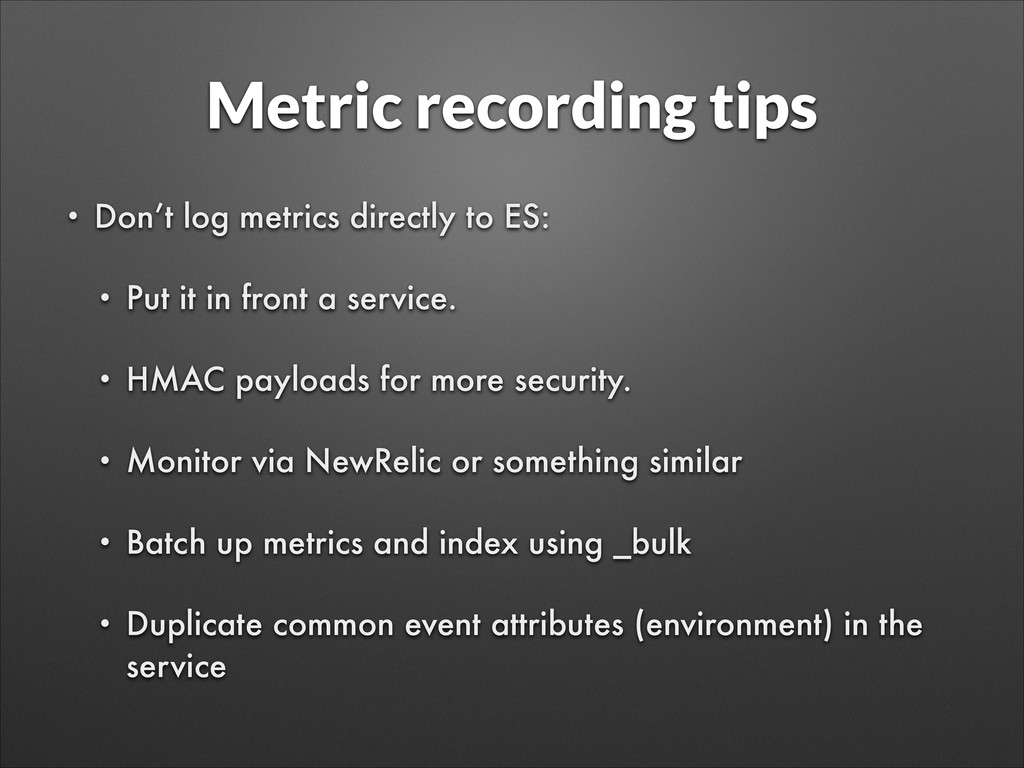
    • Put it in front a service. • HMAC payloads for more security. • Monitor via NewRelic or something similar • Batch up metrics and index using _bulk • Duplicate common event attributes (environment) in the service
  6. Metric recording tips • Don’t use dynamic keys • Make

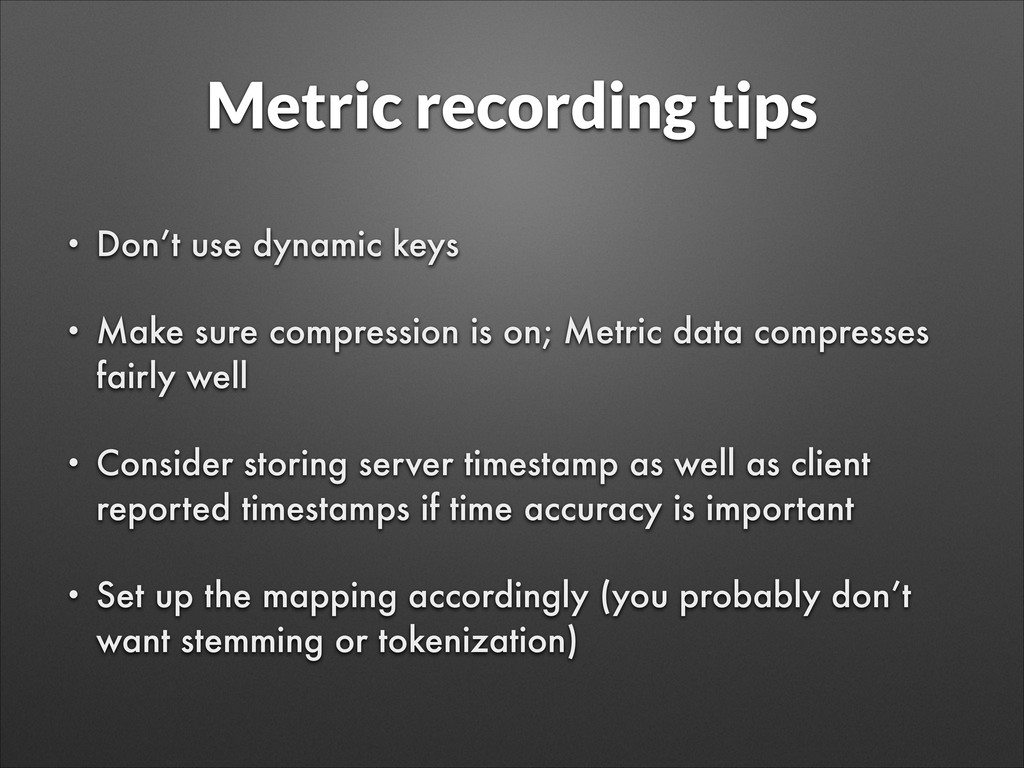
    sure compression is on; Metric data compresses fairly well • Consider storing server timestamp as well as client reported timestamps if time accuracy is important • Set up the mapping accordingly (you probably don’t want stemming or tokenization)
  7. Retrieve basic statistics {! "query": {! "term": {! "name": "movement_saved"!

    }! },! "facets": {! "movement": {! "statistical": {! "field":"data.amount"! }! }! },! "size": 0! }
  8. Retrieve basic statistics facets: {! movement: {! _type: statistical! count:

    4652! total: 2059456! min: 0! max: 12340! mean: 442.70335339638865! sum_of_squares: 2375078262! variance: 314563.6682346705! std_deviation: 560.8597580809934! }! }
  9. Retrieve time series data {! "query": {! "term": {! "name":

    "movement_saved"! }! },! "facets": {! "movement": {! "date_histogram": {! "key_field": "occurred_at",! "value_field": "data.amount",! "interval": "day"! }! }! },! "size": 0! }
  10. Retrieve time series data ! facets: {! movement: {! _type:

    date_histogram! entries: [! {! time: 1379462400000! count: 24! min: 2! max: 952! total: 6401! total_count: 24! mean: 266.7083333333333! },! {! time: 1379548800000! count: 14! min: 1! max: 1326! total: 8255! total_count: 14! mean: 589.6428571428571! },! ...! ]! }! }
  11. Filters! • Get stats where os_version is 10.9.0 • View

    raw data for a particular session • View breakdown by os_version • And whatever you can think of
  12. Logstash & Kibana • Logstash collects logs and ships them

    into ES • Kibana is a log visualiser which works well with logstash (but a pain for anything else)