Upgrade to Pro — share decks privately, control downloads, hide ads and more …

Causal Inference 2022 Week 1

Will Lowe
March 01, 2022
34

Causal Inference 2022 Week 1

Will Lowe

March 01, 2022
Tweet

Transcript

  1. PLAN 1 Causal explanation Potential outcomes, equations, and graphs E

    ects and how to estimate them Graphs and interventions Conditioning for fun and pro t “When we understand that slide, we’ll have won the war” Gen. Stanley McChrystal ( )
  2. EXPLANATION 2 Q: Why? A: Because! Causal inference is the

    main form of explanation in social science For our purposes, we’ll care about causation when we care about → understanding how institutions work → evaluating policy impact → de ning and evaluating fairness / discrimination
  3. EXPLANATION 2 Q: Why? A: Because! Causal inference is the

    main form of explanation in social science For our purposes, we’ll care about causation when we care about → understanding how institutions work → evaluating policy impact → de ning and evaluating fairness / discrimination - You may invoke my principles or the law to explain my actions, but if those are not also causes of my action, there’s no explanation. , ! To measure democracy, social trust, or political ideology we build measurement models linking items to construct. In the best models, construct causes items
  4. CAUSAL EXPLANATION 3 Causal explanation is contrastive (Sober, ) →

    Reporter: Why do you rob banks? → Willy Sutton: Because that’s where the money is. (Alas, apocryphal: Sutton & Linn, )
  5. CAUSAL EXPLANATION 3 Causal explanation is contrastive (Sober, ) →

    Reporter: Why do you rob banks? → Willy Sutton: Because that’s where the money is. (Alas, apocryphal: Sutton & Linn, ) ree possible causal questions here: → Why banks rather than post o ces? → Why robbing rather than working? → Why do it yourself rather than hiring a gang? Each one invokes a di erent contrast and a di erent causal question
  6. CAUSAL EXPLANATION 4 Causal explanation is contrastive (Sober, ) →

    Reporter: Why do you rob banks? → Willy Sutton: Because that’s where the money is. (Alas, apocryphal: Sutton & Linn, ) Sutton himself had a di erent view “Why did I rob banks? Be- cause I enjoyed it. I loved it. I was more alive when I was in- side a bank, robbing it, than at any other time in my life.”
  7. CAUSES TO EFFECTS 5 Reasoning from e ects to causes

    is hard → Many possible contrasts and mechanisms We’ll approach things from the other direction: from causes to e ects
  8. CAUSES TO EFFECTS 5 Reasoning from e ects to causes

    is hard → Many possible contrasts and mechanisms We’ll approach things from the other direction: from causes to e ects What is the e ect of T ( : press, : don’t press) on Y (bang, no bang)
  9. CAUSES TO EFFECTS 5 Reasoning from e ects to causes

    is hard → Many possible contrasts and mechanisms We’ll approach things from the other direction: from causes to e ects What is the e ect of T ( : press, : don’t press) on Y (bang, no bang) T (‘ ’) → Are T and Y (cor)related? → Would setting T to lead to Y= ? → Y = , but would Y = had T not been ?
  10. HOW TO THINK FORMALLY ABOUT CAUSATION 6 We’re going to

    use three closely related formal frameworks for thinking systematically about causation . Structural equations . Directed acyclic graphs (DAGs) . Potential outcomes Structural equations imply facts about → What happens when you intervene on variables (dismember graphs) → e size and direction of e ects (di erences of averages of actual and counterfactual outcomes) ese correspond to a focus on . Nature: Mechanisms. Rubin shorthand: ‘the Science’ . Nature’s joints: How variables relate statistically when generated by these mechanisms . Nature’s creatures: How actual and possible cases or realizations relate to one another
  11. POTENTIAL OUTCOMES, EQUATIONS, GRAPHS 7 Does watching Sesame Street improve

    children’s reading? (Murphy, ) An ‘encouragement design’ → Encouraged: { , } → Watched: { , } → Letter recognition score: [ , ] → Previous score: [ , ] → Grade → Likes children’s TV, SES, etc. (unmeasured) We’re interested in the e ect of watching W on letter recognition score L “Big deal. Hey, let’s get this over with. I never watch television anyway. It’s too trashy, even for me.” (Bamberger )
  12. POTENTIAL OUTCOMES 8 Does watching Sesame Street improve reading? (Murphy,

    ) → Encouraged: { , } → Watched: { , } → Letter recognition score: [ , ] → Previous score: [ , ] → Grade, Likes children’s TV... We’re interested in the e ect of watching W on letter recognition score L P Child i’s letter score → a er watching: L(W= ) i → a er not watching: L(W= ) i We’ll usually shorten this to L( ) i and L( ) i
  13. POTENTIAL OUTCOMES 8 Does watching Sesame Street improve reading? (Murphy,

    ) → Encouraged: { , } → Watched: { , } → Letter recognition score: [ , ] → Previous score: [ , ] → Grade, Likes children’s TV... We’re interested in the e ect of watching W on letter recognition score L P Child i’s letter score → a er watching: L(W= ) i → a er not watching: L(W= ) i We’ll usually shorten this to L( ) i and L( ) i O Li = I[Wi = ] L( ) i + I[Wi = ] L( ) i
  14. POTENTIAL OUTCOMES 8 Does watching Sesame Street improve reading? (Murphy,

    ) → Encouraged: { , } → Watched: { , } → Letter recognition score: [ , ] → Previous score: [ , ] → Grade, Likes children’s TV... We’re interested in the e ect of watching W on letter recognition score L P Child i’s letter score → a er watching: L(W= ) i → a er not watching: L(W= ) i We’ll usually shorten this to L( ) i and L( ) i O Li = I[Wi = ] L( ) i + I[Wi = ] L( ) i I ∆Li = L( ) i − L( ) i Alas, only one of these is ever observed (Holland, )
  15. EFFECTS 9 A In N children the average treatment e

    ect of watching is ATE = N N i ∆Li ⇒ E[∆L] = E[L( ) − L( )] = E[L( )] − E[L( )]
  16. EFFECTS 9 A In N children the average treatment e

    ect of watching is ATE = N N i ∆Li ⇒ E[∆L] = E[L( ) − L( )] = E[L( )] − E[L( )] A ATT = E[L( ) − L( ) W = ] = E[L( ) W = ] − E[L( ) W = ] e average treatment e ect on the treated, i.e. children who watch
  17. EFFECTS 9 A In N children the average treatment e

    ect of watching is ATE = N N i ∆Li ⇒ E[∆L] = E[L( ) − L( )] = E[L( )] − E[L( )] A ATT = E[L( ) − L( ) W = ] = E[L( ) W = ] − E[L( ) W = ] e average treatment e ect on the treated, i.e. children who watch A What you’d expect watching would do to the reading scores of a randomly selected child A → ‘Make’ every child watch, record score → ‘Make’ every child not watch, record score → Subtract and average
  18. EFFECTS 10 Treatment e ects are local tangent approximations to

    policy responses under a complete model of media-education e ects → Assuming no spillover, multiple versions of treatment, or general equilibrium e ects
  19. EFFECTS 10 Treatment e ects are local tangent approximations to

    policy responses under a complete model of media-education e ects → Assuming no spillover, multiple versions of treatment, or general equilibrium e ects
  20. EFFECTS 10 Treatment e ects are local tangent approximations to

    policy responses under a complete model of media-education e ects → Assuming no spillover, multiple versions of treatment, or general equilibrium e ects O en summarized as the ‘single unit treatment variable assumption’ (SUTVA, Rubin, ) SUTVA is simply the a priori assump- tion that the value of Y for unit u when exposed to treatment t will be the same no matter what mechanism is used to assign treatment t to unit u and no matter what treatments the other units receive. E ects are more credibly predictive when → more local → closer to the status quo
  21. ESTIMATING EFFECTS 11 Suppose we know that the P(W =

    ) = π. en ATE = π E[L( ) W = ] + ( − π)E[L( ) W = ] − π E[L( ) W = ] + ( − π)E[L( ) W = ] ¹Looking at you, machine learning
  22. ESTIMATING EFFECTS 11 Suppose we know that the P(W =

    ) = π. en ATE = π E[L( ) W = ] + ( − π)E[L( ) W = ] − π E[L( ) W = ] + ( − π)E[L( ) W = ] Maybe you want to estimate this estimand using ˆ δ = EN [L W = ] − EN [L W = ] → E[L W = ] − E[L W = ] = δ ¹Looking at you, machine learning
  23. ESTIMATING EFFECTS 11 Suppose we know that the P(W =

    ) = π. en ATE = π E[L( ) W = ] + ( − π)E[L( ) W = ] − π E[L( ) W = ] + ( − π)E[L( ) W = ] Maybe you want to estimate this estimand using ˆ δ = EN [L W = ] − EN [L W = ] → E[L W = ] − E[L W = ] = δ Alas, δ is not usually the ATE (so making ˆ δ really good won’t help)¹ δ = ATE + (the right answer) (E[L( ) W = ] − E[L( ) W = ]) + (baseline group di erences) ( − π)(E[∆L W = ] − E[∆L W = ]) (group-speci c treatment e ects) ¹Looking at you, machine learning
  24. ‘NO CAUSES IN, NO CAUSES OUT’ 12 T Treat potential

    outcomes as random variables and assume (or make) this true (L( ) , L( )) ⊥ ⊥ W
  25. ‘NO CAUSES IN, NO CAUSES OUT’ 12 T Treat potential

    outcomes as random variables and assume (or make) this true (L( ) , L( )) ⊥ ⊥ W I No systematic relationship between being assigned to watch Sesame Street W and being a better or worse letter recognizer L(⋅) . I Treatment e ects ∆Li = L( ) i − L( ) i are not systematically bigger (smaller) for those who watch and those who don’t.
  26. ‘NO CAUSES IN, NO CAUSES OUT’ 12 T Treat potential

    outcomes as random variables and assume (or make) this true (L( ) , L( )) ⊥ ⊥ W I No systematic relationship between being assigned to watch Sesame Street W and being a better or worse letter recognizer L(⋅) . I Treatment e ects ∆Li = L( ) i − L( ) i are not systematically bigger (smaller) for those who watch and those who don’t. H ? If (L( ) , L( )) ⊥ ⊥ W then E[L( ) i Wi = ] = E[L( ) i Wi = ] E[L( ) i Wi = ] = E[L( ) i Wi = ] M An experiment with W randomized
  27. ‘NO CAUSES IN, NO CAUSES OUT’ 12 T Treat potential

    outcomes as random variables and assume (or make) this true (L( ) , L( )) ⊥ ⊥ W I No systematic relationship between being assigned to watch Sesame Street W and being a better or worse letter recognizer L(⋅) . I Treatment e ects ∆Li = L( ) i − L( ) i are not systematically bigger (smaller) for those who watch and those who don’t. H ? If (L( ) , L( )) ⊥ ⊥ W then E[L( ) i Wi = ] = E[L( ) i Wi = ] E[L( ) i Wi = ] = E[L( ) i Wi = ] M An experiment with W randomized M If we can’t assume (or make) that true, maybe (L( ) , L( )) ⊥ ⊥ W G An experiment with W randomized and G controlled e.g. an RCT
  28. EQUATIONS AND GRAPHS 13 Does encouraging children to watch Sesame

    Street improve reading? → Encouraged: { , } → Watched: { , } → Letter recognition score: [ , ] → Previous score: [ , ] → Grade, Likes children’s TV... E W L P G T Directed Acyclic Graph Directed Acyclic Graf
  29. EQUATIONS AND GRAPHS 14 Does encouraging children to watch Sesame

    Street improve reading? → Encouraged: { , } → Watched: { , } → Letter recognition score: [ , ] → Previous score: [ , ] → Grade, Likes children’s TV... E W L P G T S Nodes are variables: lled if observed, hollow if unobserved / latent
  30. EQUATIONS AND GRAPHS 14 Does encouraging children to watch Sesame

    Street improve reading? → Encouraged: { , } → Watched: { , } → Letter recognition score: [ , ] → Previous score: [ , ] → Grade, Likes children’s TV... E W L P G T S Nodes are variables: lled if observed, hollow if unobserved / latent Each arrow represents a distinct mechanism underlying a (direct) causal e ect
  31. EQUATIONS AND GRAPHS 14 Does encouraging children to watch Sesame

    Street improve reading? → Encouraged: { , } → Watched: { , } → Letter recognition score: [ , ] → Previous score: [ , ] → Grade, Likes children’s TV... E W L P G T S Nodes are variables: lled if observed, hollow if unobserved / latent Each arrow represents a distinct mechanism underlying a (direct) causal e ect e functional forms are unspeci ed → Regression modeling is one such story: E[L] = f (W, T, G, P) ‘Noise’ (external variables) a ect each node (not drawn) → L = E[L] + єL
  32. EQUATIONS AND GRAPHS 14 Does encouraging children to watch Sesame

    Street improve reading? → Encouraged: { , } → Watched: { , } → Letter recognition score: [ , ] → Previous score: [ , ] → Grade, Likes children’s TV... E W L P G T S Nodes are variables: lled if observed, hollow if unobserved / latent Each arrow represents a distinct mechanism underlying a (direct) causal e ect e functional forms are unspeci ed → Regression modeling is one such story: E[L] = f (W, T, G, P) ‘Noise’ (external variables) a ect each node (not drawn) → L = E[L] + єL is induces a joint probability distribution with speci c conditional independencies
  33. EQUATIONS AND GRAPHS 15 Does encouraging children to watch Sesame

    Street improve reading? → Encouraged: { , } → Watched: { , } → Letter recognition score: [ , ] → Previous score: [ , ] → Grade, Likes children’s TV... E W L P G T P Each mechanism (with its attendant independent noise) corresponds to a probability distribution
  34. EQUATIONS AND GRAPHS 15 Does encouraging children to watch Sesame

    Street improve reading? → Encouraged: { , } → Watched: { , } → Letter recognition score: [ , ] → Previous score: [ , ] → Grade, Likes children’s TV... E W L P G T P Each mechanism (with its attendant independent noise) corresponds to a probability distribution P(L, P, W, G, T, E) =P(E) × P(T) × P(G) × P(P) × P(W E, T, G) × P(L P, T, G, W)
  35. EQUATIONS AND GRAPHS 15 Does encouraging children to watch Sesame

    Street improve reading? → Encouraged: { , } → Watched: { , } → Letter recognition score: [ , ] → Previous score: [ , ] → Grade, Likes children’s TV... E W L P G T P Each mechanism (with its attendant independent noise) corresponds to a probability distribution P(L, P, W, G, T, E) =P(E) × P(T) × P(G) × P(P) × P(W E, T, G) × P(L P, T, G, W) e graph implies independencies which are observable, e.g. E ⊥ ⊥ L W, T, G
  36. EQUATIONS AND GRAPHS 15 Does encouraging children to watch Sesame

    Street improve reading? → Encouraged: { , } → Watched: { , } → Letter recognition score: [ , ] → Previous score: [ , ] → Grade, Likes children’s TV... E W L P G T P Each mechanism (with its attendant independent noise) corresponds to a probability distribution P(L, P, W, G, T, E) =P(E) × P(T) × P(G) × P(P) × P(W E, T, G) × P(L P, T, G, W) e graph implies independencies which are observable, e.g. E ⊥ ⊥ L W, T, G When we intervene on this system we set some variables → Exit: W ∼ P(W E, T, G) → Enter: W =
  37. GRAPHS AND INTERVENTIONS 16 Does encouraging children to watch Sesame

    Street improve reading? → Encouraged: { , } → Watched: { , } → Letter recognition score: [ , ] → Previous score: [ , ] → Grade, Likes children’s TV... E W L P G T D e causal e ect of W is what happens to L if you remove W’s inbound connections and change its value → intervention e.g. randomizing W makes a new graph → in this graph (L( ) , L( )) ⊥ ⊥ W E W L P G T
  38. GRAPHS AND INTERVENTIONS 16 Does encouraging children to watch Sesame

    Street improve reading? → Encouraged: { , } → Watched: { , } → Letter recognition score: [ , ] → Previous score: [ , ] → Grade, Likes children’s TV... E W L P G T D e causal e ect of W is what happens to L if you remove W’s inbound connections and change its value → intervention e.g. randomizing W makes a new graph → in this graph (L( ) , L( )) ⊥ ⊥ W E W L P G T O Learn about the graph above with data from the graph le
  39. TERMINOLOGY: IDENTIFICATION 17 We have an estimand, e.g. E[Y do(X

    = x)] a.k.a. E[Y(X=x)] which implicitly depends on some distribution P(Y do(X = x)) a.k.a. P(Y(X=x)) And we have data that tells us about conditional probabilities and independencies and correlations, e.g. P(Y X) and regression functions E[Y X] and all that good stu Rather o en P(Y(X=x)) ≠ P(Y X) But we identify (assert identity between) an estimand (le ) with some function of observables (right). e plan for guring out what to put on the right is an identi cation strategy
  40. GRAPHS AND INTERVENTIONS 18 Does encouraging children to watch Sesame

    Street improve reading? → Encouraged: { , } → Watched: { , } → Letter recognition score: [ , ] → Previous score: [ , ] → Grade, Likes children’s TV... E W L P G T P → e e ect of W on L is W → L → T and G confound the W − L relationship → If T were observed then (L( ) , L( )) ⊥ ⊥ W T, G → Since T is not observed this is false → E is a potential instrument → Conditioning on P may increase precision → Conditioning on P will not o set the consequences of unmeasured T None of this depends on functional details, e.g. interactions, additivity, non-linearity, etc....
  41. GRAPHS AND INTERVENTIONS 18 Does encouraging children to watch Sesame

    Street improve reading? → Encouraged: { , } → Watched: { , } → Letter recognition score: [ , ] → Previous score: [ , ] → Grade, Likes children’s TV... E W L P G T P → e e ect of W on L is W → L → T and G confound the W − L relationship → If T were observed then (L( ) , L( )) ⊥ ⊥ W T, G → Since T is not observed this is false → E is a potential instrument → Conditioning on P may increase precision → Conditioning on P will not o set the consequences of unmeasured T None of this depends on functional details, e.g. interactions, additivity, non-linearity, etc.... How can we tell all that? Let’s nd out!
  42. ESSENTIAL STRUCTURES 19 We’ll think of graphs as compositions of

    the following three types of structures X Z Y mediator X Z Y common cause, fork, confounder X Z Y collider, common e ect
  43. OBSERVABLE IMPLICATIONS 20 X Z Y P P(X, Y, Z)

    = P(Z X, Y)P(X Y)P(Y) = P(Z X, Y)P(X)P(Y)
  44. OBSERVABLE IMPLICATIONS 20 X Z Y P P(X, Y, Z)

    = P(Z X, Y)P(X Y)P(Y) = P(Z X, Y)P(X)P(Y) T e second line says P(X, Y) = P(X)P(Y) i.e. Y ⊥ ⊥ X X Z Y P P(Y, X, Z) = P(X Z)P(Y Z)P(Z) T X and Y are not independent X ⊥ ⊥ Y X ⊥ ⊥ Y Z unless we condition on Z
  45. KINDA? 22 X Z Y P P(X, Y, Z) =

    P(Y X, Z)P(Z X)P(X) P(X, Y, Z) = P(Y Z)P(Z X)P(X) T ? X and Y are not independent unless we condition on Z X ⊥ ⊥ Y X ⊥ ⊥ Y Z
  46. KINDA? 22 X Z Y P P(X, Y, Z) =

    P(Y X, Z)P(Z X)P(X) P(X, Y, Z) = P(Y Z)P(Z X)P(X) T ? X and Y are not independent unless we condition on Z X ⊥ ⊥ Y X ⊥ ⊥ Y Z From data alone we cannot distinguish Y ← Z ← X Y ← Z → X [sad trombone] M Two graphs are Markov equivalent when they they have the same skeleton (same variables and links) and the same collider structures (Pearl & Verma, ) e rest is (o en) algorithmically discoverable (see ch. Shalizi, , for an introduction)
  47. CONDITIONING 23 Conditioning on Z: → Subsetting a data set

    by values of X → Reducing a data set to cases with a particular X value → Blocking an experiment by X → Adding X to a regression or ML model as a predictor
  48. CONDITIONING 23 Conditioning on Z: → Subsetting a data set

    by values of X → Reducing a data set to cases with a particular X value → Blocking an experiment by X → Adding X to a regression or ML model as a predictor Conditioning can → make association where there wasn’t any (mediators and forks) → remove association where there was (colliders and their children) X Z Y Common cause X Z Y Common e ect / collider
  49. CONDITIONING 24 Conditioning on Z: → Subsetting a data set

    by values of X → Filtering a data set to cases with a particular X value → Blocking an experiment on X → Strati cation: Dividing up cases by X value, measuring a relationship, and averaging the results → Regression: Adding X as a predictor a.k.a. ‘controlling for’ Conditioning can → make association where there wasn’t any (mediators and forks) → remove association where there was (colliders and their children) X Z Y Common cause X Z Y Common e ect / collider
  50. CONDITIONING 25 8 10 12 14 16 7.5 10.0 12.5

    15.0 Mathematics Reading/Writing Private tutor No Yes −3 −2 −1 0 1 2 3 −2 0 2 Mathematics Reading/Writing Admission No Yes
  51. CONFOUNDING 26 X Z Y P(X, Y, Z) = P(Y

    Z, X)P(X Z)P(Z) So the distribution of Y given X is (by defn.) P(Y X) = z P(Y Z =z, X)P(X Z =z)P(Z =z) which is not P(Y do(X = x)) a.k.a. P(Y(X=x))
  52. CONFOUNDING 26 X Z Y P(X, Y, Z) = P(Y

    Z, X)P(X Z)P(Z) So the distribution of Y given X is (by defn.) P(Y X) = z P(Y Z =z, X)P(X Z =z)P(Z =z) which is not P(Y do(X = x)) a.k.a. P(Y(X=x)) X Z Y P(X, Y, Z) = P(Y Z, X)P(Z)P(X)
  53. CONFOUNDING 26 X Z Y P(X, Y, Z) = P(Y

    Z, X)P(X Z)P(Z) So the distribution of Y given X is (by defn.) P(Y X) = z P(Y Z =z, X)P(X Z =z)P(Z =z) which is not P(Y do(X = x)) a.k.a. P(Y(X=x)) X Z Y P(X, Y, Z) = P(Y Z, X)P(Z)P(X) So the distribution of Y given X is P(Y X) = z P(Y Z = z, X)P(Z = z) (maybe regress Y against X controlling for Z?) at’s what we want...
  54. COLLIDER BIAS 27 X Z Y P(X, Y, Z) =

    P(Y X)P(Z X, Y)P(X) So the distribution of Y given X is right there which is also P(Y do(X = x)) a.k.a. P(Y(X=x))
  55. COLLIDER BIAS 27 X Z Y P(X, Y, Z) =

    P(Y X)P(Z X, Y)P(X) So the distribution of Y given X is right there which is also P(Y do(X = x)) a.k.a. P(Y(X=x)) X Z Y A er ‘intervention’ everything is the same... If we do decide to P(Y X) = z P(Y Z = z, X)P(Z = z) (maybe regress Y against X controlling for Z?) en we get uninterpretable mush
  56. MUSH 28 is is uninterpretable P Graph structure tells us

    (Pearl et al., ) → What should be conditioned on and what should not: D-separation → What causal e ects can be identi ed with only graph information and what needs more information → What causal e ects can be identi ed by conditioning and which not Extremely general theory for arbitrarily complicated DAGs
  57. POTENTIAL OUTCOMES AGAIN 29 X Z Y I (Y( )

    , Y( )) ⊥ ⊥ X but (Y( ) , Y( )) ⊥ ⊥ X Z so condition on Z! X Z Y I (Y( ) , Y( )) ⊥ ⊥ X but (Y( ) , Y( )) ⊥ ⊥ X Z so don’t condition on Z! “Who knows what to condition on? e graph knows”
  58. REFERENCES 31 Angrist, J. D., & Pischke, J.-S. ( ).

    “ e credibility revolution in empirical economics: How better research design is taking the con out of econometrics.” Journal of Economic Perspectives, ( ), – . Haavelmo, T. ( ). “ e Statistical Implications of a System of Simultaneous Equations.” Econometrica, ( ), . Holland, P. W. ( ). “Statistics and causal inference.” Journal of the American Statistical Association, ( ), – . Imbens, G. W. ( , March ). Potential outcome and directed acyclic graph approaches to causality: Relevance for empirical practice in economics (arXiv No. . ). Leamer, E. E. ( ). “Let’s take the con out of econometrics.” e American Economic Review, ( ), – . Murphy, R. T. ( ). Educational e ectiveness of sesame street: A review of the rst twenty years of research – (Report RR- - ). Education Testing Service. Neapolitan, R. E. ( ). “Probabilistic reasoning in expert systems: eory and algorithms.” Wiley. Pearl, J. ( ). “Probabilistic reasoning in intelligent systems: Networks of plausible inference.” Kaufmann.
  59. REFERENCES 32 Pearl, J. ( ). “Causal inference without counterfactuals:

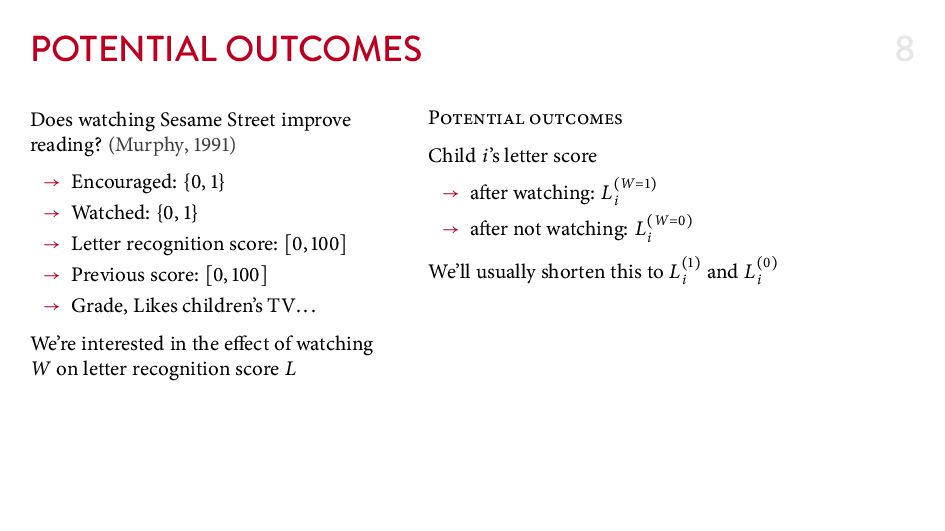
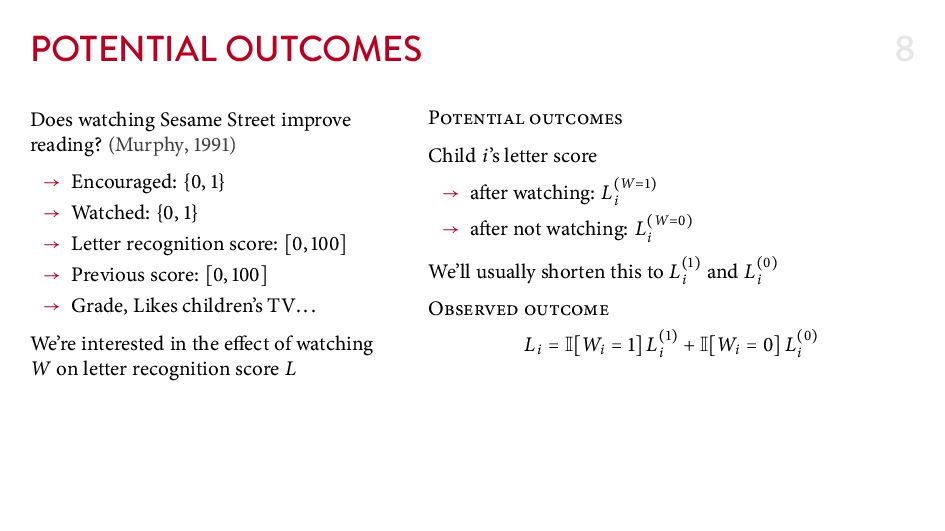
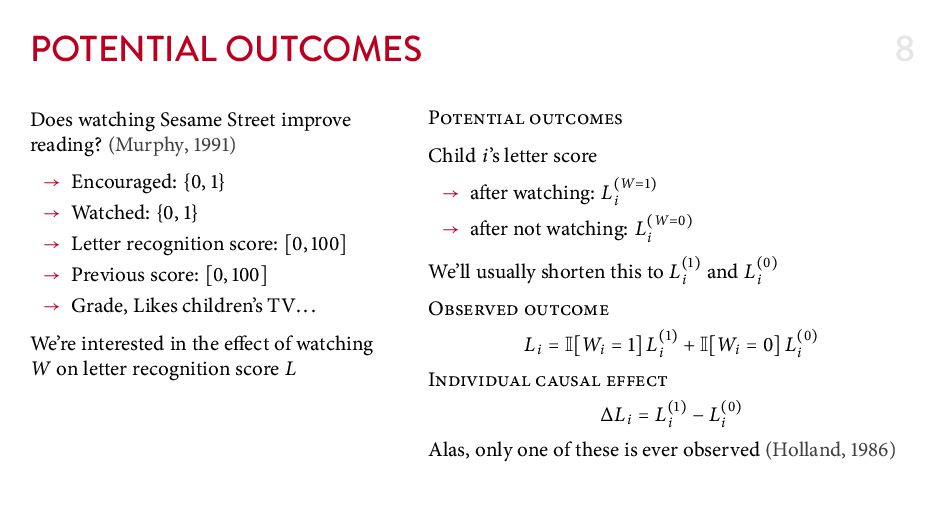
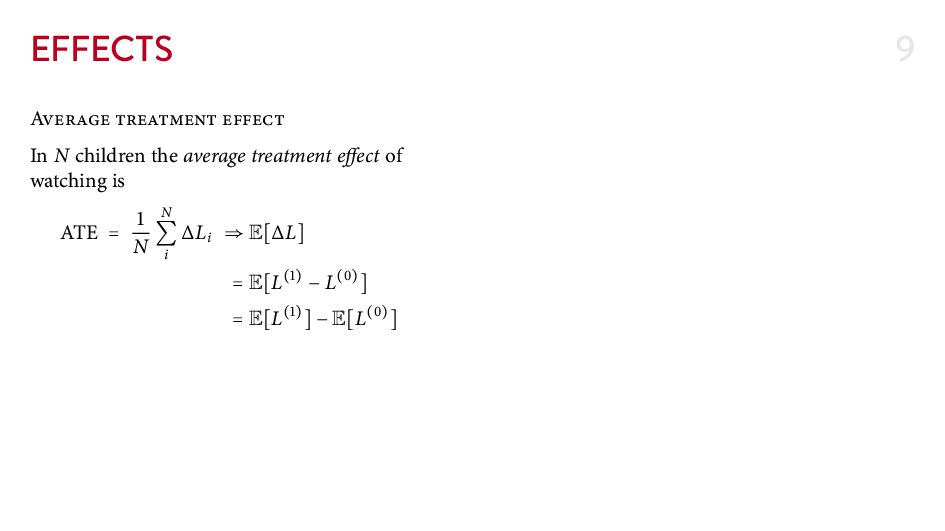
    Comment.” Journal of the American Statistical Association, ( ), – . Pearl, J., Glymour, M., & Jewell, N. P. ( ). “Causal inference in statistics: A primer.” Wiley. Pearl, J., & Verma, T. ( ). Equivalence and synthesis of causal models. In B. D’Ambrosio & P. Smets (Eds.), UAI ’ : Proceedings of the seventh annual conference on uncertainty in arti cial intelligence. Morgan Kaufmann. Rubin, D. ( ). “Which ifs have causal answers (Comment on ‘Statistics and causal inference’ by Paul W. Holland).” Journal of the American Statistical Association, , – . Sesame Street - Elmo’s Sing-Along Guessing Game and Elmocize. ( , October ). Shalizi, C. R. ( ). Advanced Data Analysis from an Elementary Point of View. Sober, E. ( ). “A theory of contrastive causal explanation and its implications concerning the explanatoriness of deterministic and probabilistic hypotheses.” European Journal for Philosophy of Science, ( ), . Strotz, R. H., & Wold, H. O. A. ( ). “Recursive vs. nonrecursive systems: An attempt at synthesis (Part I of a triptych on causal chain systems).” Econometrica, ( ), . Sutton, W., & Linn, E. ( ). “Where the money was.” Broadway Books.
  60. REFERENCES 33 Uhler, C., Raskutti, G., Bühlmann, P., & Yu,

    B. ( ). “Geometry of the faithfulness assumption in causal inference.” e Annals of Statistics, ( ), – . Wright, S. ( ). “ e method of path coe cients.” e Annals of Mathematical Statistics, ( ), – .
  61. HISTORY: GRAPHS AND EQUATIONS 34 Biology, Statistics → Wright (

    ) introduced path diagrams for genetics, and ‘Wright’s Rules’ Economics → Started early on graphs (Haavelmo, ; Strotz & Wold, ) → had a ‘credibility revolution’ (Angrist & Pischke, ; Leamer, ) → now leans strongly towards potential outcomes (Imbens, ) Psychology, Sociology → Structural Equation Modeling (SEM) built a er Cowles Commission ( ) → In the s by Jöreskog at ETS and Wold at Uppsala University. → Still kind of tense about causal inference...
  62. HISTORY: GRAPHS AND EQUATIONS 35 Computer Science → In Bayesian

    expert systems research via probability on graphs, but with little causal focus: (Neapolitan, ; Pearl, ) → In arti cial intelligence: Pearl ( ) Political science → A stronghold of the Neyman-Rubin causal model but increasingly graphical: Sekhon, Imai, Green. Epidemiology → Graphs and potential outcomes in equal measure, pioneered by Hernan and Robins. → at’s why we’re reading their book.
  63. GRAPH LIMITATIONS: ACYCLICITY 36 Our DAG framework has trouble with

    → ings that are logically connected → Instantaneous feedback (but we can sometimes ‘unroll’) → Equilibrium relationships → Control relations Dealing with causal inference with these features is an open research question → in case you fancied a PhD project in a few years... A Cyclic Graf
  64. GRAPH LIMITATIONS: FAITHFULNESS 37 X Y Z where Z =

    єZ X = γ + ZγZ + єX Y = β + XβX + ZβZ + єY But what if βX = −γZ βZ?
  65. GRAPH LIMITATIONS: FAITHFULNESS 37 X Y Z where Z =

    єZ X = γ + ZγZ + єX Y = β + XβX + ZβZ + єY But what if βX = −γZ βZ? For all parameter combination like that that exactly cancel X ⊥ ⊥ Z Despite the presence of a link from Z to X is is an example of unfaithfulness: an independence relationship in the data not implied by the graph → In theory: is never happens → In nite samples: is happens, but only by accident (Although a lot of parameter space is nearly unfaithful Uhler et al. ( )) → In practice: More o en because we make it happen