Upgrade to Pro — share decks privately, control downloads, hide ads and more …

People and Economies: How quantitative regional scenarios can set the table for policy and planning

People and Economies: How quantitative regional scenarios can set the table for policy and planning

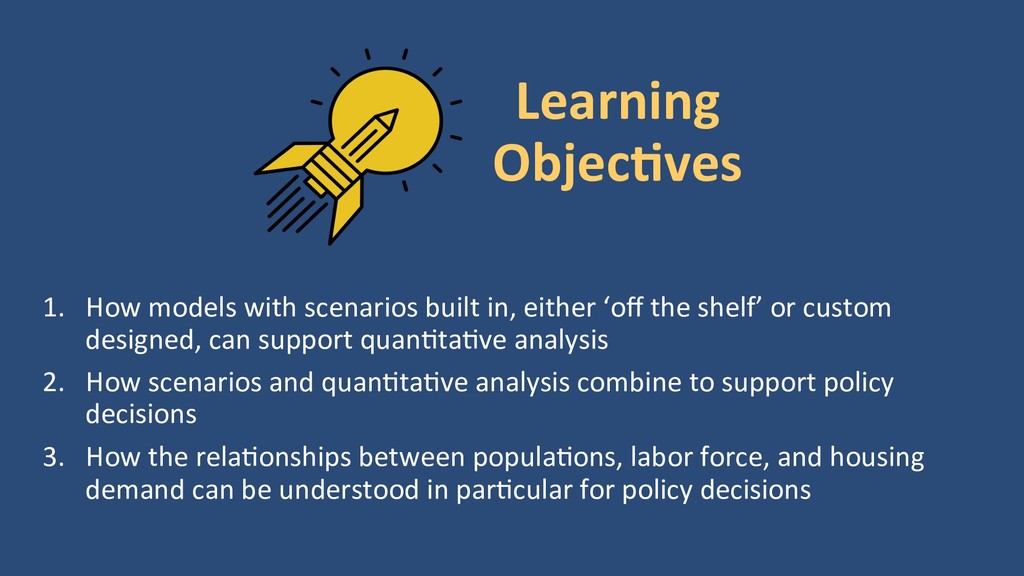
This webinar, featuring the work of the Chicago Metropolitan Agency for Planning (CMAP) and the Metropolitan Area Planning Council (MAPC), covers the following learning objectives: 1) how models with scenarios built in, either ‘off the shelf’ or custom designed, can support quantitative analysis, 2) how scenarios and quantitative analysis combine to support policy decisions, and 3) how the relationships between populations, labor force, and housing demand can be understood in particular for policy decisions. The companion video is available at https://vimeo.com/287509451. Find out more about the Consortium for Scenario Planning at http://www.scenarioplanning.io.

More Decks by Consortium for Scenario Planning

Other Decks in Technology

Transcript

  1. SUMMER SCENARIOS An Educa1onal Webinar Series By the Consor1um for

    Scenario Planning www.scenarioplanning.io
  2. People and Economies: How quan4ta4ve regional scenarios can set the

    table for policy and planning Webinar 5 of 5 www.scenarioplanning.io/summer-scenarios/
  3. Learning Objec1ves 1.  How models with scenarios built in, either

    ‘off the shelf’ or custom designed, can support quan=ta=ve analysis 2.  How scenarios and quan=ta=ve analysis combine to support policy decisions 3.  How the rela=onships between popula=ons, labor force, and housing demand can be understood in par=cular for policy decisions
  4. Agenda 1. Speaker introduc=ons 2. Interview with Chicago Metropolitan Agency

    for Planning (CMAP) and Metropolitan Area Planning Council (MAPC) 3. Audience ques=ons 4. Closing
  5. Speakers & Facilitator Speakers: •  Tim Reardon, Data Services Director,

    Metropolitan Area Planning Council (MAPC) •  Drew Williams-Clark, Principal Planner, Chicago Metropolitan Agency for Planning (CMAP) Facilitator: •  Janae Futrell, AICP, LEED AP Decision Support Fellow, Consor=um for Scenario Planning, Lincoln Ins=tute of Land Policy, [email protected]
  6. Upcoming Consor1um Conference September 12-14 in Columbus, Ohio with host

    agency Mid-Ohio Regional Planning Commission Register & Join Us! www.scenarioplanning.io/conferences/
  7. HOMES FOR A CHANGING REGION: A New Approach to Housing

    Planning Source: American Community Survey, 2011-2015 People-focused Forward-looking Market-based 43 Chicago- area municipali1es to complete plans by end of 2017
  8. HOMES FOR A CHANGING REGION: 2017 Pilot Project Source: American

    Community Survey, 2011-2015 New planning tools Tes1ng a new approach – assistance to more communi1es Efficient access to data about local housing markets: Homes for a Changing Region Toolkit & Regional Housing Solu6ons submarket analysis
  9. 2017 HOUSING TRENDS: Popula4ons shiMing to infill Source: American Community

    Survey, 2011-2015 Trading big lots and yards for proximity Avoiding car dependency Suburbs are urbanizing – especially near transit
  10. HOUSING SUBMARKET CLUSTER ANALYSIS: Ins4tute for Housing Studies Source: American

    Community Survey, 2011-2015 Clustering model classifies census tracts based on: 98% of Steger falls in Similari1es – How closely related tract characteris=cs are across a range of variables Differences – How dis=nct or separated tracts are from others across a range of variables
  11. Socioeconomic projec4ons are essen4al inputs to local/regional planning •  Housing

    needs forecasts •  School enrollment •  Water demand •  Sec=on 176(c)(1)(B)(iii) of the Clean Air Act: “The determina=on of conformity shall be based on the most recent es=mates of emissions, and such es=mates shall be determined from the most recent popula1on, employment, travel, and conges1on es1mates as determined by the MPO or other agency authorized to make such es=mates.“
  12. Demographic condi4ons can change quickly (60,000) (50,000) (40,000) (30,000) (20,000)

    (10,000) - 10,000 2000 2001 2002 2003 2004 2005 2006 2007 2008 2009 2010 2011 2012 2013 2014 2015 2016 2017 Massachusetts Net Domestic Migration, 2000 - 2017 Use of migra=on rates from 2009 instead of 2005 would result in popula=on difference of 1.8 million over a 30-year forecast period.
  13. How has MAPC’s planning work helped you to understand the

    rela=onship between popula=ons, labor force, and housing demand? How has this work impacted the narra=ve on such topics regionally?
  14. 1) Construct mul4ple alterna4ve demographic futures Status Quo Stronger Region

    Regional in/out migration rates held constant at 2006 – 2011 average Domestic outmigration slows by 1.5% per year; in-migration increase 0.75% per year Municipal migration rates held constant at 2000 – 2010 averages 1% decrease in 25 – 39 year old migration out of urban communities Housing demand preferences held constant at 2006 – 2010 average, by age and municipality 2% increase in rate at which seniors transition from single family to multifamily
  15. 2) Connect demographics to economic growth poten4al 2,543,000 2,509,000 2,526,000

    2,515,500 2,616,000 2,643,000 2,690,000 2,400,000 2,450,000 2,500,000 2,550,000 2,600,000 2,650,000 2,700,000 2,750,000 2010 2020 2030 2040 Population in the Labor Force, Metro Boston, 2010 - 2040, Status Quo vs. Stronger Region Status Quo Stronger Region “Status Quo” migra=on pa]erns result in no net change in labor force. “Stronger region” assump=ons (net in-migra=on of 10,000 per year) indicate poten=al for 175,000 new workers by 2040 (7% increase) Both projec=ons fall short of BLS-based employment forecast of 17% growth.
  16. 3) Link economic growth scenarios to housing demand 139,000 155,000

    11,000 6,000 53,000 91,000 95,000 178,000 - 50,000 100,000 150,000 200,000 250,000 300,000 350,000 400,000 450,000 Status Quo Stronger Region Total Net Housing Demand, by Type, Metro Boston, 2010 - 2040 Multi-Family -Rent Multi-Family -Own Single Family -Rent Single Family -Own Source: MAPC Population Projections, 2014
  17. What changes have you observed in the region's popula=on lately,

    and how have they pushed MAPC to develop more robust models of demographic change?
  18. Source: PUMS 0% 10% 20% 30% 40% 50% 60% 70%

    80% 60-64 65-69 70-74 75-79 80-84 85+ Labor Force Participation Rate, Age 60+, MAPC Region 2000 - 2016 MAPC_2000 MAPC_12_16 The next curveball: Baby Boomers’ delayed retirement Share of residents age 65-69 still in labor force increased by 13 percentage points from 2000 to 2016. How will this affect need for new labor supply?
  19. Source: PUMS 0% 10% 20% 30% 40% 50% 60% 15-19

    20-24 25-29 30-34 35-39 Headship Rates, under-40 population, MAPC 2000 - 2016 MAPC_2000 MAPC_12_16 The shock absorber: Millennial’s delayed household formation Share of residents age 20-24 heading a household decreased by 7 percentage points from 2000 to 2016. How will this pent up demand affect need for new housing?
  20. Civilian population by age, sex, race, educational attainment Civilian educational

    attainment rates (by age, race) Civilian workers in hh by age, sex, race, educational attainment Civilian Labor Force Participation rates (by age, sex, education) Civilian population in households by age, sex, race Input rates- assumptions that can be changed Output table Civilian worker headship rates by number of workers, age, wage Households by number of workers, age and wage of householder Civilian workers in hh by age, educational attainment, wage Wages by educational attainment, sex, race Labor Force -> HH model
  21. Householders by age, household type Headship rates by age, hh

    type Households by age, household type, size Household size by age, household type (controlled to total pop) Living arrangement by age (living alone, no-child hh, hh with child) Civilian population in households by type, age, sex, race Civilian population by age, sex, and race Number of workers in hh by age, hh type, size Households by age, hh type, size, workers Input rates- assumptions that can be changed Output table Household model Combines with labor force model
  22. Civilian population by age, sex, race, educational attainment Civilian hh

    workers by age, sex, race, educational attainment Civilian hh workers by age, educational attainment, wage Households by age, wage of householder Households by age, workers, income category Pop (by age, sex race) in GQ, living alone, in no-child HH, in HH w/child under 18 Householders by age, HH type Households by age, HH type, size Households by age, HH type, size, workers Households by age, HH type, HH size, workers, income category Total population in HH Auto calibration Total Workers Auto calibration Civilian population in households by age, sex, race Combining Labor Force and Household Formation models
  23. Benefits •  Our new method allows for more nuance in

    household level characteristics and allows for the creation of scenarios based on demographic and policy changes •  We can now provide quantitative insight on many policy topics: •  Reduced disparities in educational outcomes by race •  Increases in low income wages •  Delayed household formation due to student loan crisis •  Reduction of gender wage gap
  24. What is the Consor1um? It provides training and peer exchange

    to support professionals as they get started with scenario planning and take it to more advanced levels. Who can benefit? Urban, regional, and rural planners and managers, as well as others, are welcome. Official partners include: How can I learn more? Become a par=cipant or join the mailing list by visi=ng the website at scenarioplanning.io or contac=ng Janae at [email protected].
  25. Upcoming Consor1um Conference September 12-14 in Columbus, Ohio with host

    agency Mid-Ohio Regional Planning Commission Register & Join Us! www.scenarioplanning.io/conferences/