Upgrade to Pro
— share decks privately, control downloads, hide ads and more …
Speaker Deck
Features
Speaker Deck
PRO
Sign in
Sign up for free
Search
Search
Prometheus - A Whirlwind Tour
Search
Cindy Sridharan
May 10, 2017
Technology
11
3.8k
Prometheus - A Whirlwind Tour
A presentation on Prometheus at OSCON 2017.
Cindy Sridharan
May 10, 2017
Tweet
Share
More Decks by Cindy Sridharan
See All by Cindy Sridharan
Unmasking netpoll.go
copyconstructor
4
2.5k
Monitoring in the time of Cloud Native
copyconstructor
4
410
The Python Deployment Albatross - PyTennessee 2017
copyconstructor
1
530
Prometheus at Google NYC Tech Talks Nov 2016
copyconstructor
10
2.5k
Other Decks in Technology
See All in Technology
配列に見る bash と zsh の違い
kazzpapa3
3
160
量子クラウドサービスの裏側 〜Deep Dive into OQTOPUS〜
oqtopus
0
140
Tebiki Engineering Team Deck
tebiki
0
24k
コンテナセキュリティの最新事情 ~ 2026年版 ~
kyohmizu
2
300
SRE Enabling戦記 - 急成長する組織にSREを浸透させる戦いの歴史
markie1009
0
140
[CV勉強会@関東 World Model 読み会] Orbis: Overcoming Challenges of Long-Horizon Prediction in Driving World Models (Mousakhan+, NeurIPS 2025)
abemii
0
140
データの整合性を保ちたいだけなんだ
shoheimitani
8
3.2k
Embedded SREの終わりを設計する 「なんとなく」から計画的な自立支援へ
sansantech
PRO
3
2.6k
フルカイテン株式会社 エンジニア向け採用資料
fullkaiten
0
10k
We Built for Predictability; The Workloads Didn’t Care
stahnma
0
140
Digitization部 紹介資料
sansan33
PRO
1
6.8k
22nd ACRi Webinar - NTT Kawahara-san's slide
nao_sumikawa
0
100
Featured
See All Featured
BBQ
matthewcrist
89
10k
brightonSEO & MeasureFest 2025 - Christian Goodrich - Winning strategies for Black Friday CRO & PPC
cargoodrich
3
100
Tell your own story through comics
letsgokoyo
1
810
The untapped power of vector embeddings
frankvandijk
1
1.6k
Kristin Tynski - Automating Marketing Tasks With AI
techseoconnect
PRO
0
150
Everyday Curiosity
cassininazir
0
130
How Fast Is Fast Enough? [PerfNow 2025]
tammyeverts
3
450
Digital Projects Gone Horribly Wrong (And the UX Pros Who Still Save the Day) - Dean Schuster
uxyall
0
380
Hiding What from Whom? A Critical Review of the History of Programming languages for Music
tomoyanonymous
2
420
The Spectacular Lies of Maps
axbom
PRO
1
520
Between Models and Reality
mayunak
1
190
Winning Ecommerce Organic Search in an AI Era - #searchnstuff2025
aleyda
1
1.9k
Transcript
Prometheus A Whirlwind Tour Cindy Sridharan Oscon 2017 Austin, Texas
@copyconstruct @copyconstruct @copyconstruct
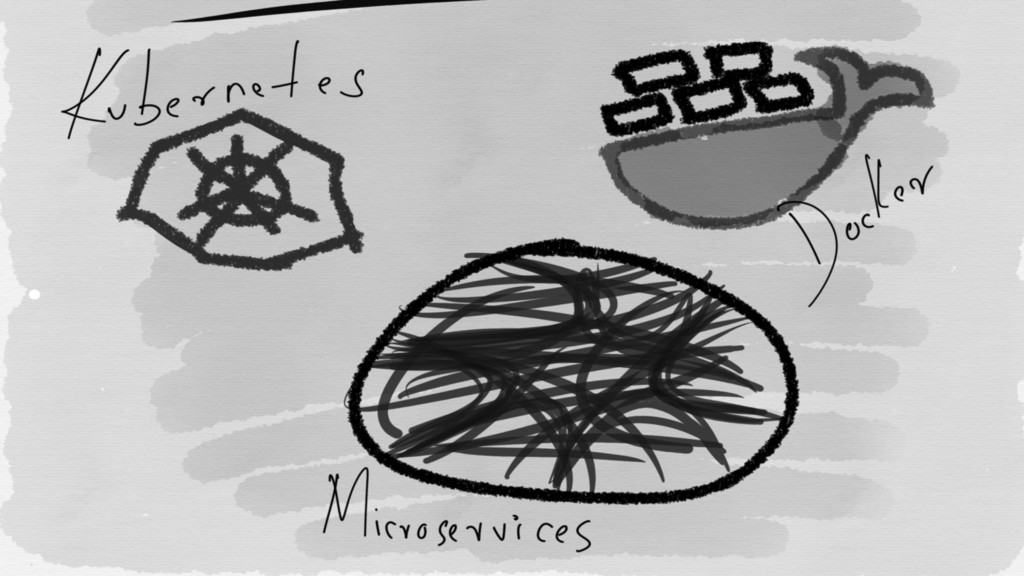
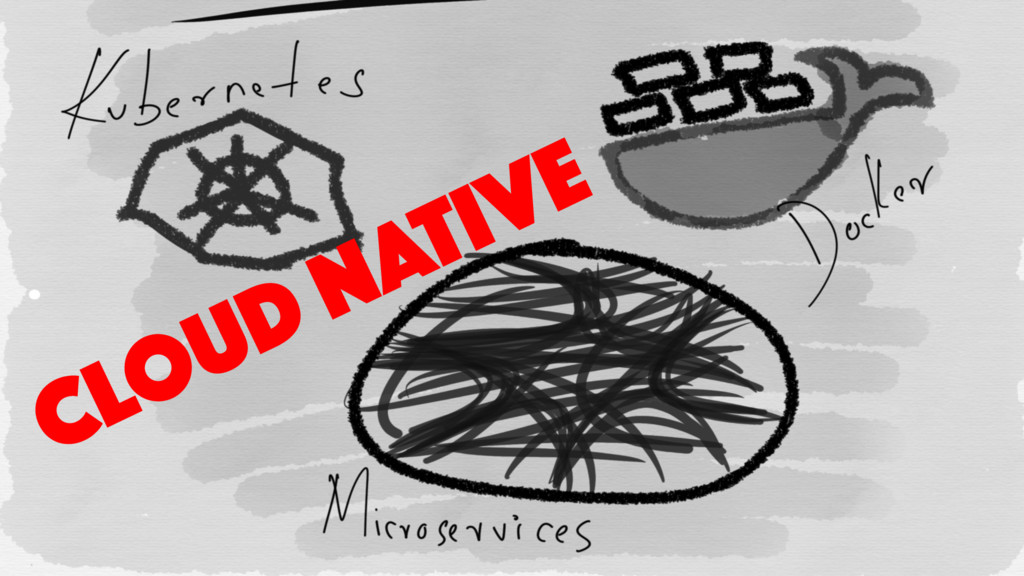
The Future?
None
None
None
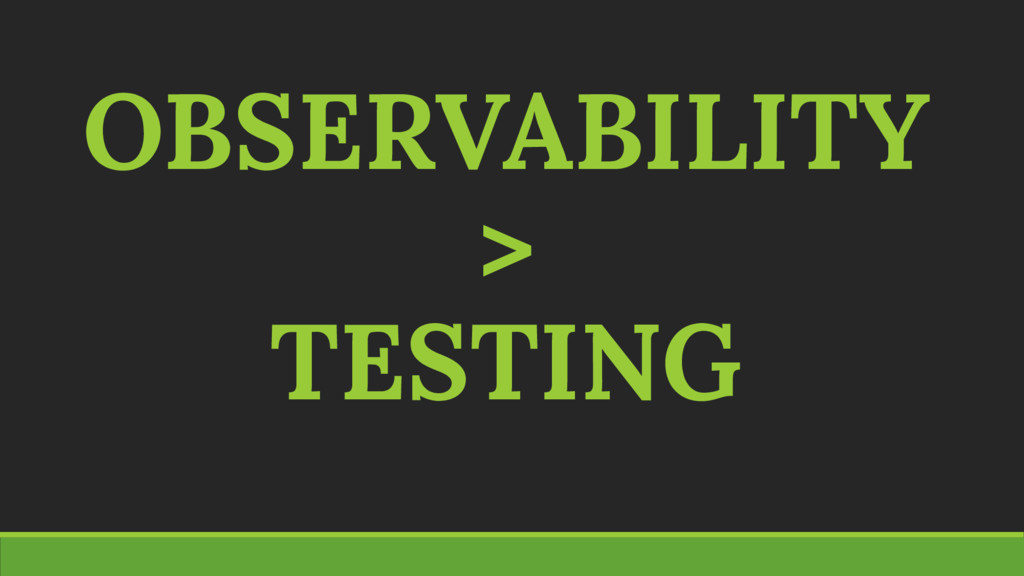
OBSERVABILITY > TESTING
Things testing cannot detect
elasticity of the production environment
unpredictability of inputs
the vagaries of upstream and downstream dependencies
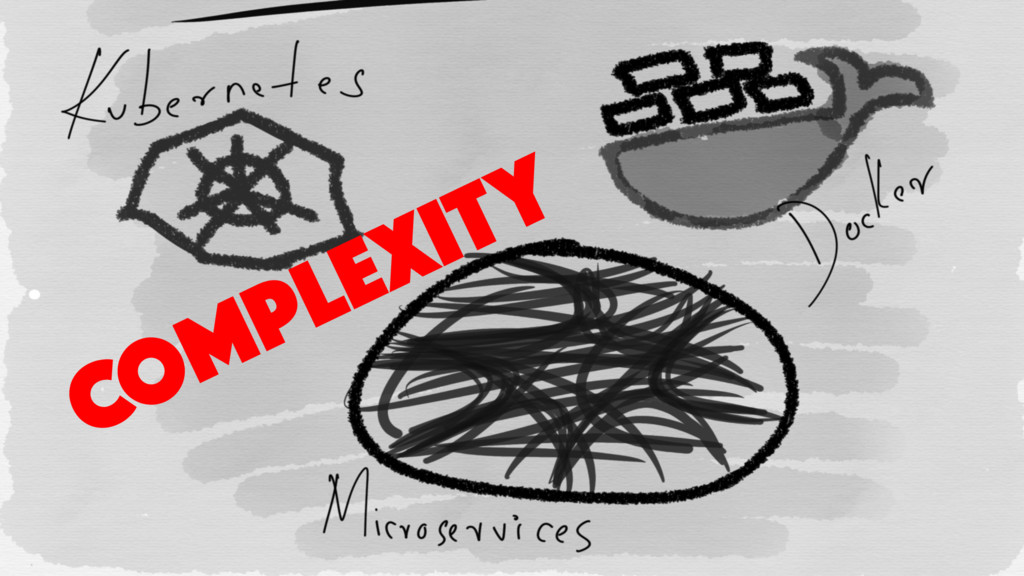
Cloud native architectures need best in class observability
None
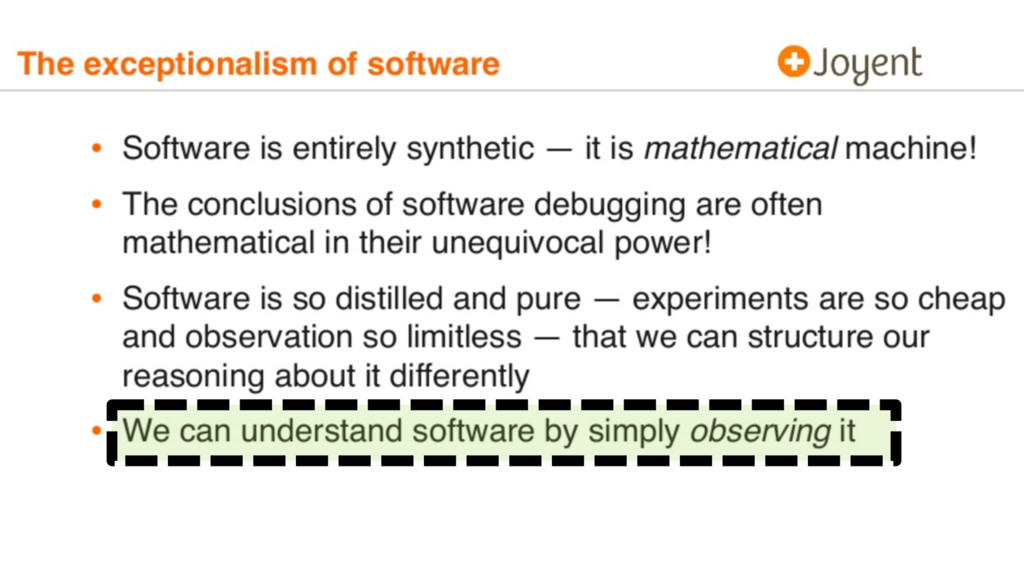
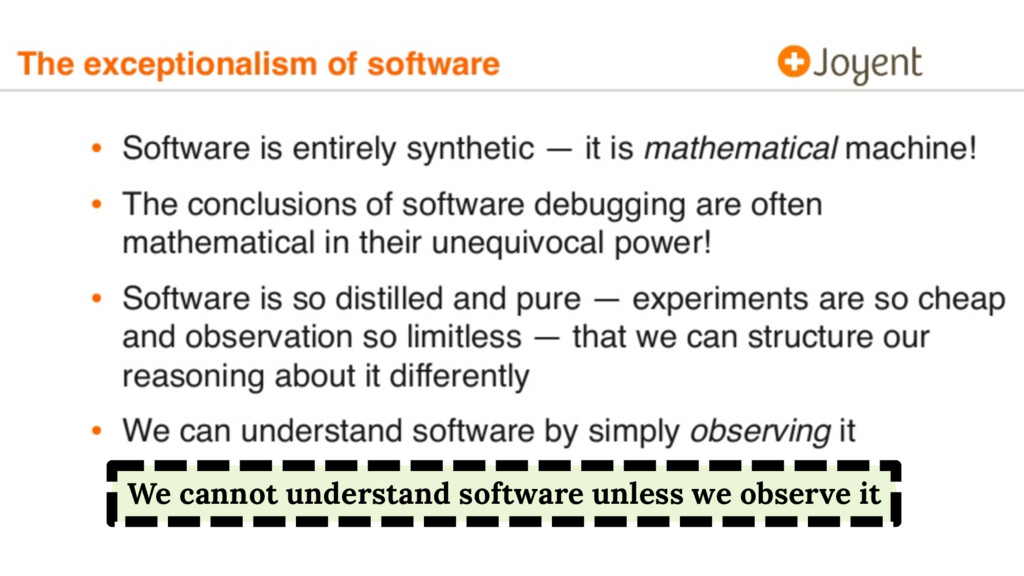
We cannot understand software unless we observe it
Debugging must be viewed as the process by which systems
are understood and improved, not merely as the process by which bugs are made to go away! - Bryan Cantrill
OBSERVABILITY must also be viewed as the process by which
systems are understood and improved, not merely as the process by which bugs are made to go away!
OBSERVABILITY cannot be an afterthought
Instrumentation should be a requirement for a PR to be
merged
OBSERVABILITY needs to be a part of system design and
development
But … what even is “observability” ?
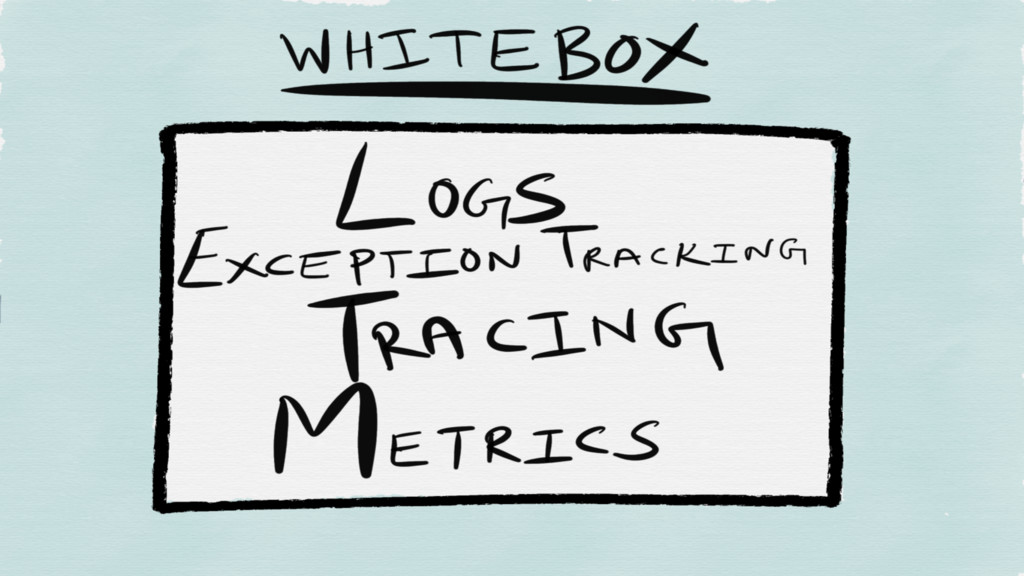
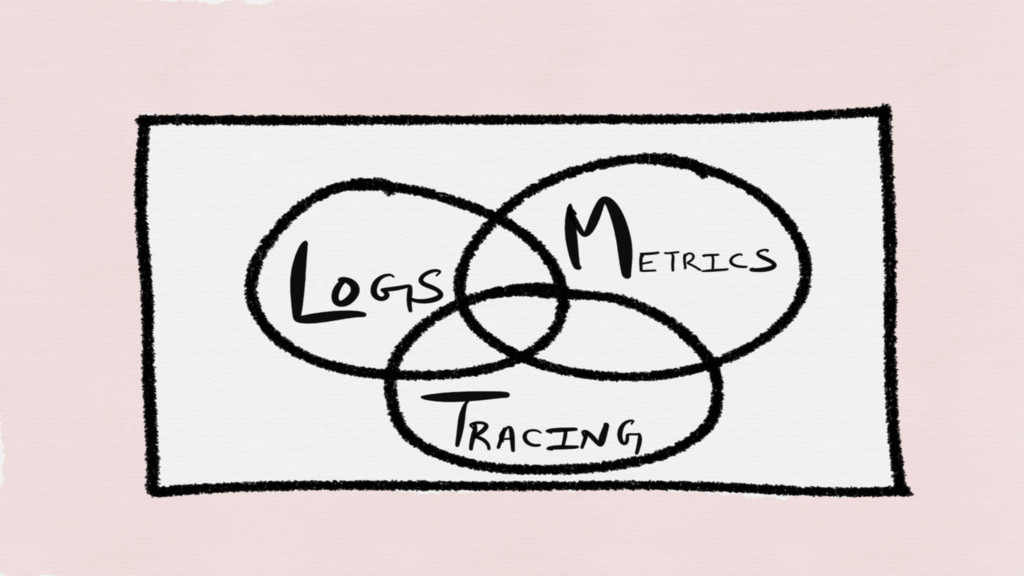
There are three pillars that make up a modern Observability
stack
Logging Tracing Metrics
All three are examples of whitebox “monitoring”
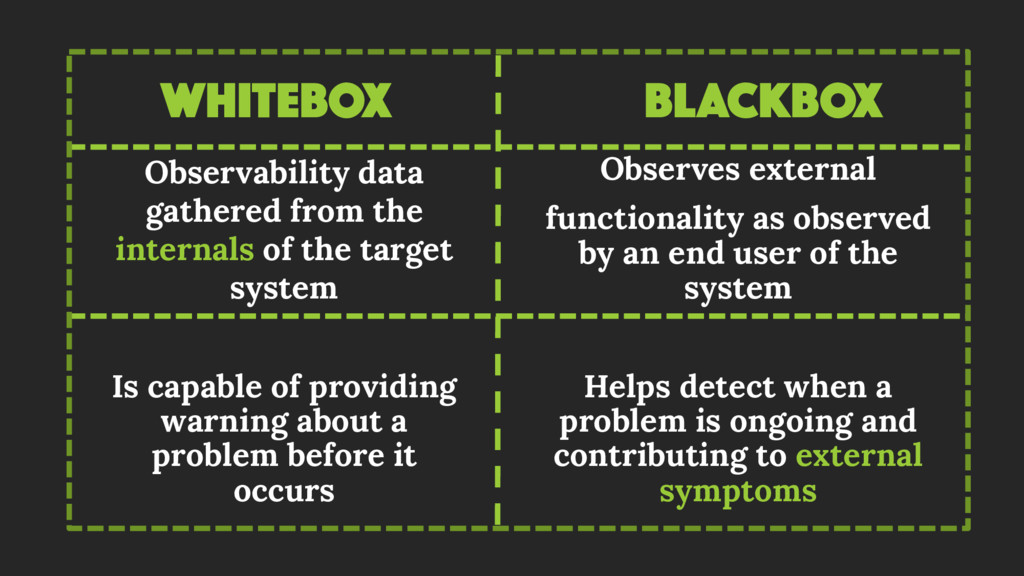
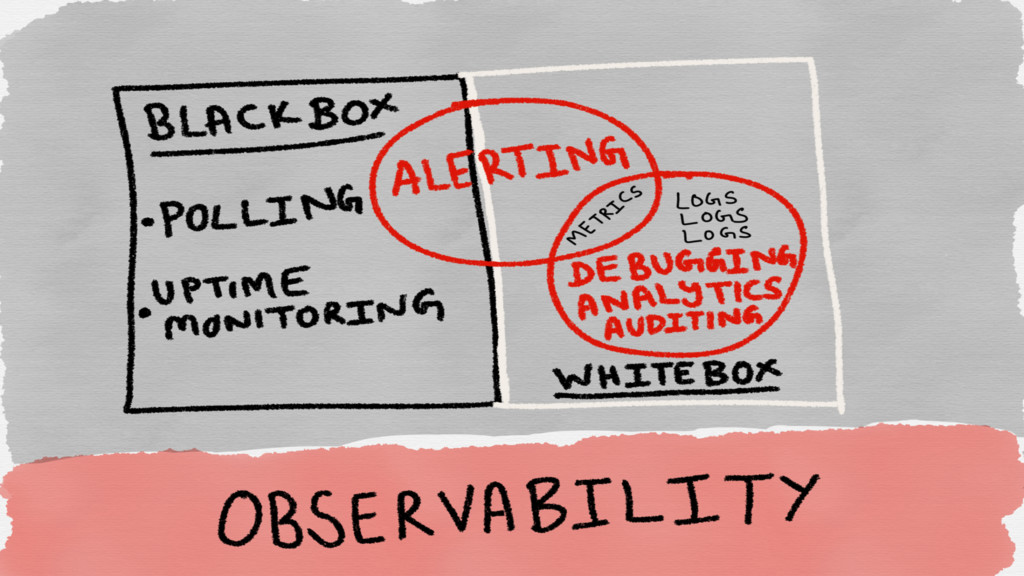
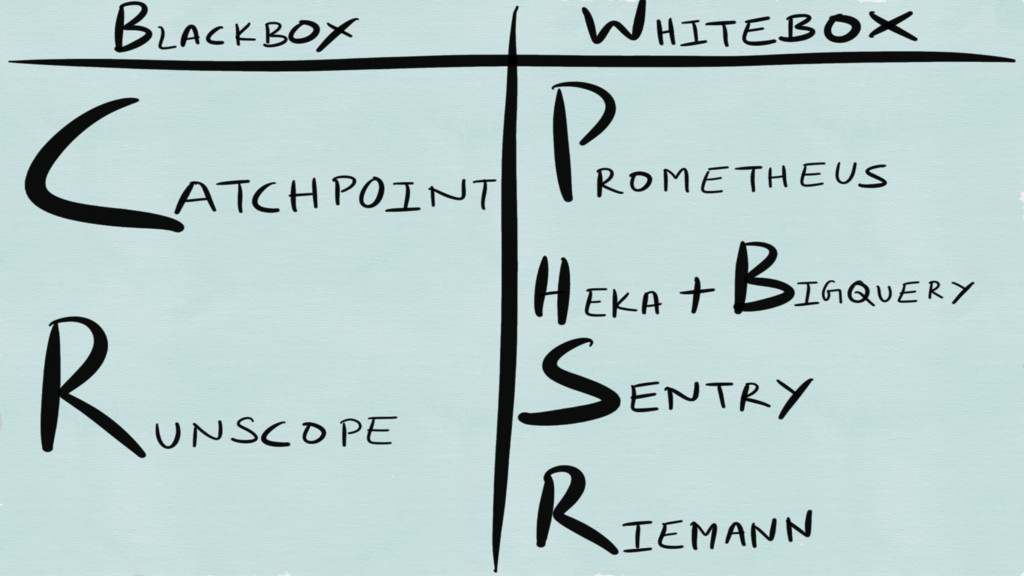
WHITEBOX Observability data gathered from the internals of the target
system Is capable of providing warning about a problem before it occurs BLACKBOX Observes external functionality as observed by an end user of the system Helps detect when a problem is ongoing and contributing to external symptoms
None
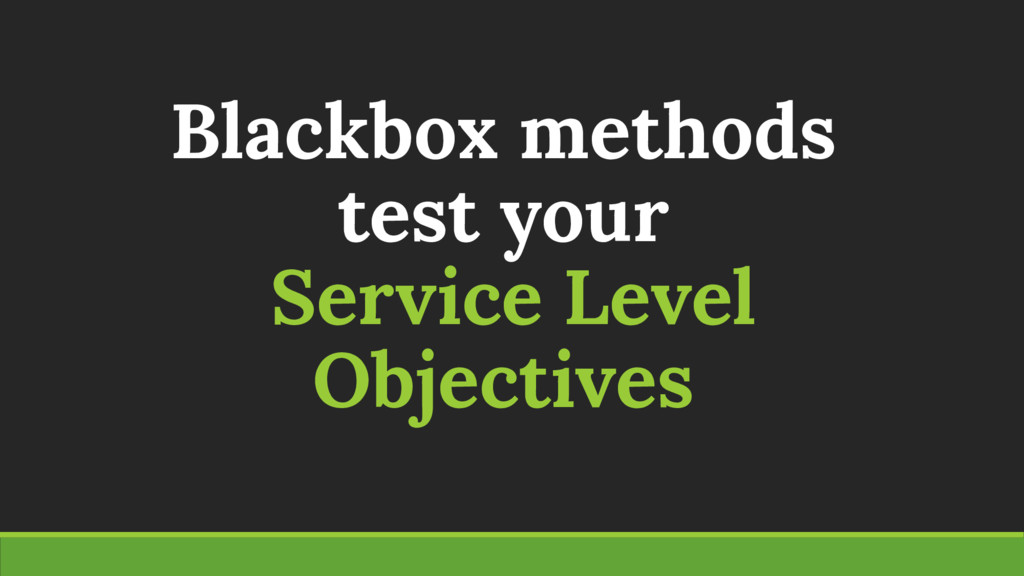
Blackbox methods test your Service Level Objectives
None
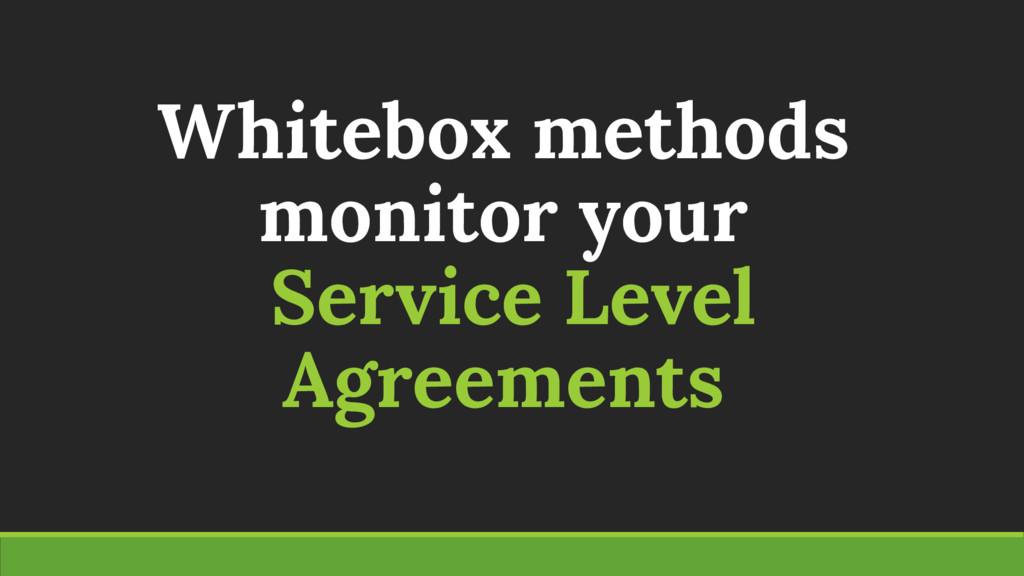
Whitebox methods monitor your Service Level Agreements
None
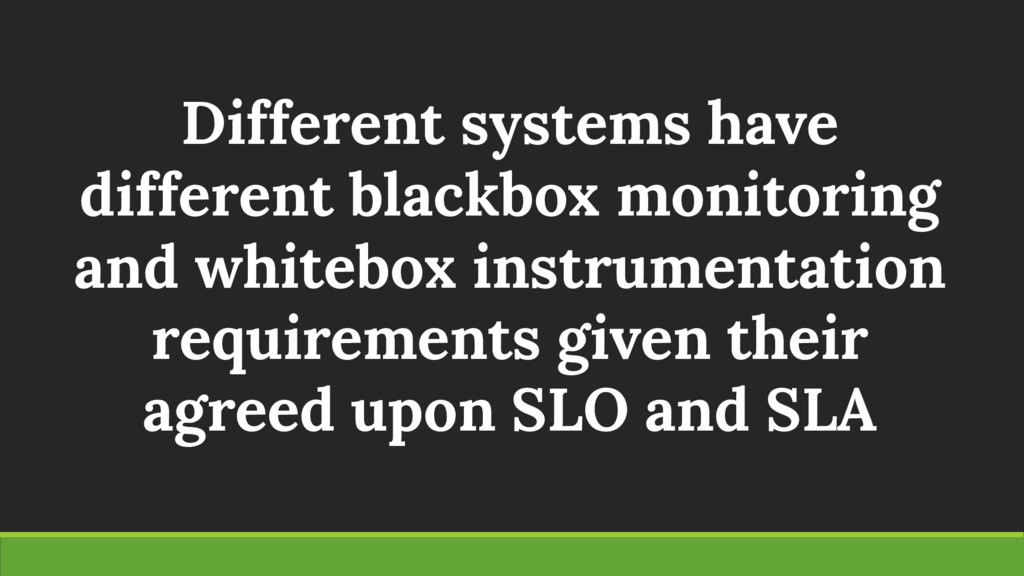
Different systems have different blackbox monitoring and whitebox instrumentation requirements
given their agreed upon SLO and SLA
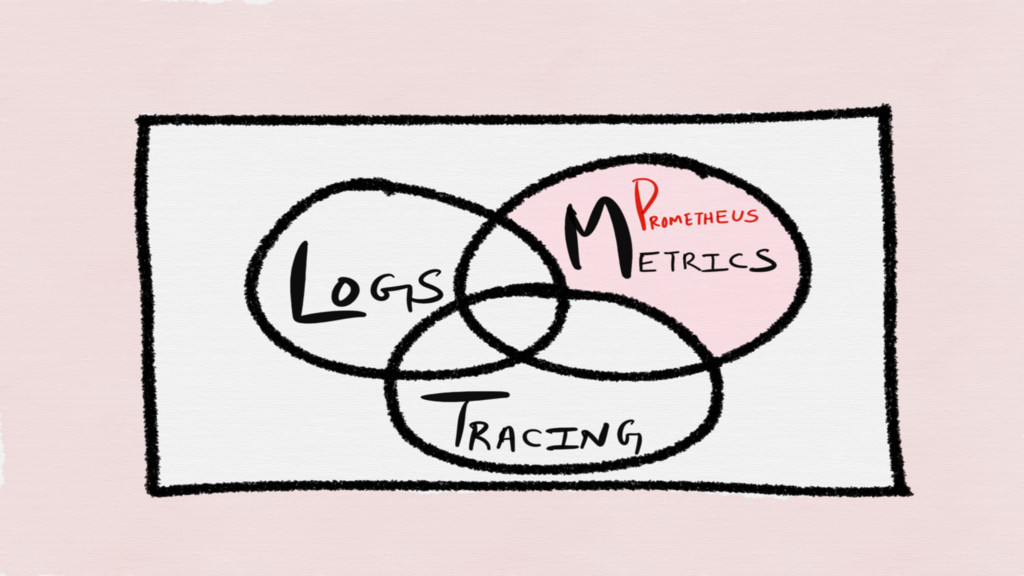
Where does Prometheus fit in here?
None
None
Prometheus
Whitebox monitoring toolkit and a TSDB for metrics
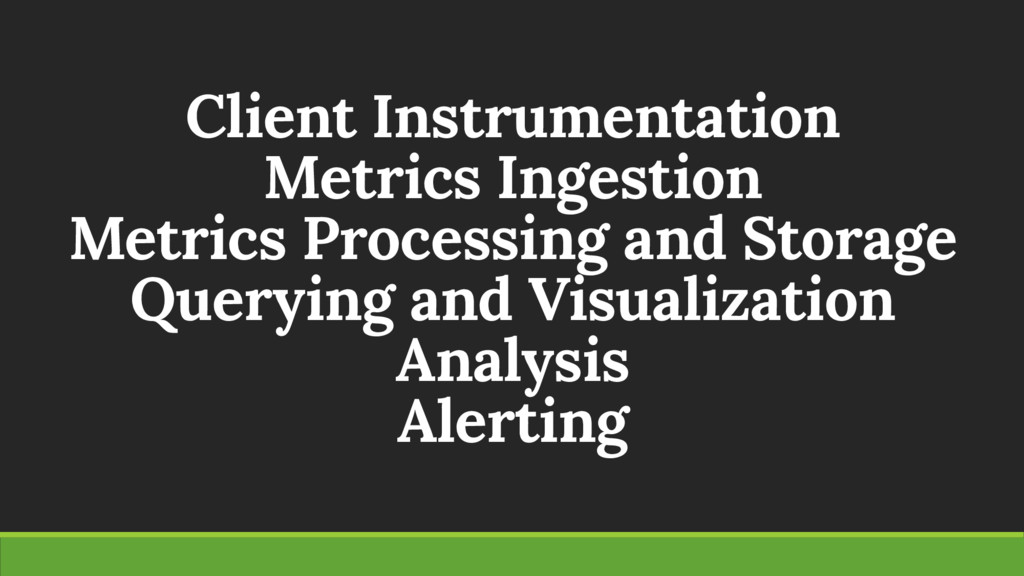
Monitoring Toolkit
Client Instrumentation Metrics Ingestion Metrics Processing and Storage Querying and
Visualization Analysis Alerting
Client instrumentation
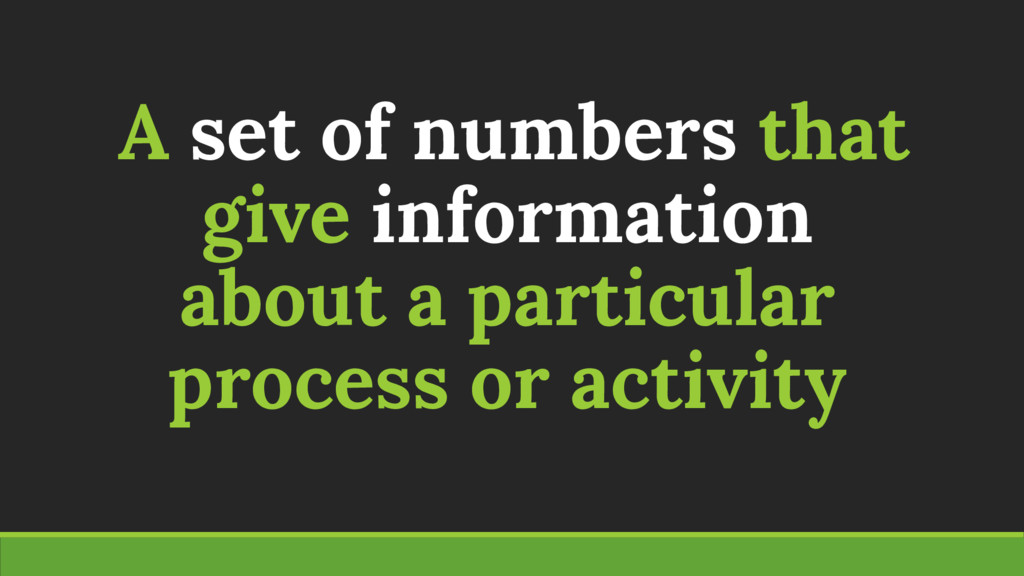
What even is a “metric”?
A set of numbers that give information about a particular
process or activity
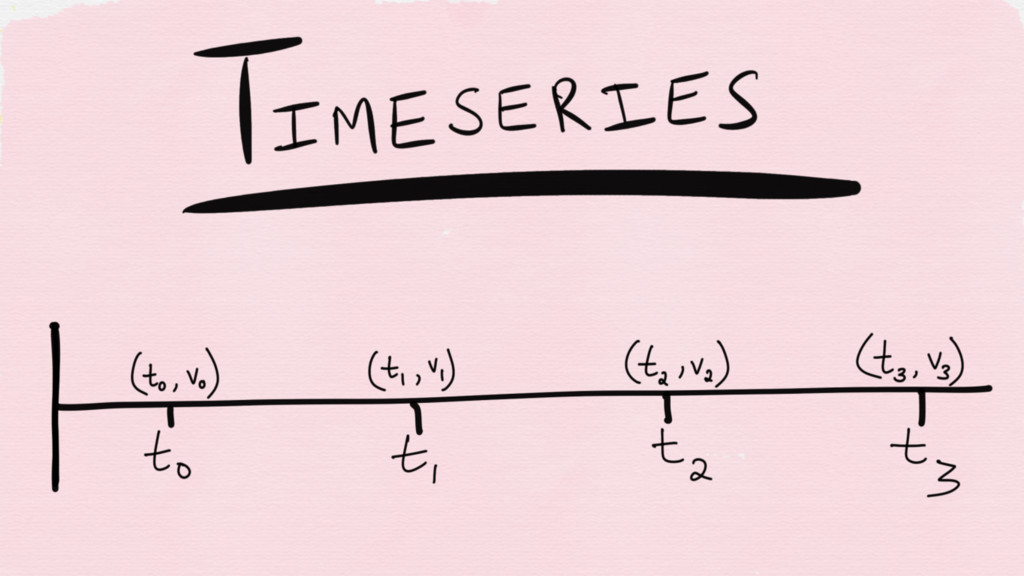
Metrics are usually measured over intervals of time — in other words,
a time series
None
What metrics to collect?
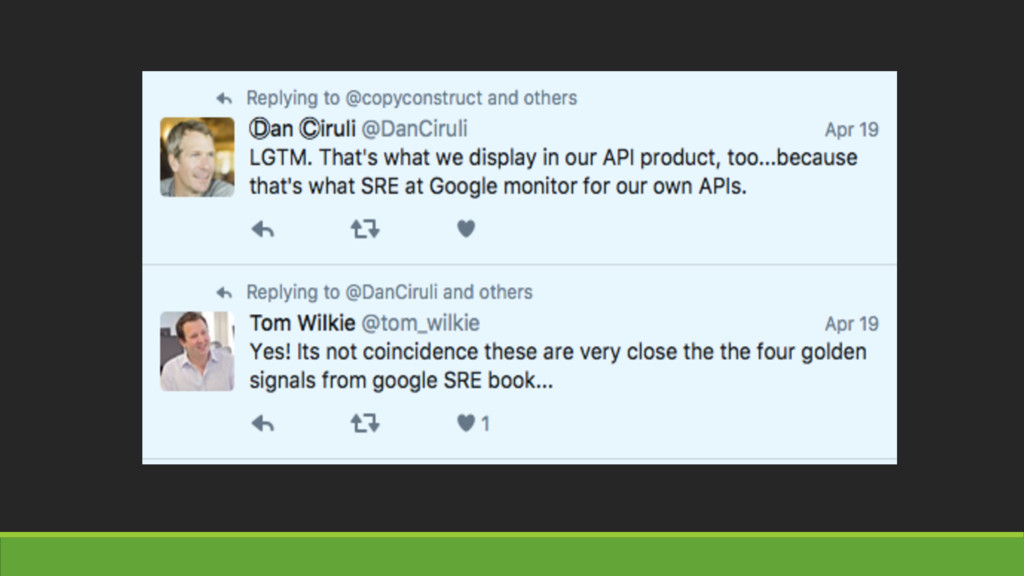
The Four Golden Signals Proposed by the SRE book
Latency Traffic Errors Saturation Proposed by the SRE book
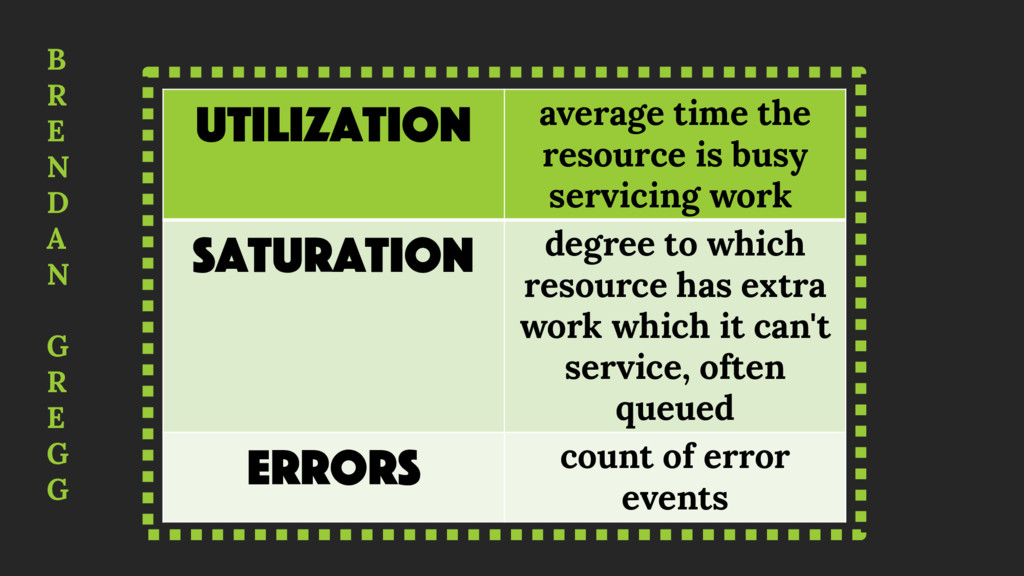
USE method by Brendan Gregg
Utilization average time the resource is busy servicing work Saturation
degree to which resource has extra work which it can't service, often queued Errors count of error events B R E N D A N G R E G G
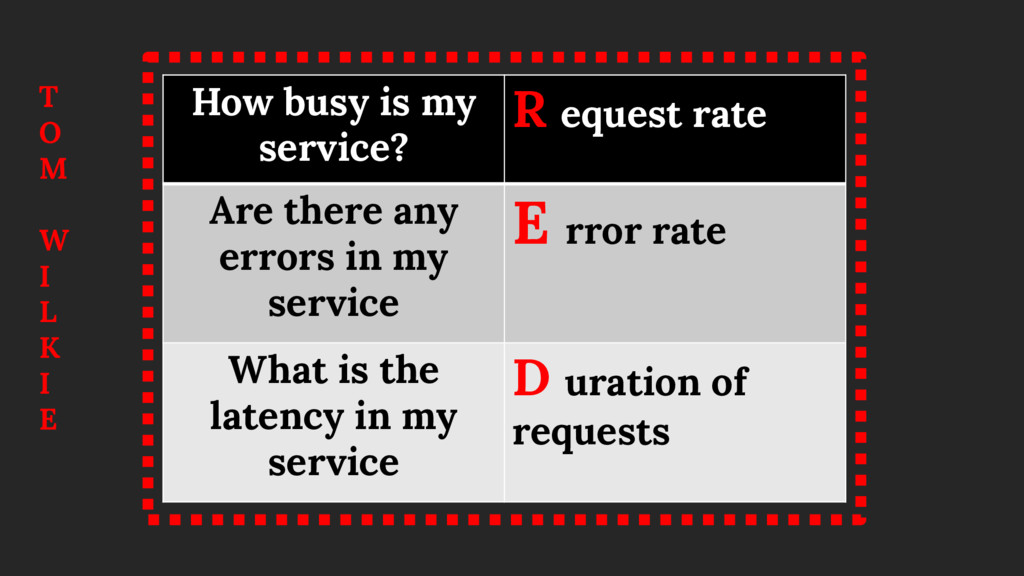
RED method by Tom Wilkie
How busy is my service? R equest rate Are there
any errors in my service E rror rate What is the latency in my service D uration of requests T O M W I L K I E
None
Prometheus has stateful client libraries in all major languages
Server is agnostic to the type of metric
The Prometheus client libraries support four types of metrics
Counters Gauges Histogram Summary
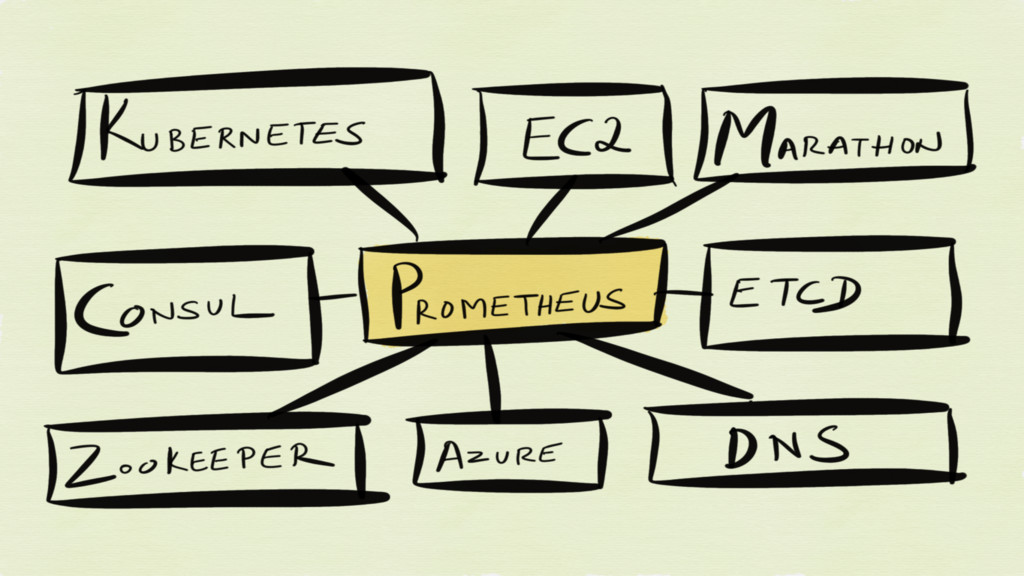
“Target” discovery happens via service discovery
None
Metrics ingestion
None
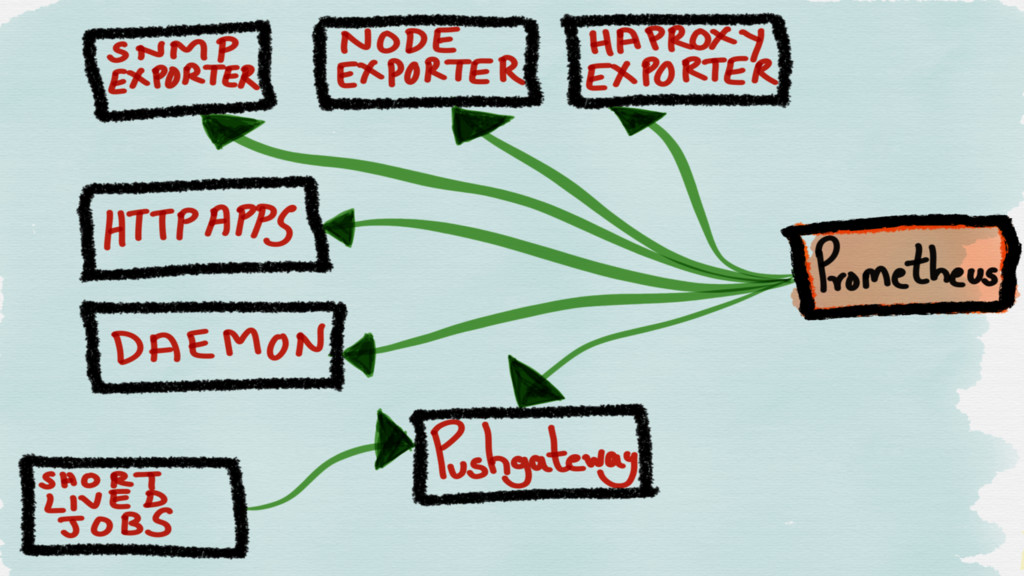
Pull over HTTP
Does Pull scale?
Prometheus isn’t an event based system or Nagios that spawns
a subprocess while “pulling”
Pull lowers risk of DDoSing your monitoring system
Pull based systems monitor if a service is down (if
a scrape fails) as a part of gathering metrics
None
None
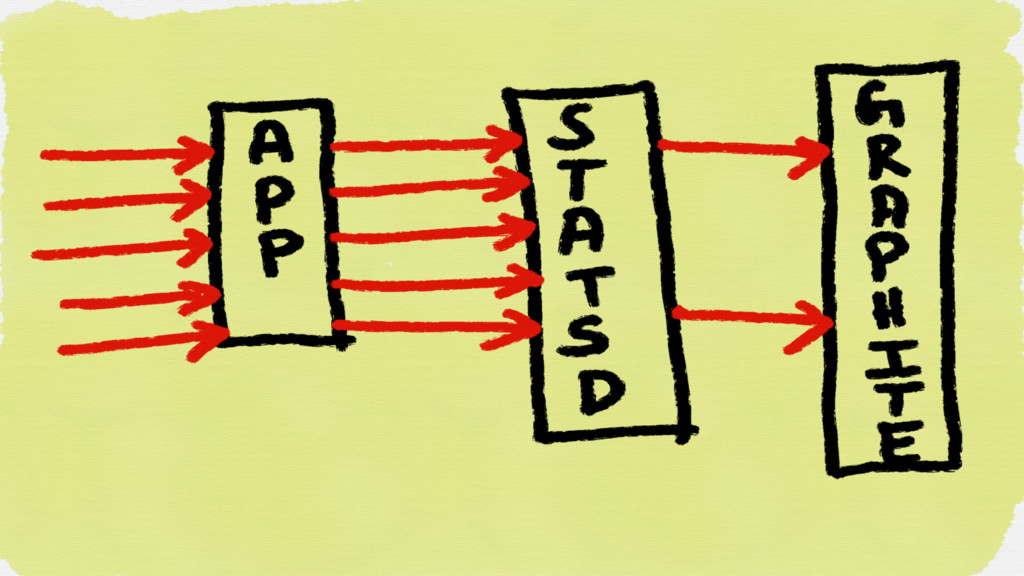
With statsd type of systems, the application sends a UDP
message for every event it observes
Monitoring traffic increases proportionally to user traffic or whatever traffic
is generating monitoring data
Prometheus clients aggregate metrics in memory which is scraped by
the Prometheus server upon regular intervals
None
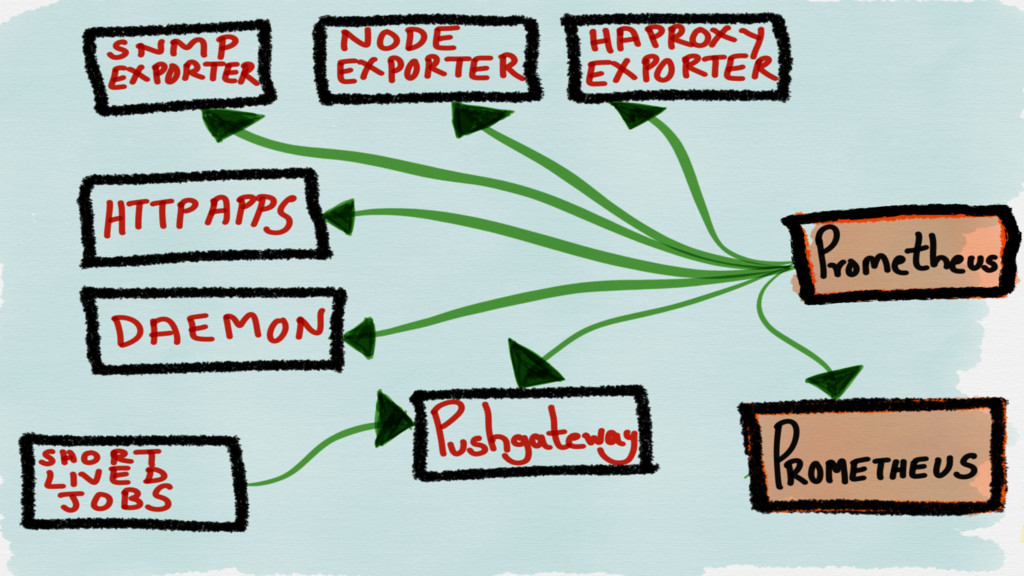
If you want to push, there’s a PUSHGATEWAY for short
lived jobs
EXPORTERS
Exporters help in exporting existing metrics from third-party systems as
Prometheus metrics.
JMX SNMP HAProxy MySQL Blackbox cAdvisor (Node) system metrics
S T O R A G E
Single node, no clustering
For HA, run 2 identical Prometheus servers
None
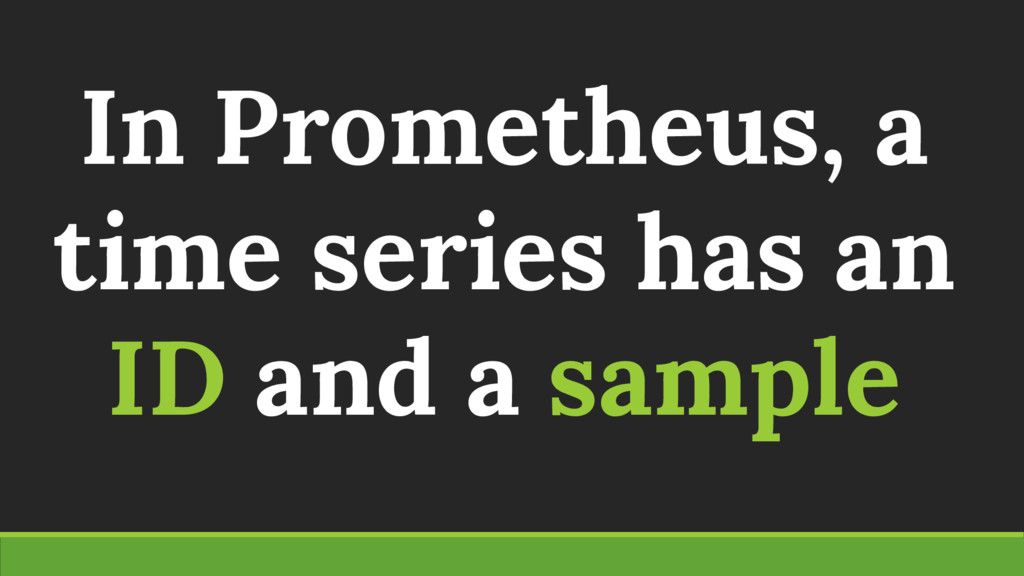
In Prometheus, a time series has an ID and a
sample
None
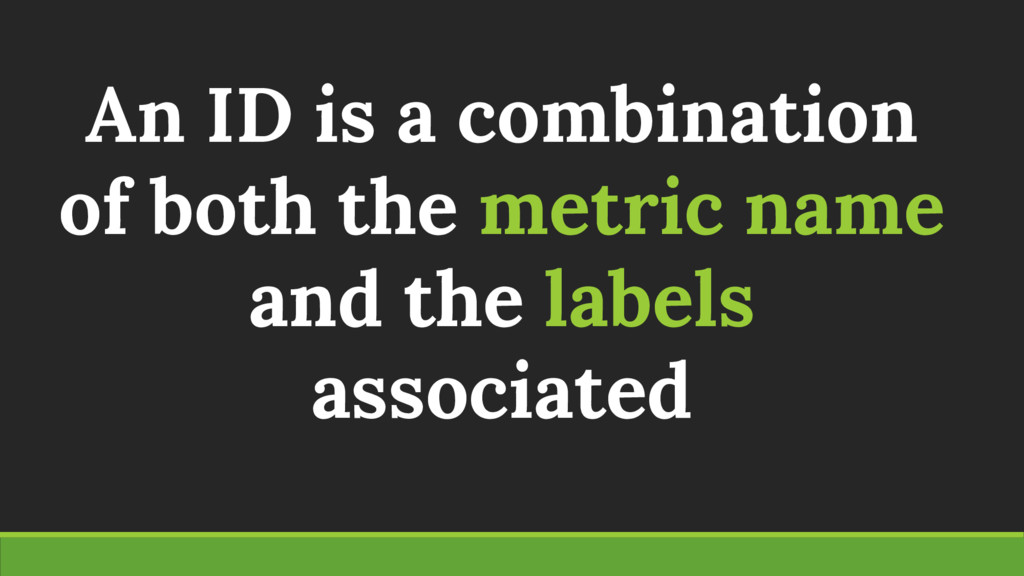
An ID is a combination of both the metric name
and the labels associated
A sample is a combination of a millisecond precision timestamp
and a float64 value
Requirements of *any* TSDB? Effective queries Effective writes
Write optimized Requires parallel queries and aggregation for diverse query
patterns during read time
None
None
None
None
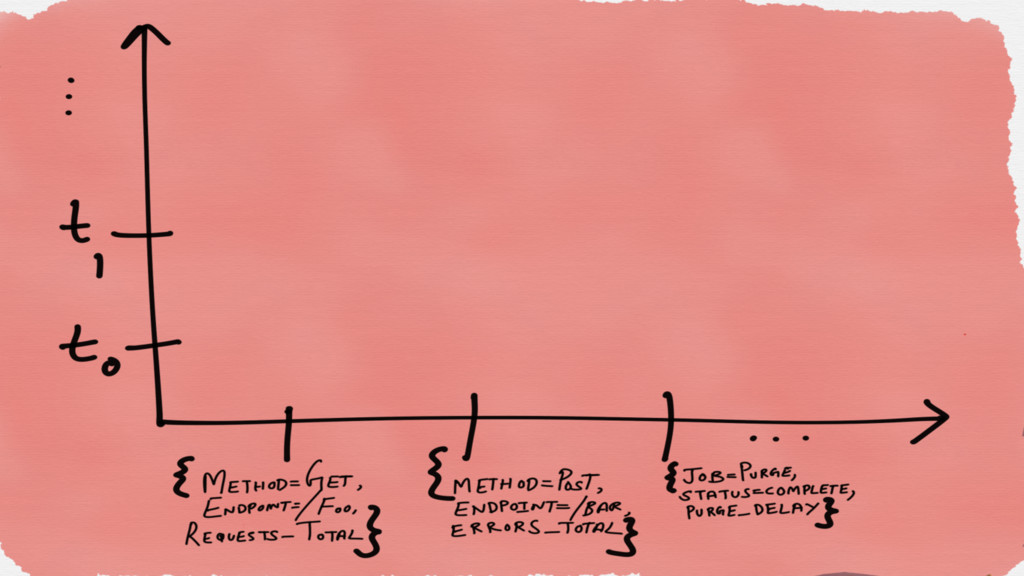
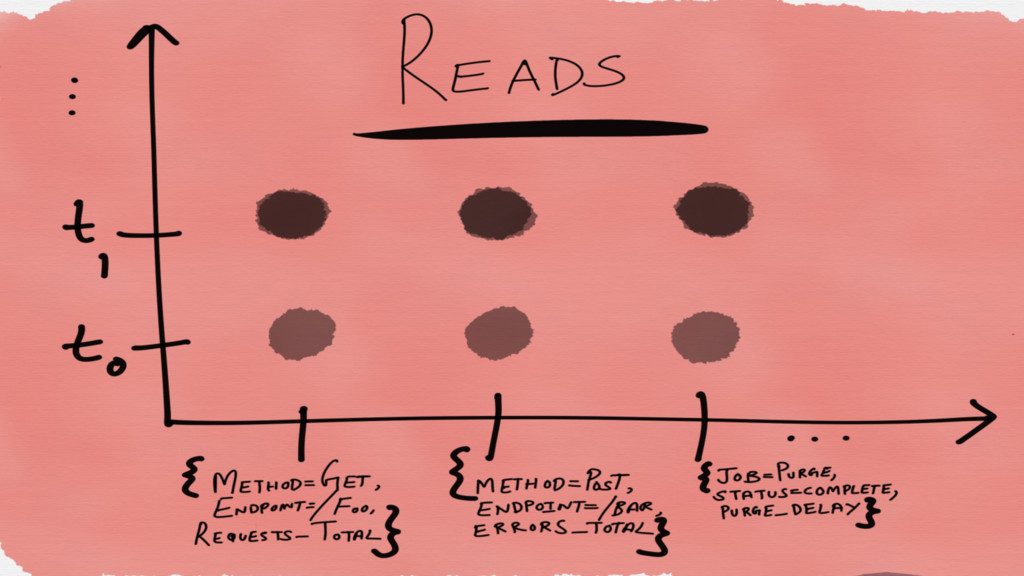
Write pattern is horizontal A TSDB ingests potentially several time
series from every target at specific intervals of time
None
None
None
None
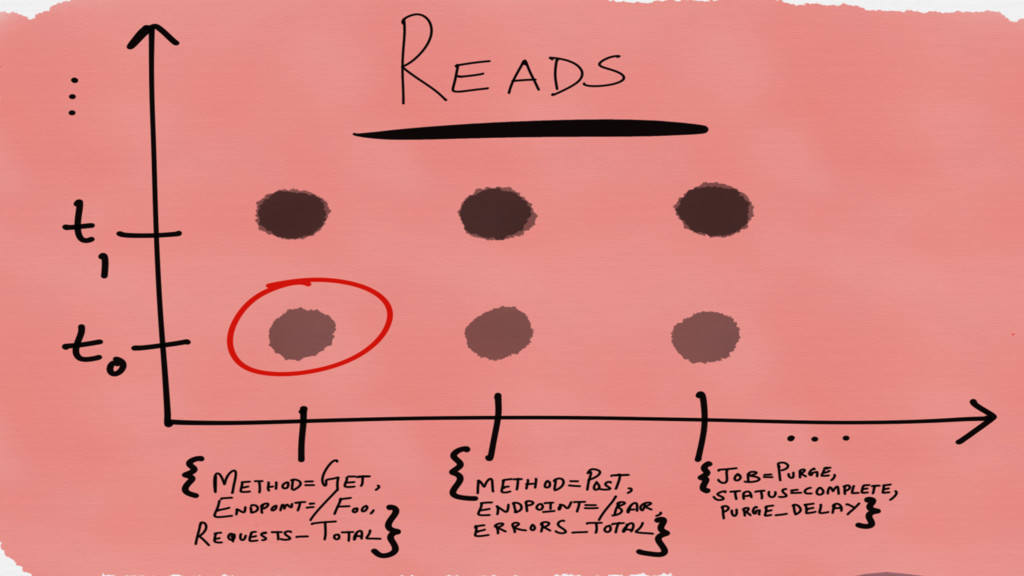
Reads are random We read not entire rows or columns
but sparse matrices
Read optimized Write data in such a way that it
is closely aligned for reads
None
None
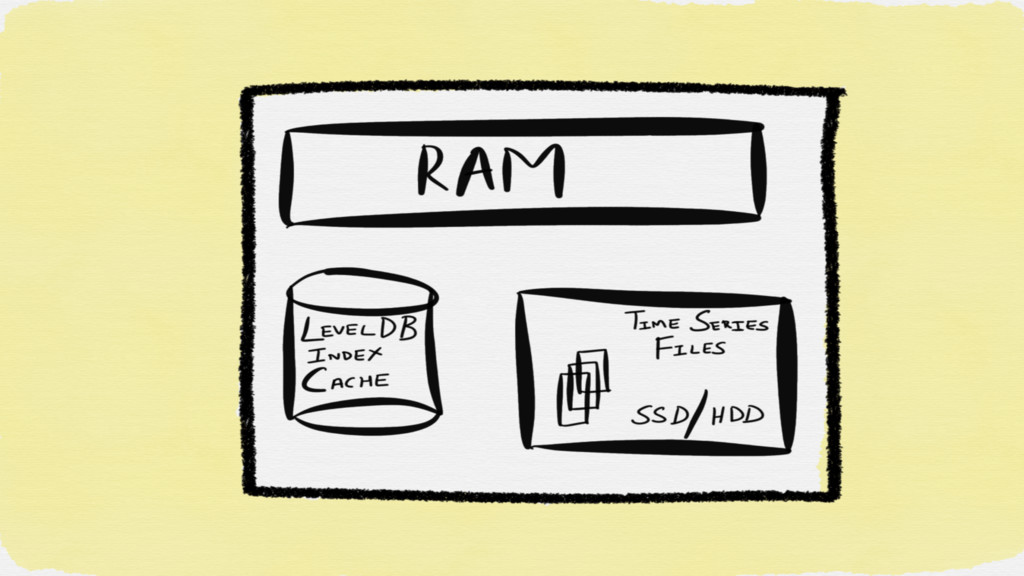
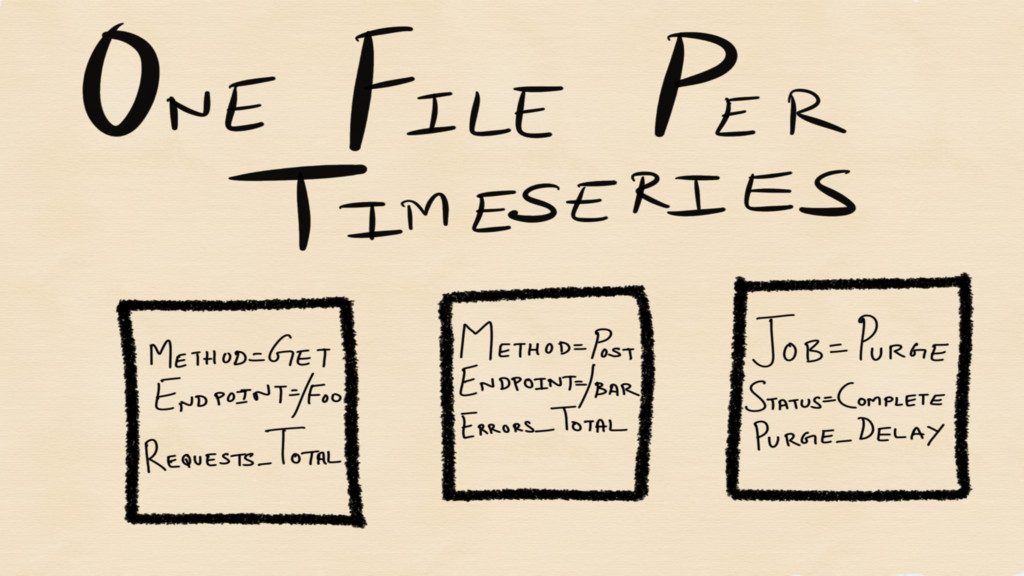
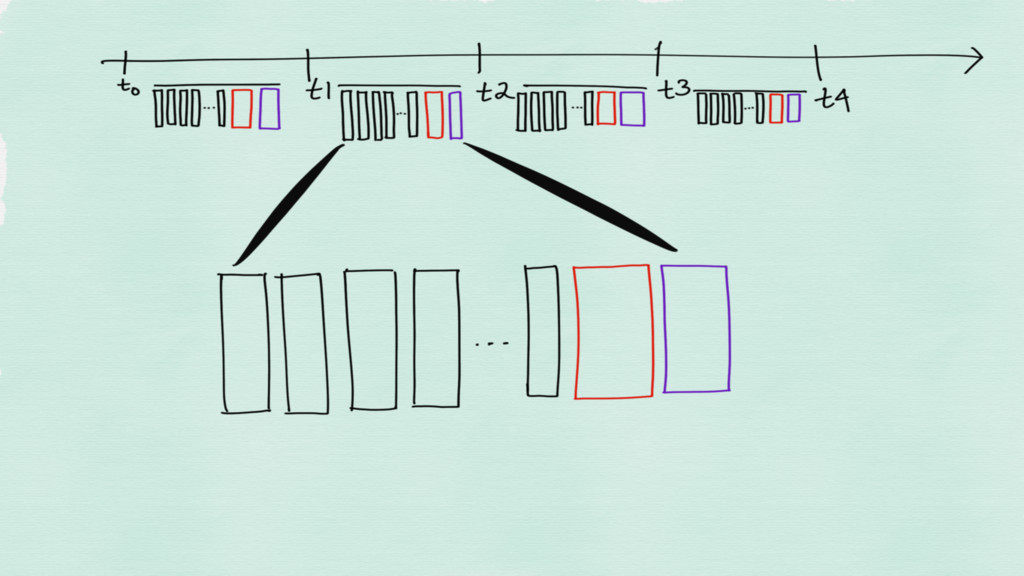
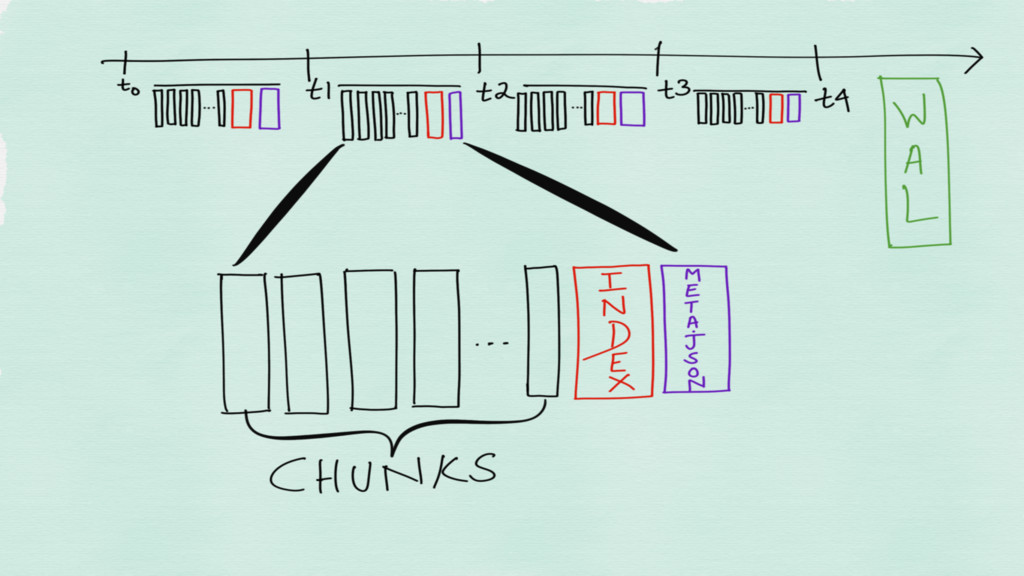
The time series are stored in a one file per
time series format on disk
None
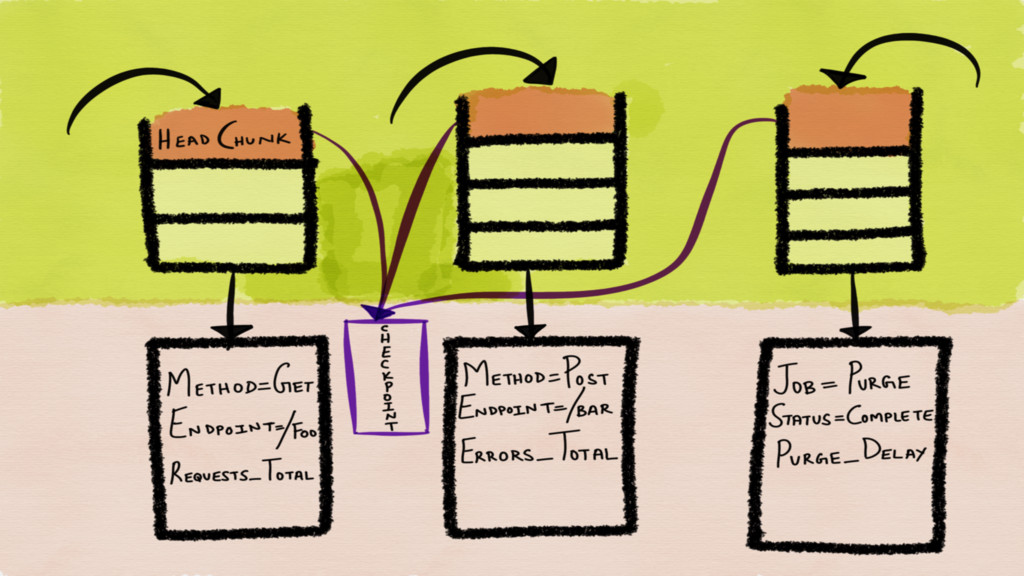
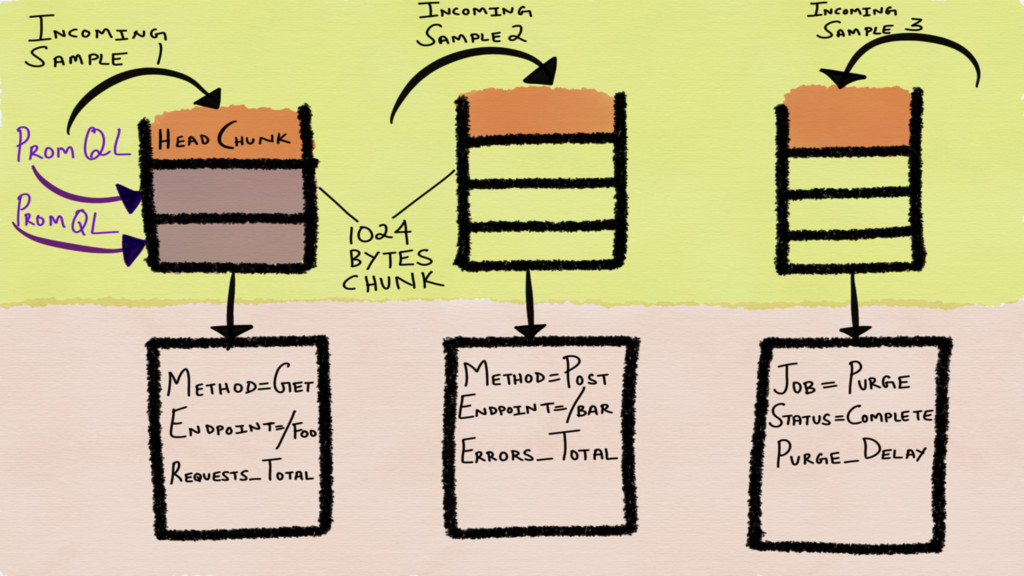
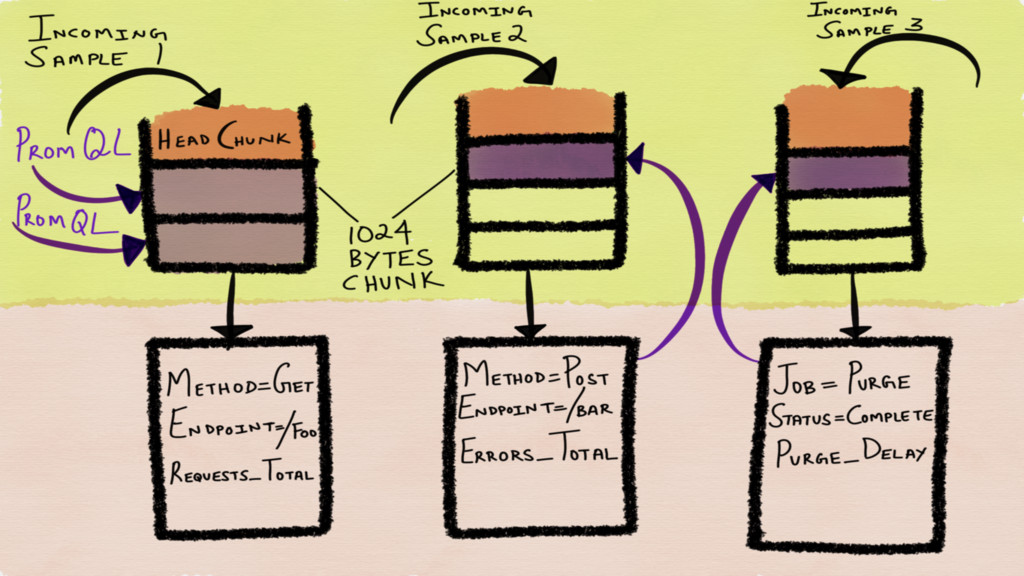
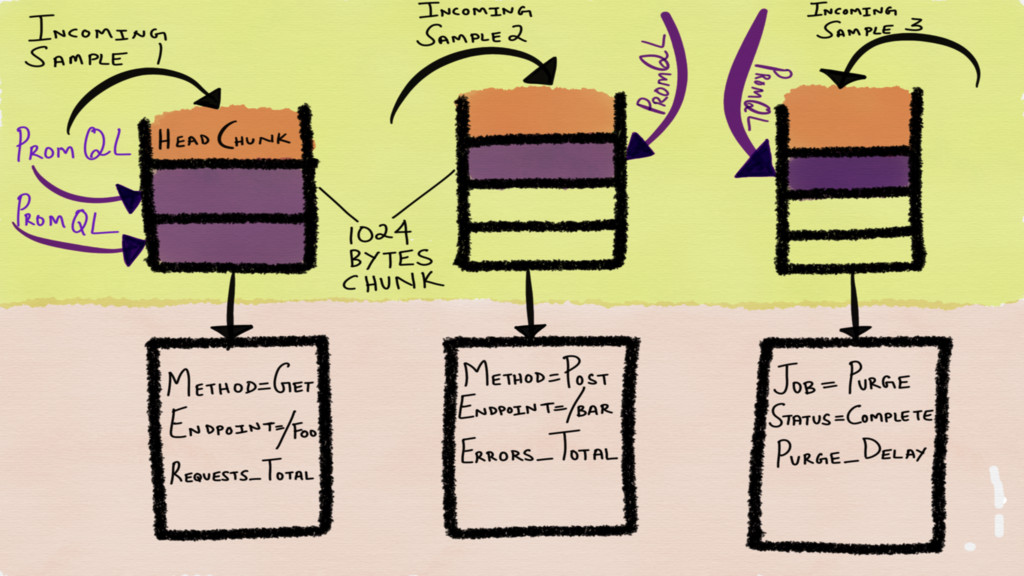
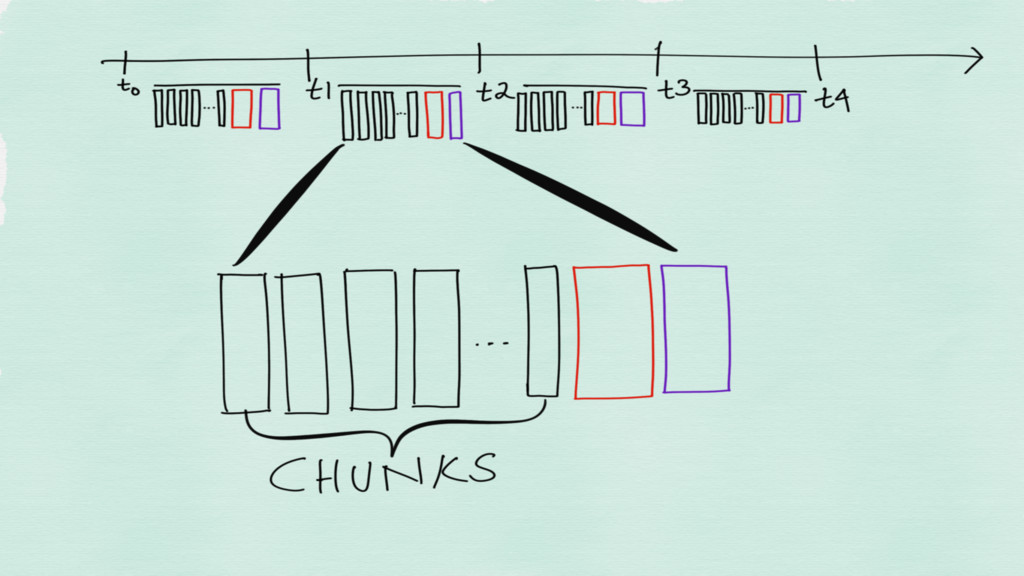
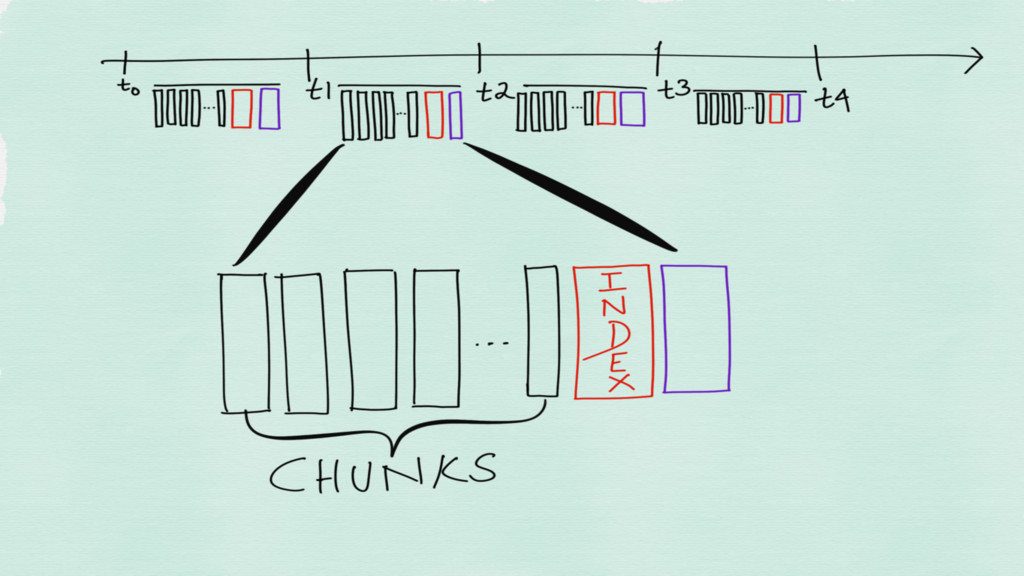
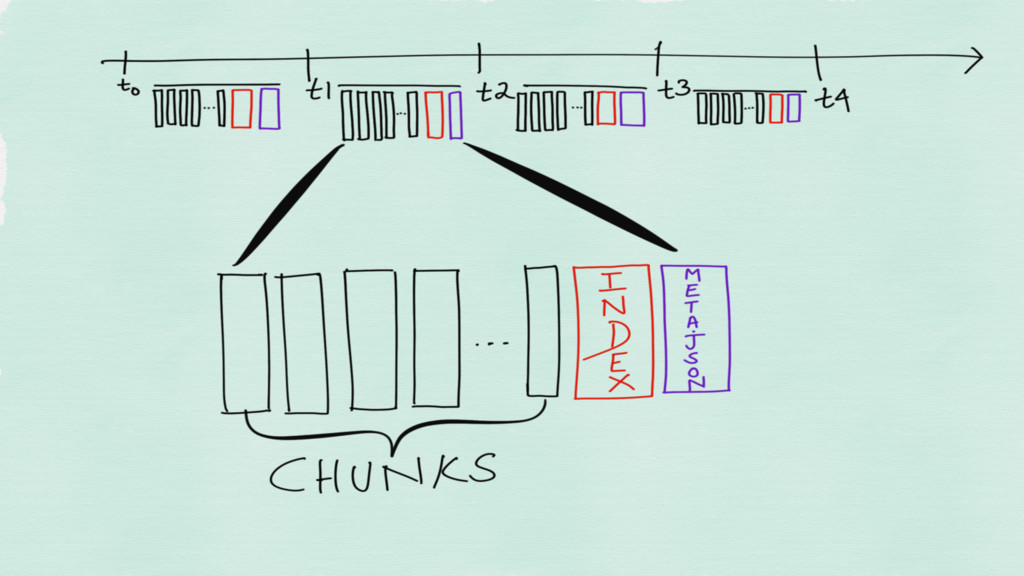
Incoming time series are stored in chunks in memory Chunks
are flushed to disk when they are full
None
Incomplete chunks are checkpointed to disk so as to be
able to recover after a crash
None
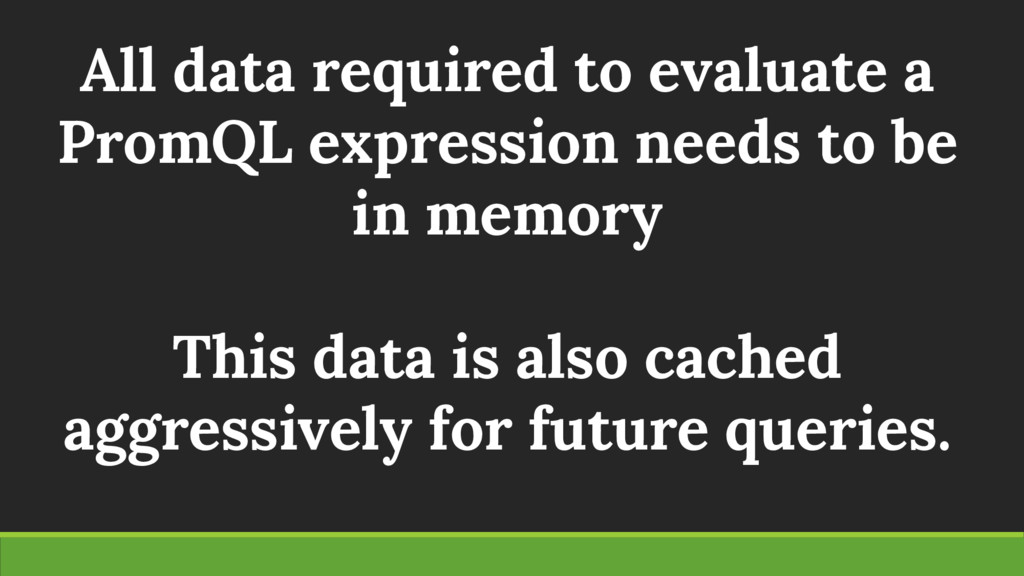
All data required to evaluate a PromQL expression needs to
be in memory This data is also cached aggressively for future queries.
None
None
None
None
Prometheus supports two types of rules which may be configured
and then evaluated at regular intervals - Recording rules and Alerting rules.
Same chunk eviction policy applies while evaluating for Alerting and
Recording Rules
RECORDING RULES Recording rules allow you to precompute frequently needed
or computationally expensive expressions and save their result as a new set of time series
RECORDING RULES Querying the precomputed result will then often be
much faster than executing the original expression every time it is needed
RECORDING RULES Come in handy while creating dashboards where the
same expression is evaluated every time a dashboard is refreshed
ALERTING RULES Allow defining alert conditions based on PromQL expressions
and to send notifications about firing alerts to an external service.
Drawbacks of V2 storage
Single file per time series
High resource utilization because of time-series churn
Checkpointing to disk can be longer than acceptable
Deletion of stale time-series is prohibitively expensive
SQOF a ka Single Query of Failure
None
None
None
None
None
None
None
FEDERATION
Federation allows a Prometheus server to scrape selected time series
from another Prometheus server
None
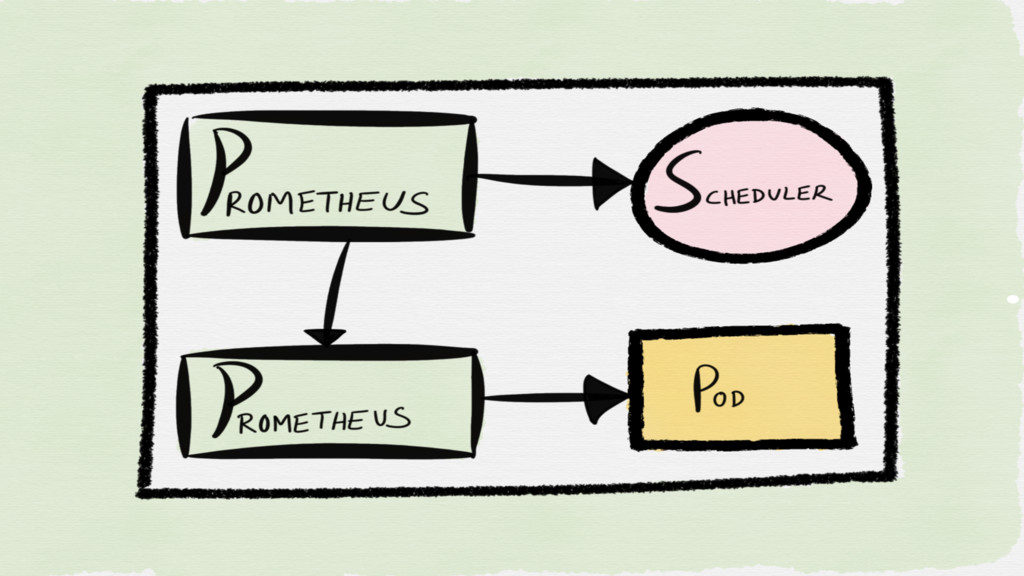
CROSS-SERVICE FEDERATION
A Prometheus server of one service is configured to scrape
selected data from another service's Prometheus server to enable alerting and queries against both datasets within a single server
None
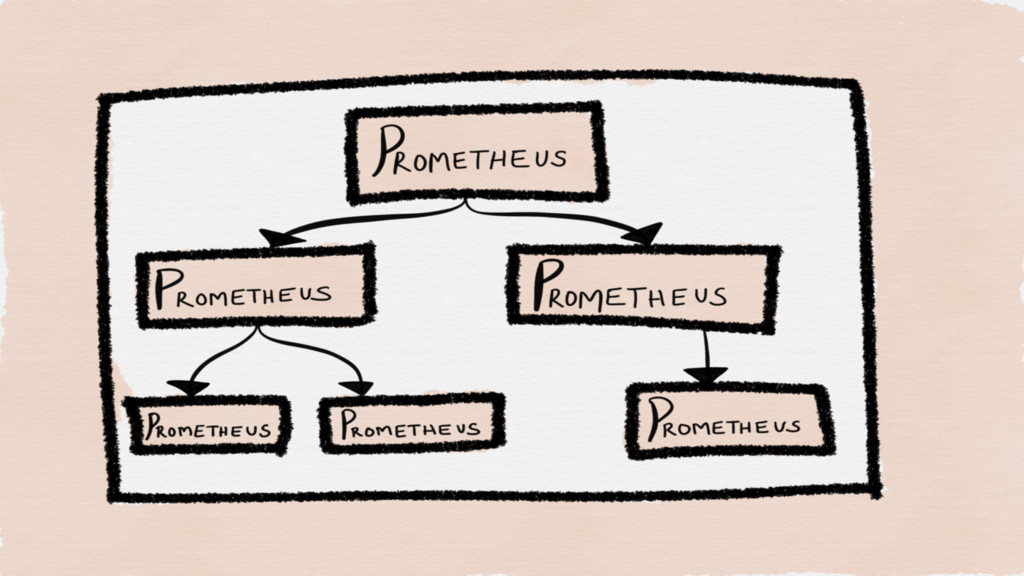
HIERARCHICAL FEDERATION
The federation topology resembles a tree, with higher level Prometheus
servers collecting aggregated time series data from a larger number of subordinated servers
None
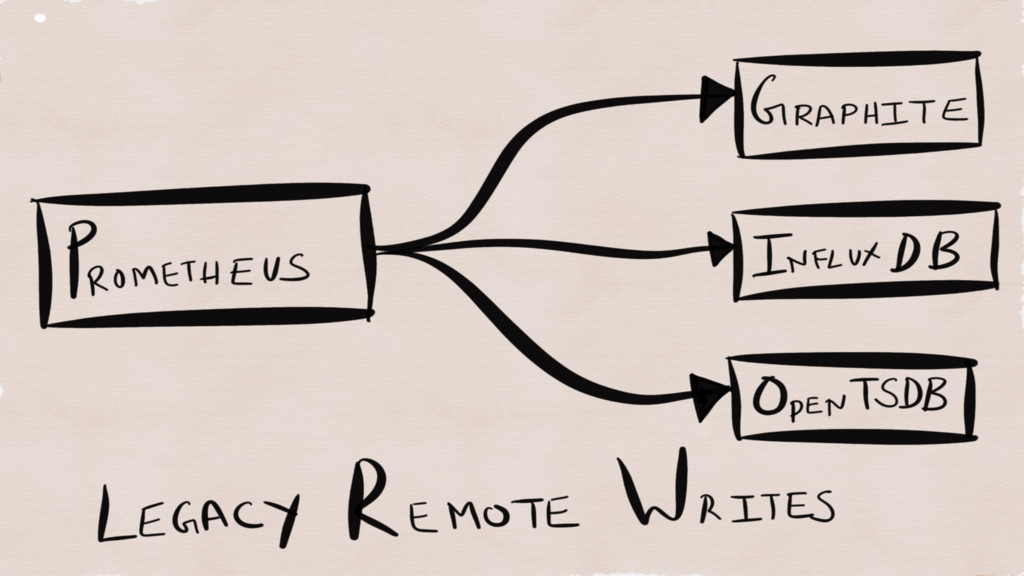
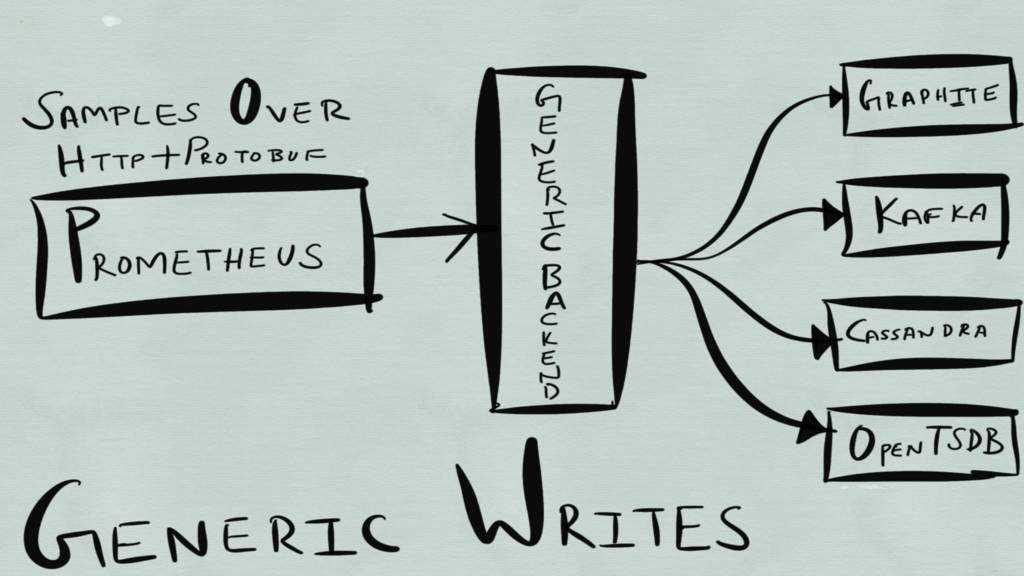
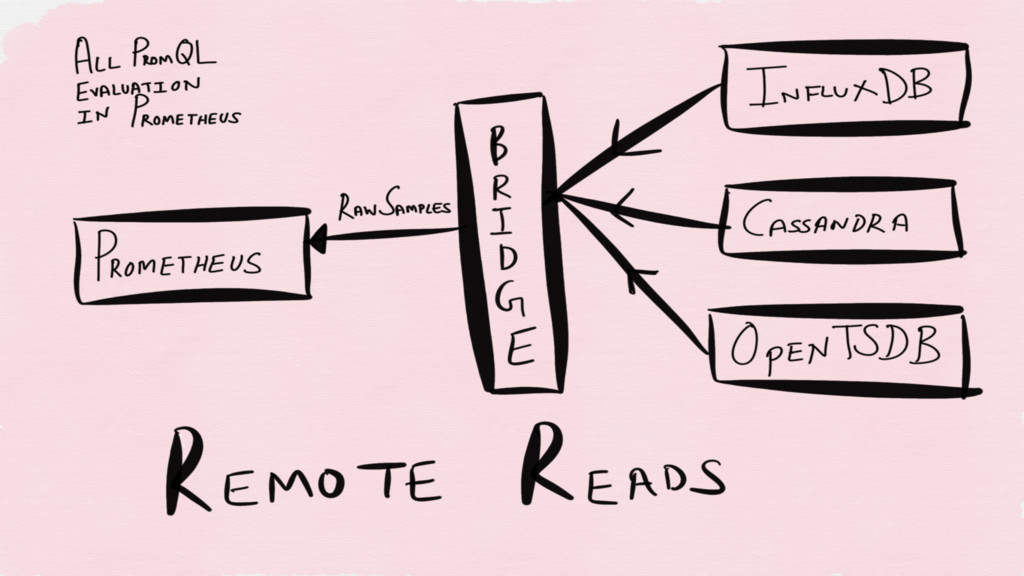
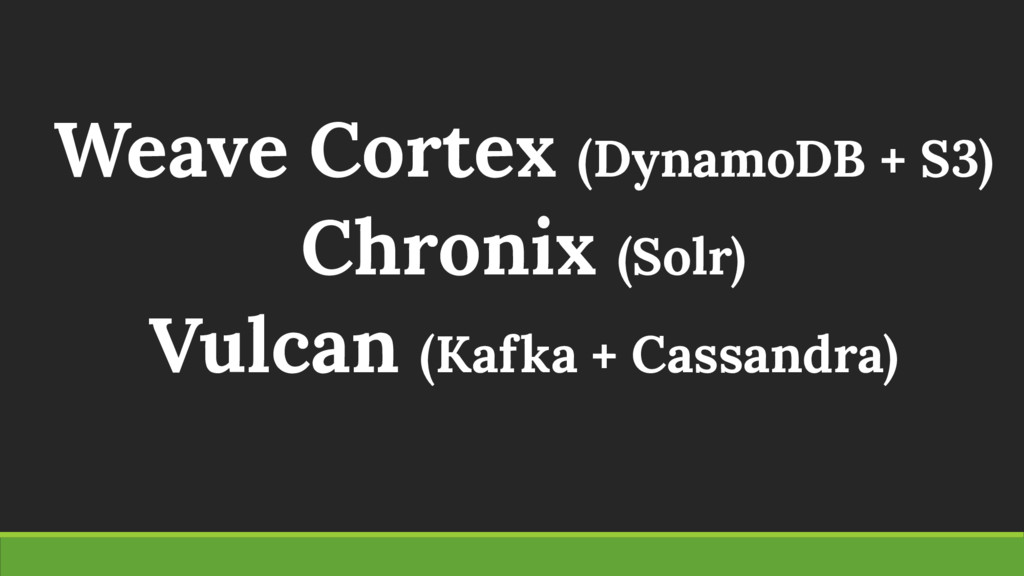
REMOTE STORAGE
None
None
None
Weave Cortex (DynamoDB + S3) Chronix (Solr) Vulcan (Kafka +
Cassandra)
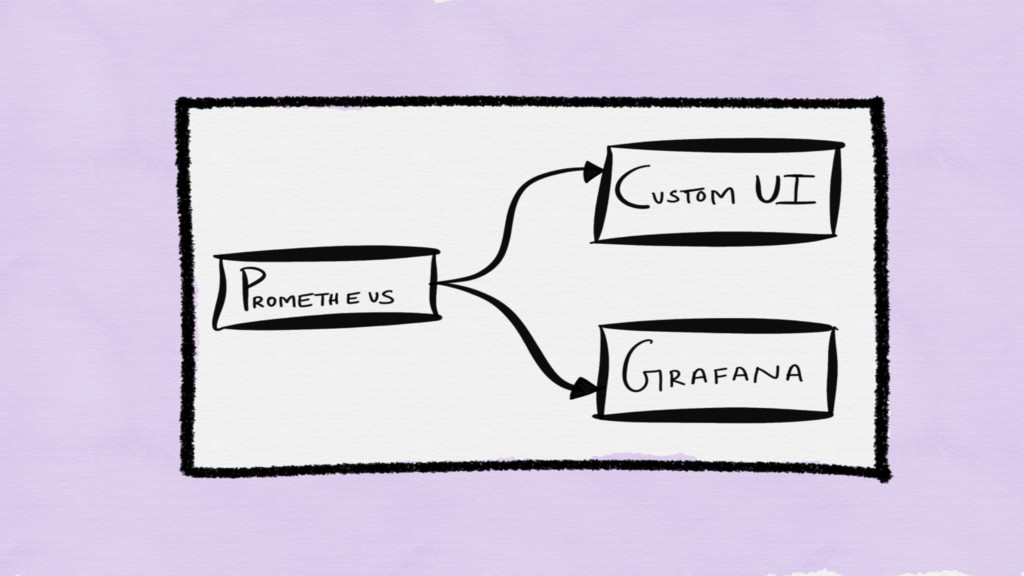
VISUALIZATION
None
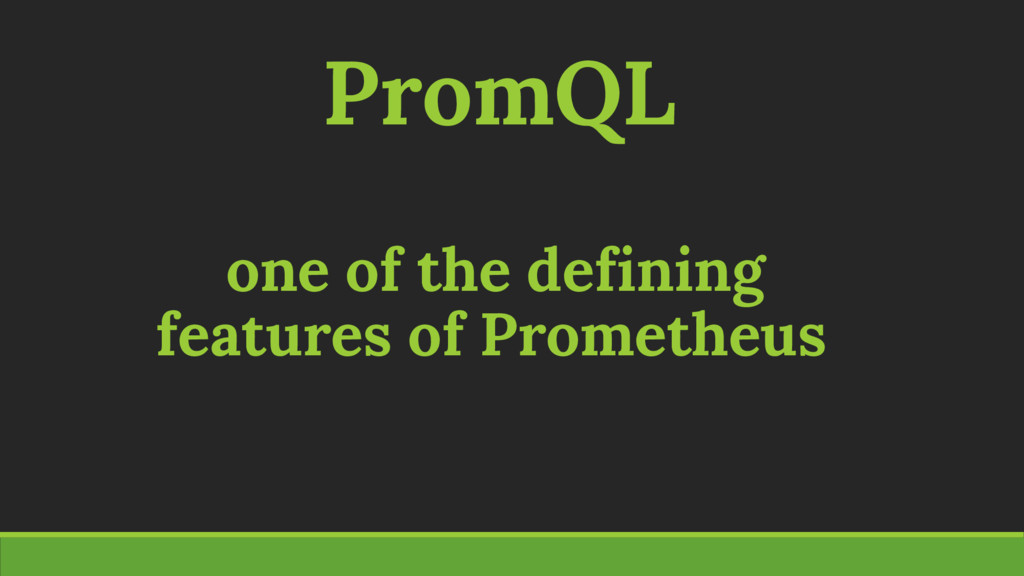
ANALYSIS
PromQL one of the defining features of Prometheus
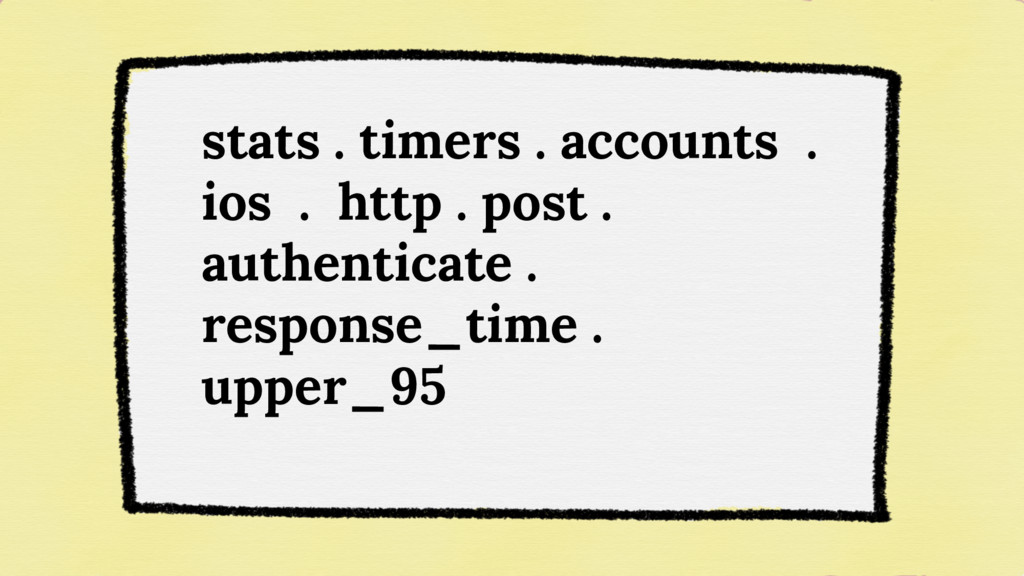
Labels > Hierarchy
stats . timers . accounts . ios . http .
post . authenticate . response_time . upper_95
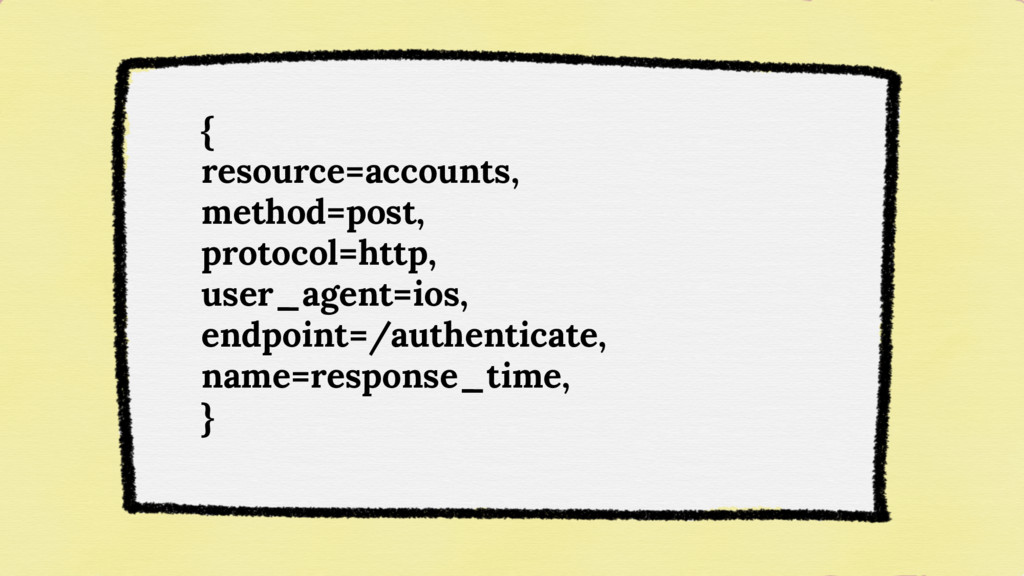
{ resource=accounts, method=post, protocol=http, user_agent=ios, endpoint=/authenticate, name=response_time, }
Better exploration because of dimensional queries
PromQL rate(api_http_requests_total [5m] ) SQL SELECT job, instance, method, status,
path, rate(value, 5m) FROM api_http_requests_total
ALERTING
No automatic anomaly detection
ALERT <alert name> IF <expression> [ FOR <duration> ] [
LABELS <label set> ] [ ANNOTATIONS <label set> ]
None
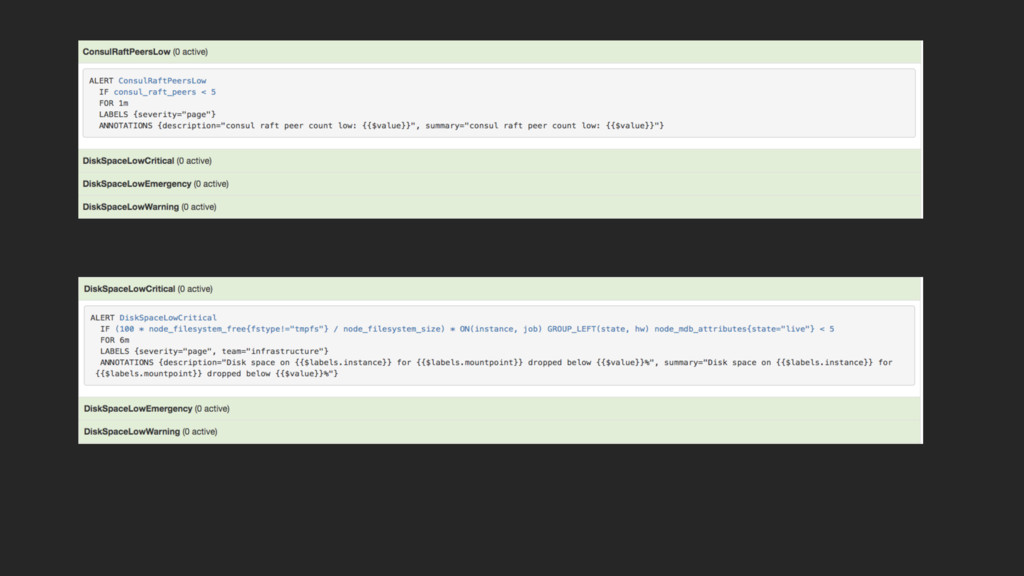
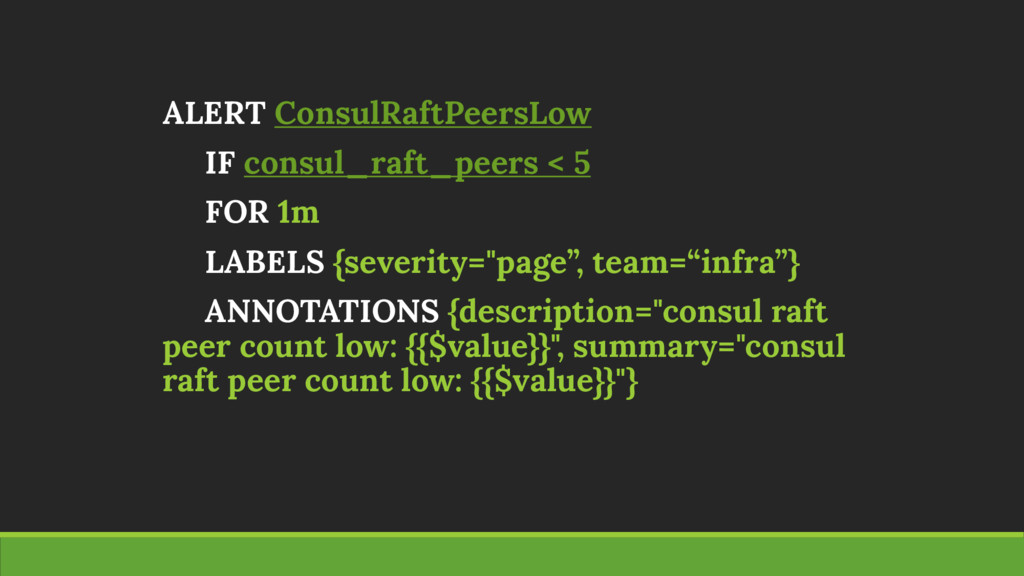
ALERT ConsulRaftPeersLow IF consul_raft_peers < 5 FOR 1m LABELS {severity="page”,
team=“infra”} ANNOTATIONS {description="consul raft peer count low: {{$value}}", summary="consul raft peer count low: {{$value}}"}
ALERT QueueCritical IF sum (broker_q{svc_pref="prod"}) > 5000 FOR 10m LABELS
{severity="page", team=”product"} ANNOTATIONS {description="service: {{$labels.service}} instance: {{$labels.instance}} queue length: {{$value}} for too long", summary="service: {{$labels.service}} instance: {{$labels.instance}} queue length: {{$value}} for too long"}
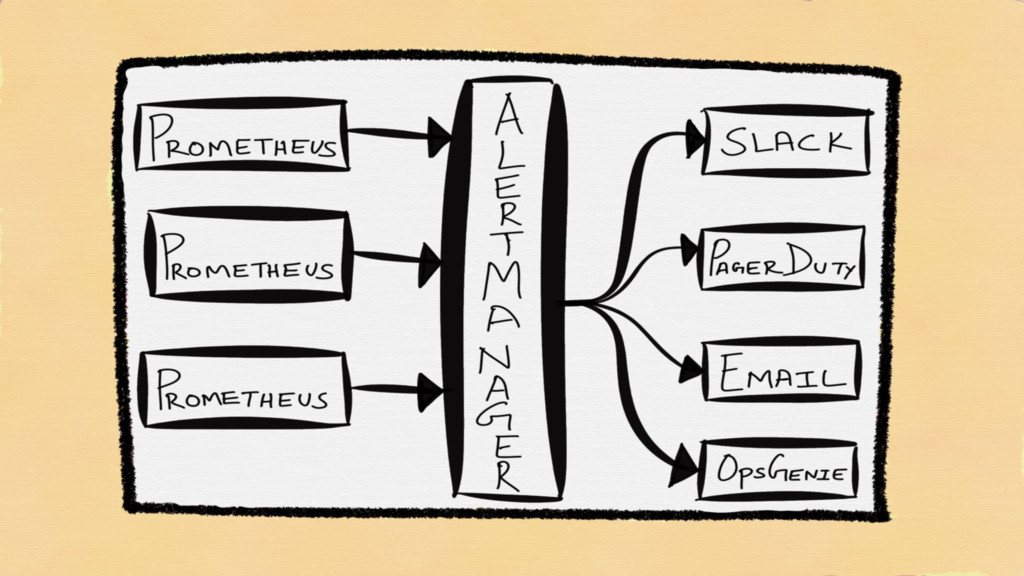
ALERTMANAGER
Deduplication Grouping Routing Suppression of Alerts
None
CASE STUDY
None
None
None
24 employees 8 engineers
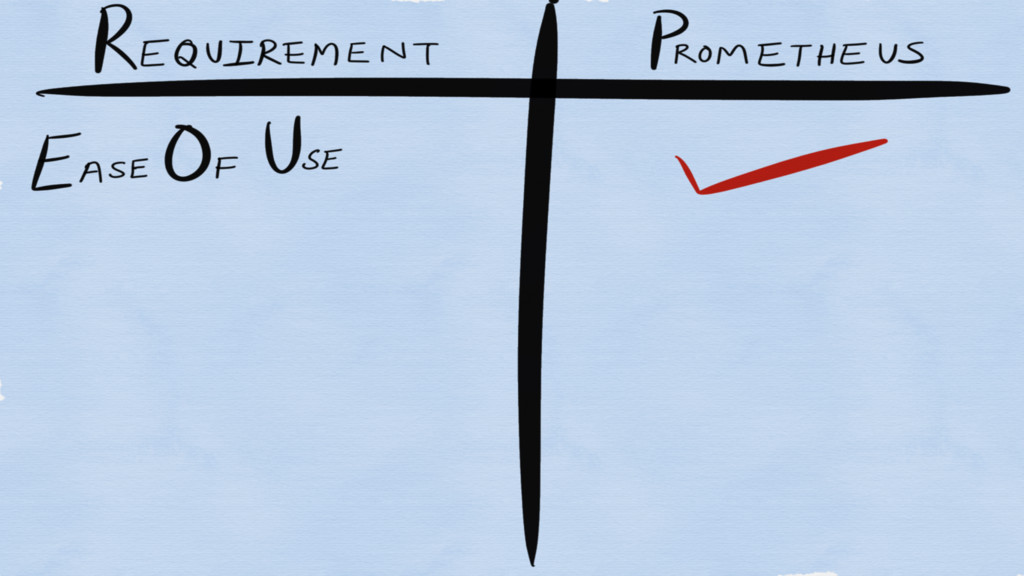
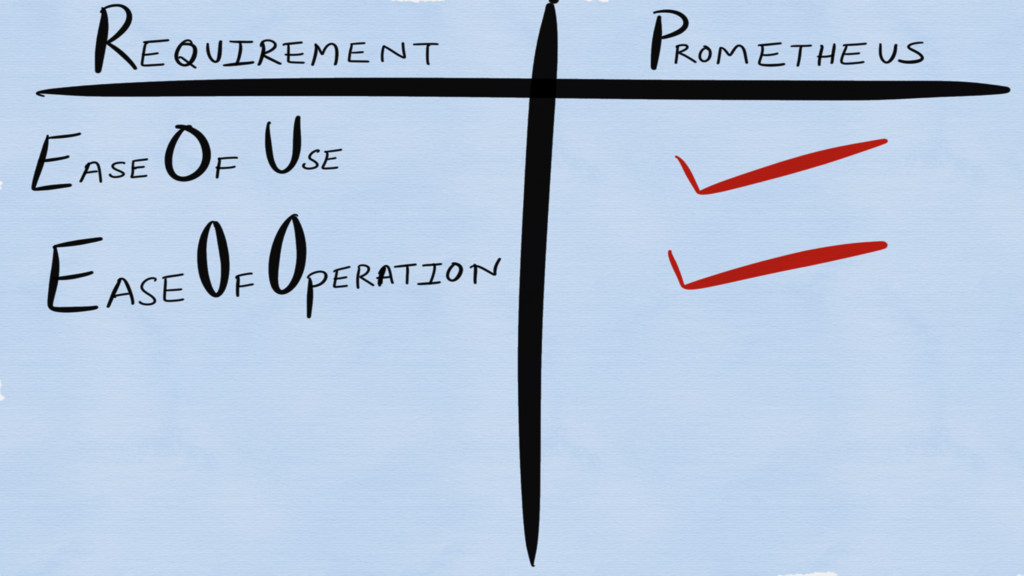
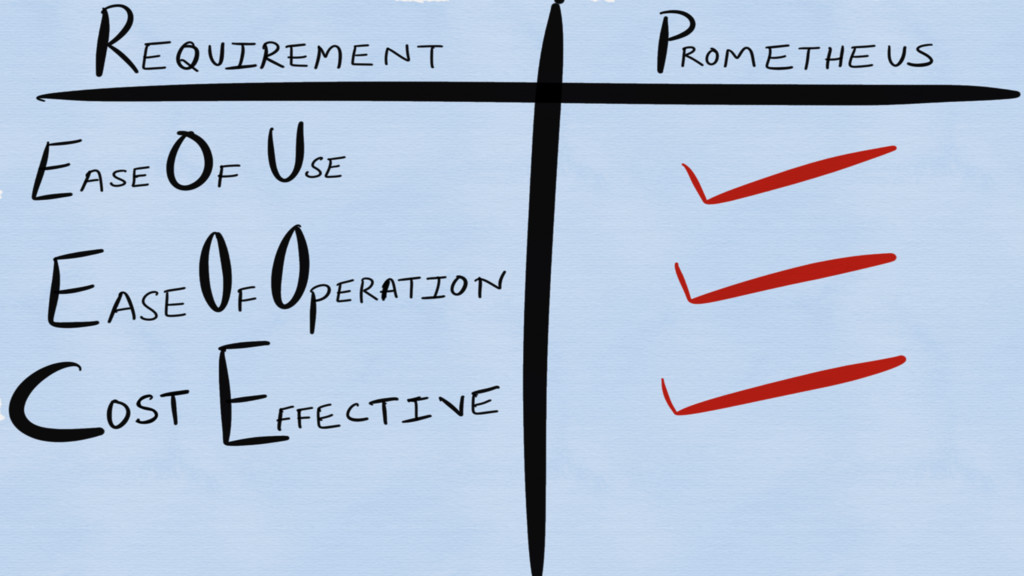
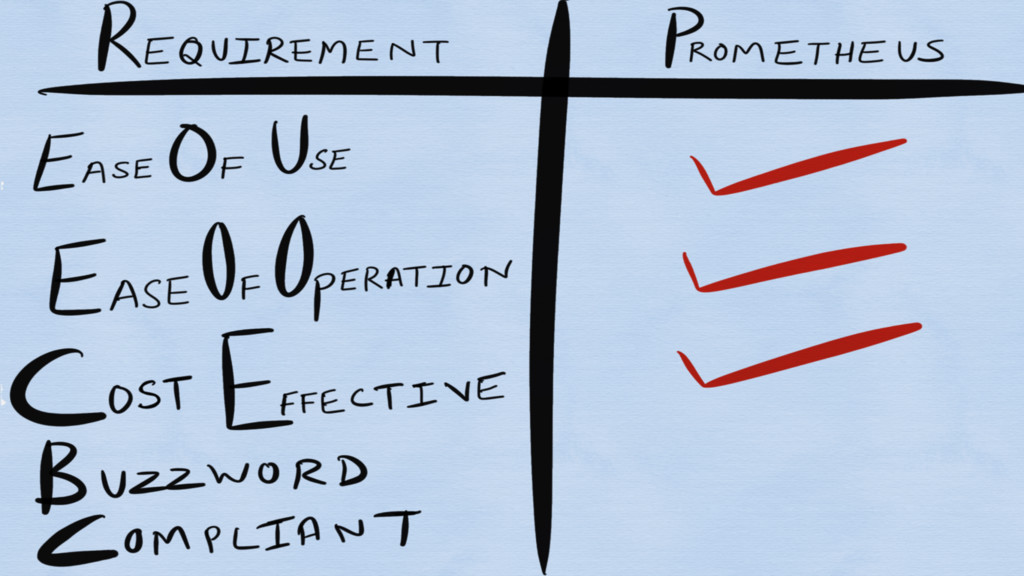
Requirements for a monitoring system?
Ease of Use
Ease of Operation
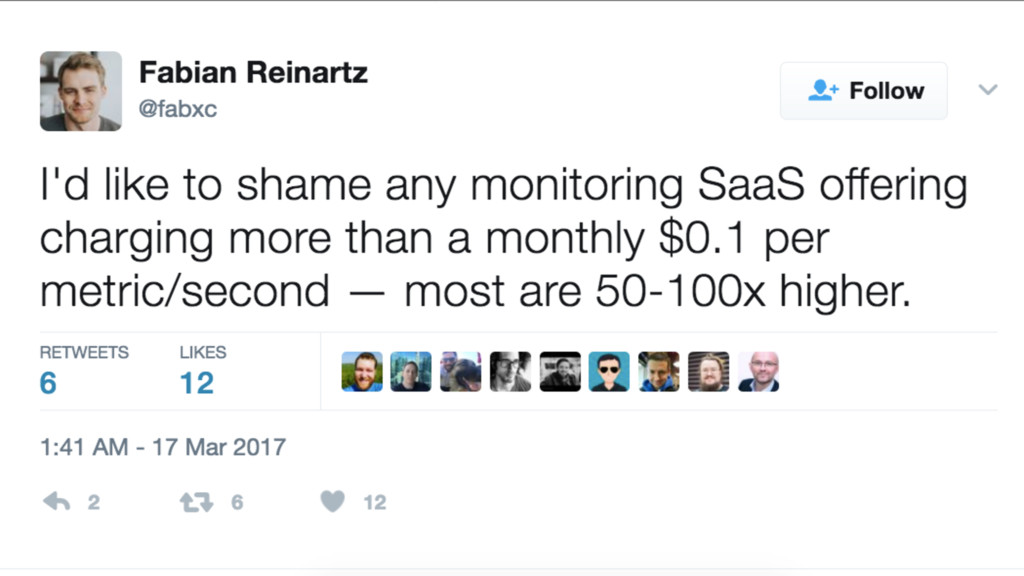
Cost Effective!
None
None
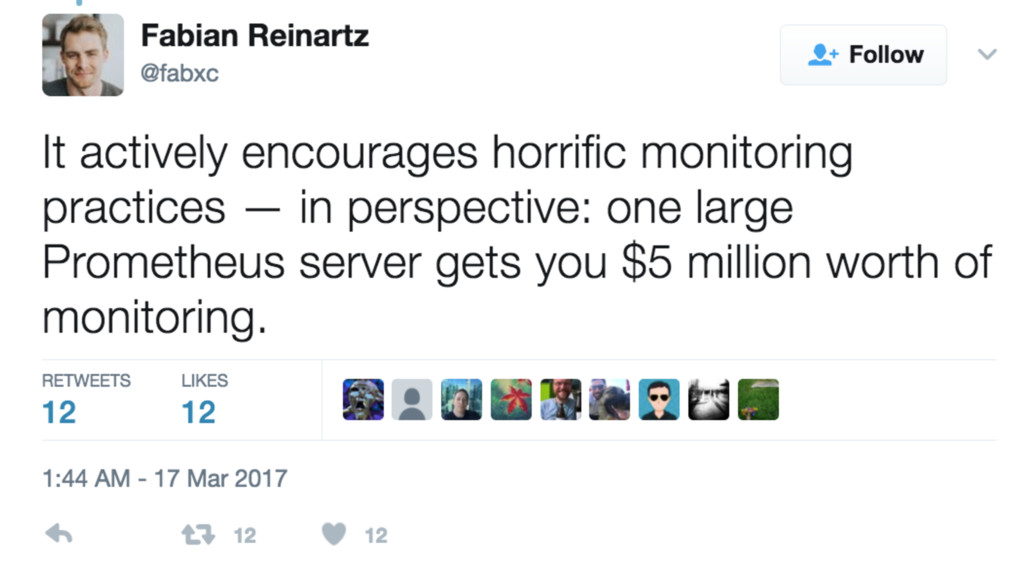
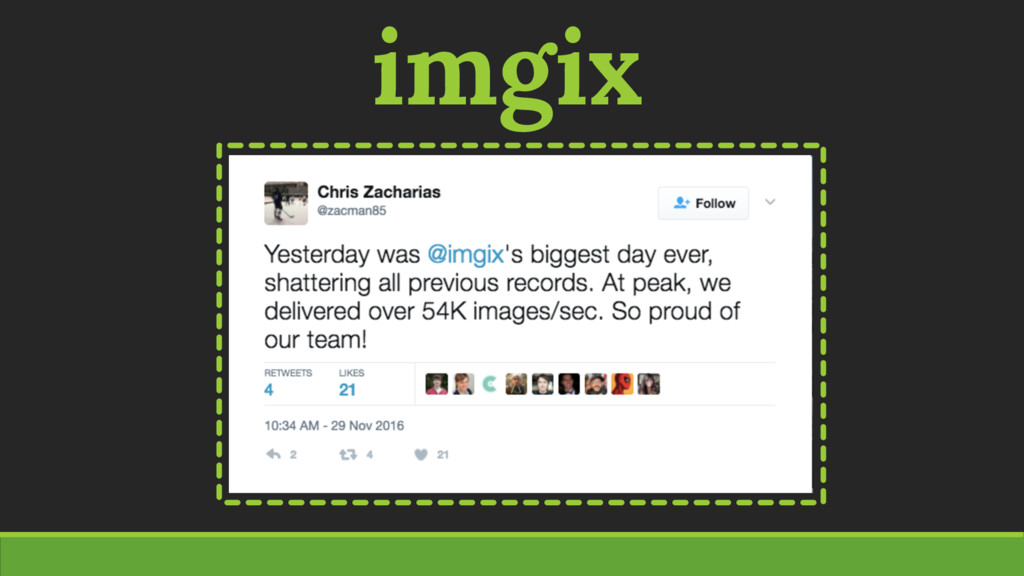
Cost Effective “at scale”
Scale?
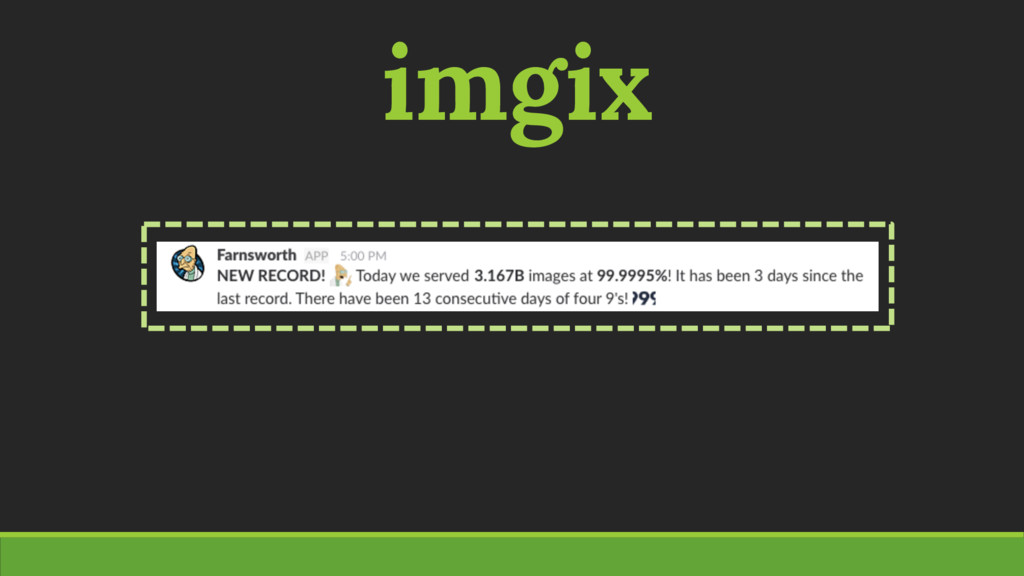
imgix
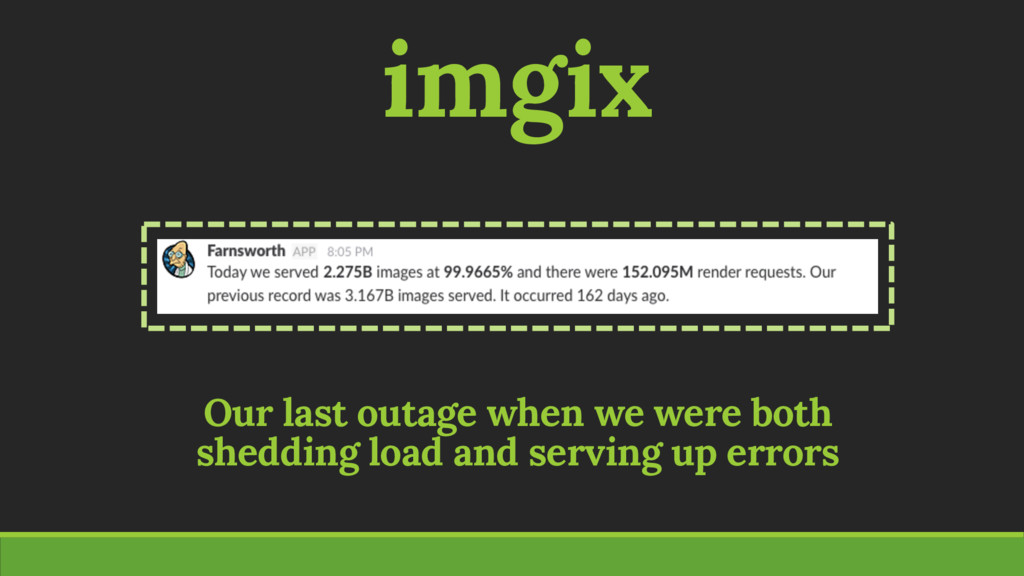
imgix
imgix Our last outage when we were both shedding load
and serving up errors
None
CONCLUSION
None
None
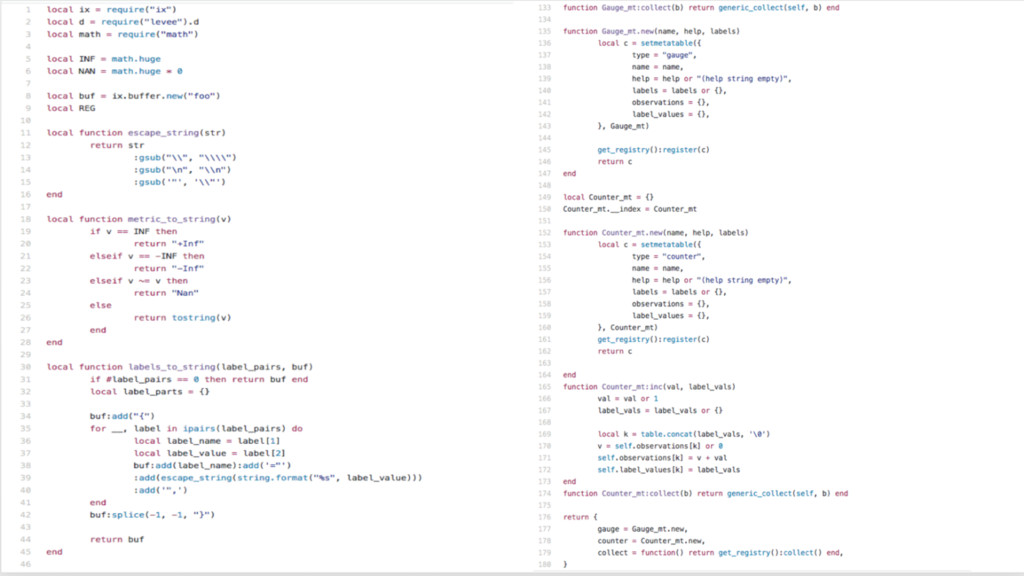
Our stack is C, Lua, Go, Python
Fantastic official Go and Python clients
Custom LuaJIT client for counters, gauges and histograms
None
None
Single statically linked Go binary
No clustering No dependency on Zookeeper et al.
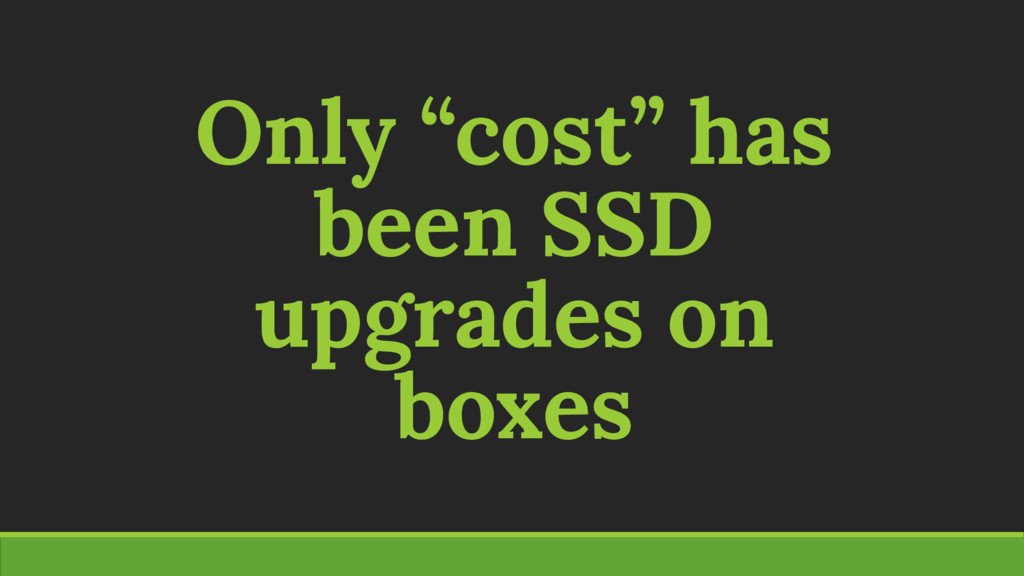
~2 years of Prometheus use in production
None
Only “cost” has been SSD upgrades on boxes
None
Let’s not answer that last question!
Thank You! @copyconstruct
![PromQL rate(api_http_requests_total [5m] ) SQL SELECT job, instance, method, status,](https://files.speakerdeck.com/presentations/23aa1f09daf9428ab8c2852f90ba3257/slide_148.jpg)
![ALERT <alert name> IF <expression> [ FOR <duration> ] [](https://files.speakerdeck.com/presentations/23aa1f09daf9428ab8c2852f90ba3257/slide_151.jpg)