Upgrade to Pro — share decks privately, control downloads, hide ads and more …

Monitoring in the time of Cloud Native

Monitoring in the time of Cloud Native

Cindy Sridharan

October 04, 2017
Tweet

More Decks by Cindy Sridharan

Other Decks in Technology

Transcript

  1. It’s tempting, especially when enamored by a new piece of

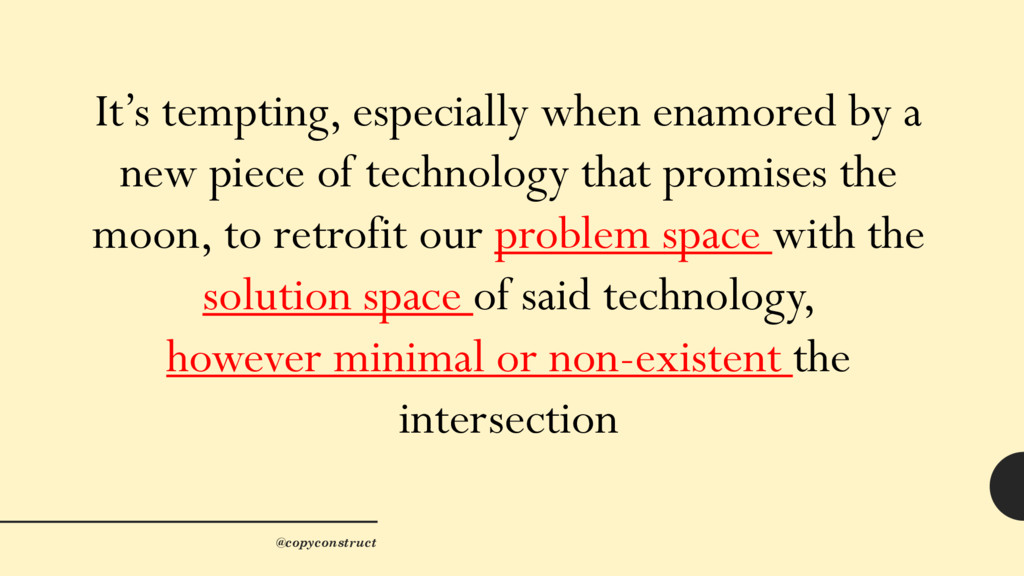
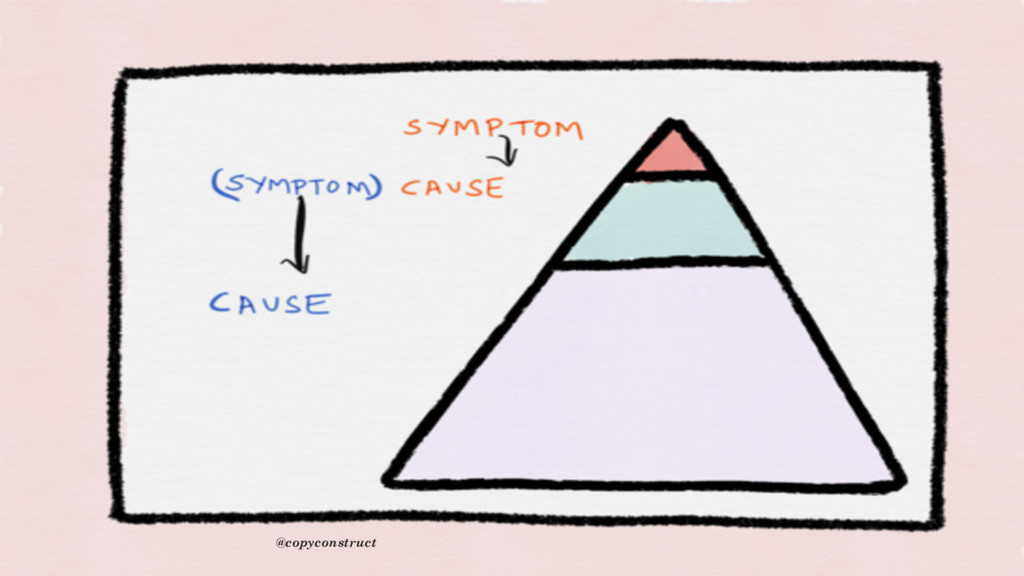
    technology that promises the moon, to retrofit our problem space with the solution space of said technology, however minimal or non-existent the intersection @copyconstruct
  2. o strengths and weaknesses of each category of tools o

    problems they solve o tradeoffs they make o ease of adoption/integration into an existing infrastructure @copyconstruct
  3. As we adopt increasingly complex architectures, the number of “things

    that can go wrong” exponentially increases @copyconstruct
  4. how do we design monitoring for such systems? how do

    we design these systems themselves? @copyconstruct
  5. The goal of “monitoring” hasn’t changed, even if the scope

    has shrunk the challenge now lies in identifying and minimizing the bits of “monitoring” that still remain human centric @copyconstruct
  6. Observability is about being able to understand how a system

    is behaving in production @copyconstruct
  7. Monitoring is being on the lookout for failures, which in

    turn requires us to be able to predict these failures proactively @copyconstruct
  8. Data are simply facts or figures — bits of information, but not

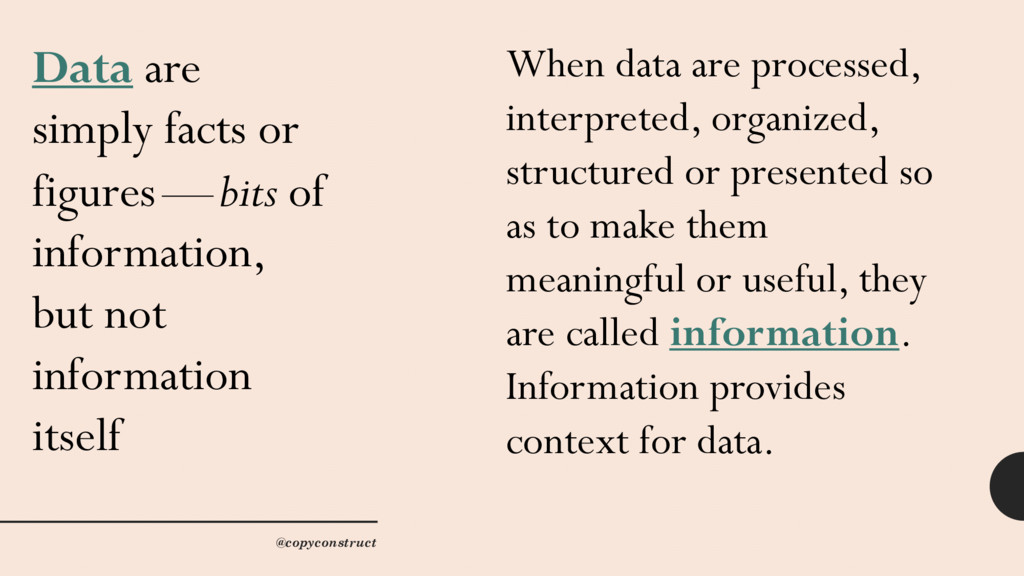
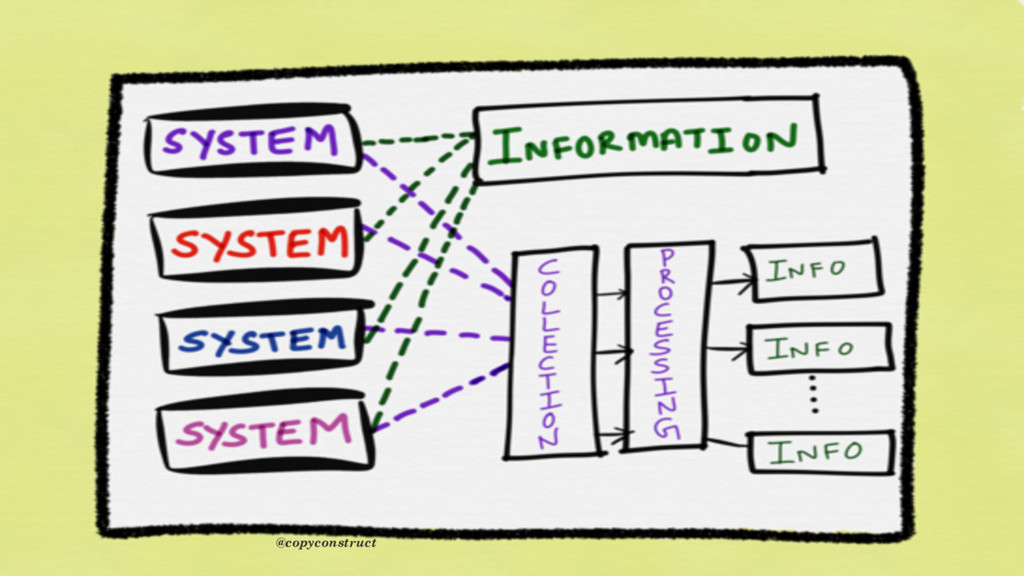
    information itself When data are processed, interpreted, organized, structured or presented so as to make them meaningful or useful, they are called information. Information provides context for data. @copyconstruct
  9. both traces and metrics are an abstraction built on top

    of logs that pre-process and encode information along two orthogonal axes, one being request centric, the other being system centric @copyconstruct
  10. Instrument specific points in your application, proxy, framework, library, middleware

    and anything else that might lie in the path of execution of a request @copyconstruct
  11. “a set of numbers that give information about a particular

    process or activity” @copyconstruct
  12. “a list of numbers relating to a particular activity, which

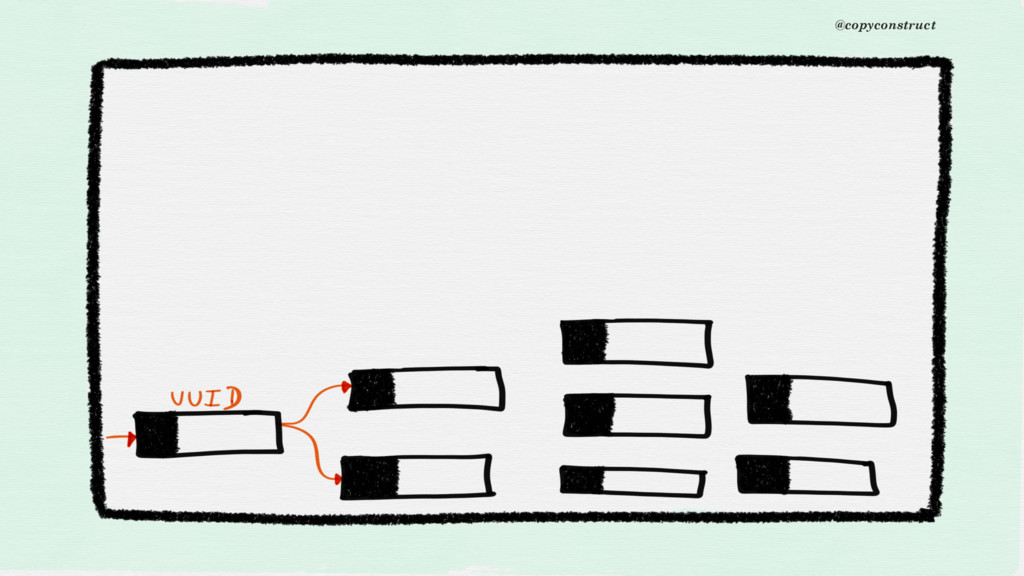
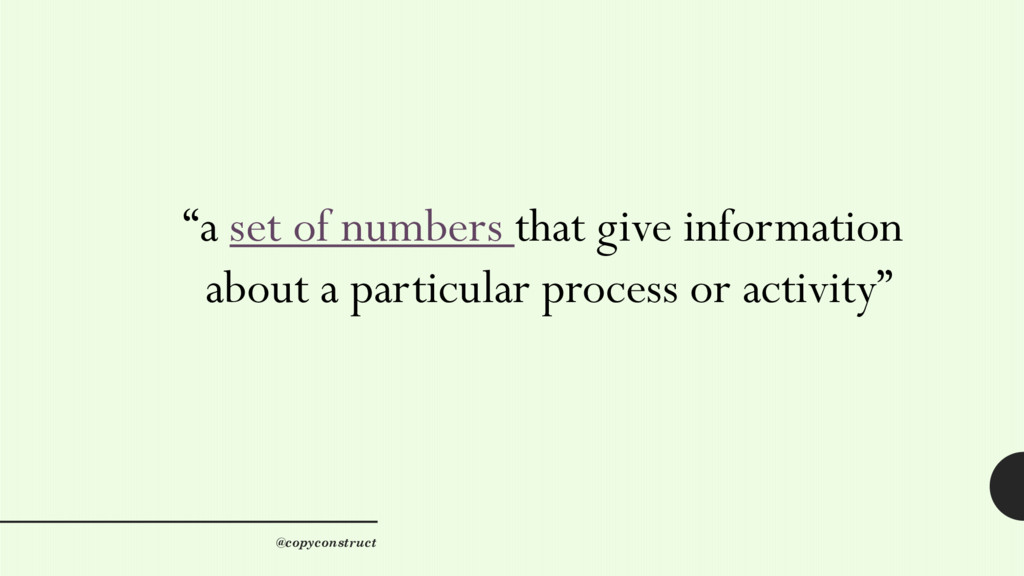
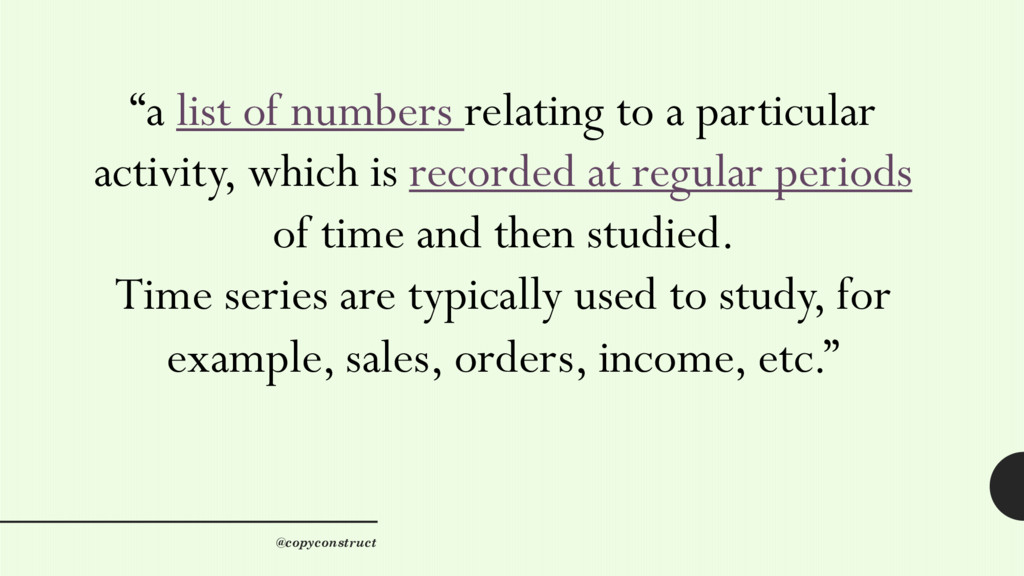
    is recorded at regular periods of time and then studied. Time series are typically used to study, for example, sales, orders, income, etc.” @copyconstruct
  13. +1 easy to instrument and generate +1 provides rich local

    context -1 performance of logging libraries @copyconstruct
  14. +1 easy to instrument and generate +1 provides rich local

    context -1 performance of logging libraries -1 no guaranteed delivery @copyconstruct
  15. +1 easy to instrument and generate +1 provides rich local

    context -1 performance of logging libraries -1 no guaranteed delivery -1 application performance @copyconstruct
  16. “A fun thing I had seen while at [redacted] was

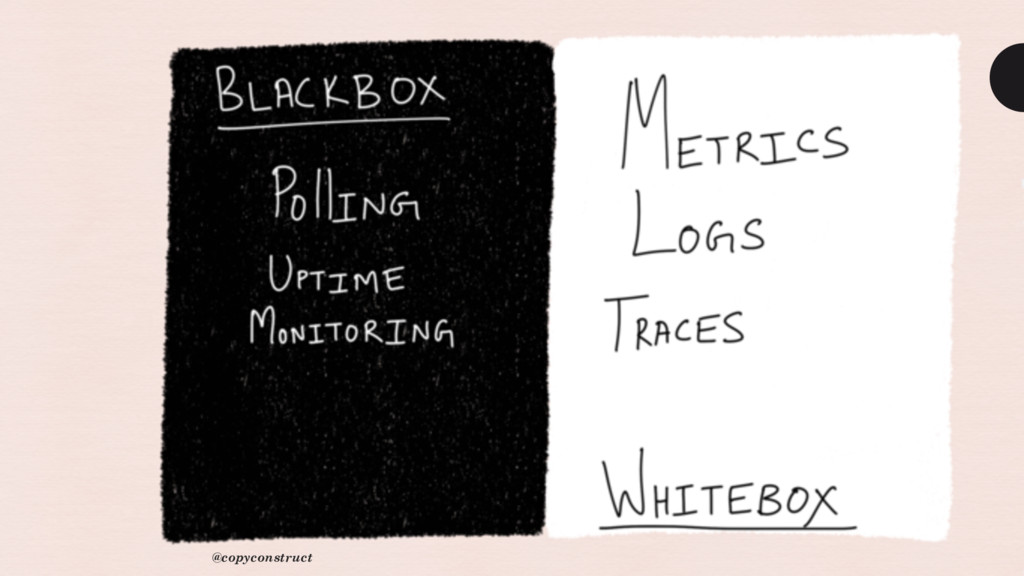
    that turning off most logging almost doubled performance on the instances we were running on because logs ate through AWS’ EC2 classic’s packet allocations like mad. It was interesting for us to discover that more than 50% of our performance would be lost to trying to control and monitor performance” @copyconstruct
  17. +1 easy to instrument and generate +1 provides rich local

    context -1 performance of logging libraries -1 no guaranteed delivery -1 application performance -1 no dynamic sampling @copyconstruct
  18. -1 buffering might be required -1 quotas/ rate limits -1

    “actionable data” @copyconstruct
  19. -1 buffering might be required -1 quotas/ rate limits -1

    “actionable data” -1 ELK @copyconstruct
  20. -1 buffering might be required -1 quotas/ rate limits -1

    “actionable data” -1 ELK -1 $$$$ @copyconstruct
  21. +1 metrics transfer and storage has a constant overhead +1

    cheap +1 statistical & probabilistic analysis @copyconstruct
  22. +1 metrics transfer and storage has a constant overhead +1

    cheap +1 statistical & probabilistic analysis +1 alerting @copyconstruct
  23. +1 metrics transfer and storage has a constant overhead +1

    cheap +1 statistical & probabilistic analysis +1 alerting -1 system scoped @copyconstruct
  24. +1 captures the lifetime of requests as they flow through

    the various components of a distributed system @copyconstruct
  25. +1 captures the lifetime of requests as they flow through

    the various components of a distributed system -1 hard to instrument @copyconstruct
  26. “We’ve been implementing a request tracing service for over a

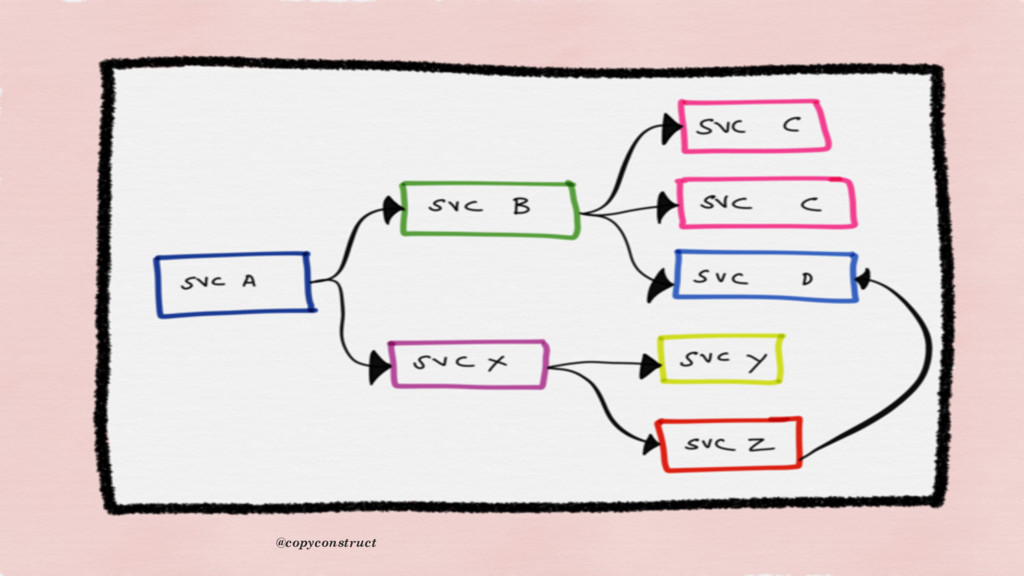
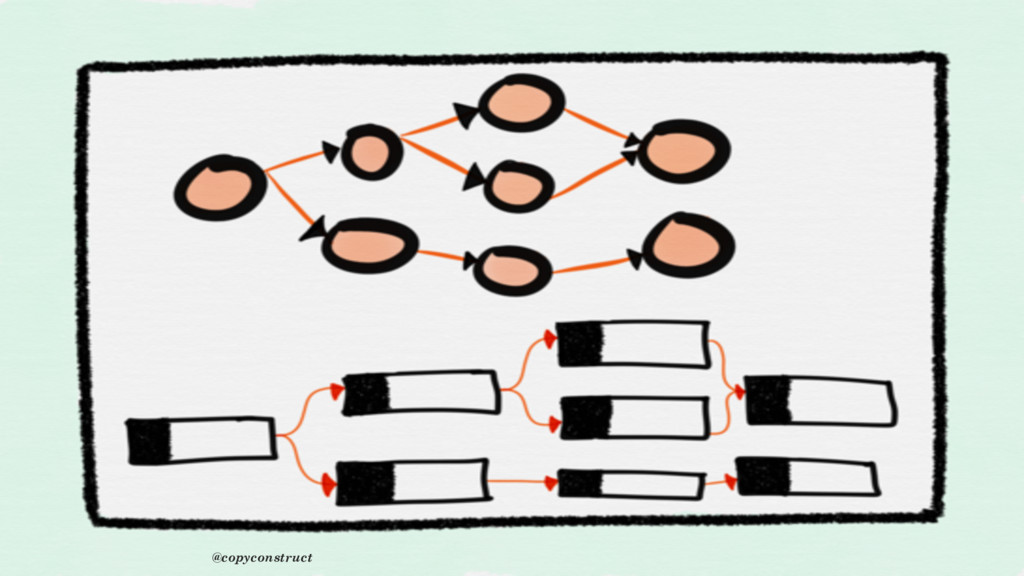
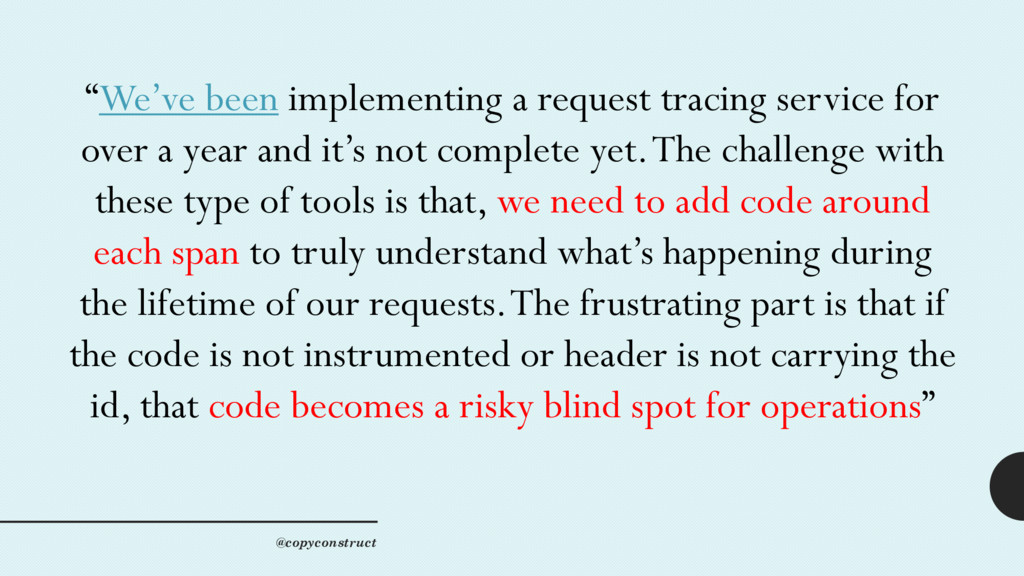
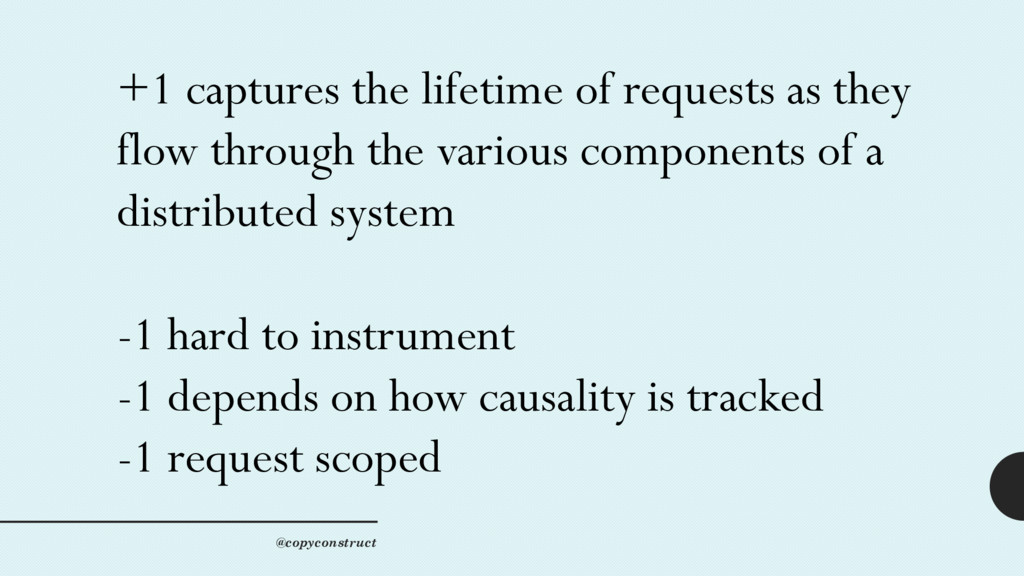
    year and it’s not complete yet. The challenge with these type of tools is that, we need to add code around each span to truly understand what’s happening during the lifetime of our requests. The frustrating part is that if the code is not instrumented or header is not carrying the id, that code becomes a risky blind spot for operations” @copyconstruct
  27. +1 captures the lifetime of requests as they flow through

    the various components of a distributed system -1 hard to instrument -1 depends on how causality is tracked @copyconstruct
  28. +1 captures the lifetime of requests as they flow through

    the various components of a distributed system -1 hard to instrument -1 depends on how causality is tracked -1 request scoped @copyconstruct
  29. o Quotas o Dynamic Sampling o Logging is a Stream

    Processing Problem @copyconstruct
  30.   Filter to outlier countries from where users viewed this

    article fewer than 100 times in total @copyconstruct
  31. Filter to outlier page loads that performed more than 100

    database queries Or, show me only page loads from Indonesia that took more than 10 seconds to load @copyconstruct
  32. “Prometheus is much more than just the server. I see

    Prometheus as a set of standards and projects, with the server being just one part of a much greater whole” @copyconstruct