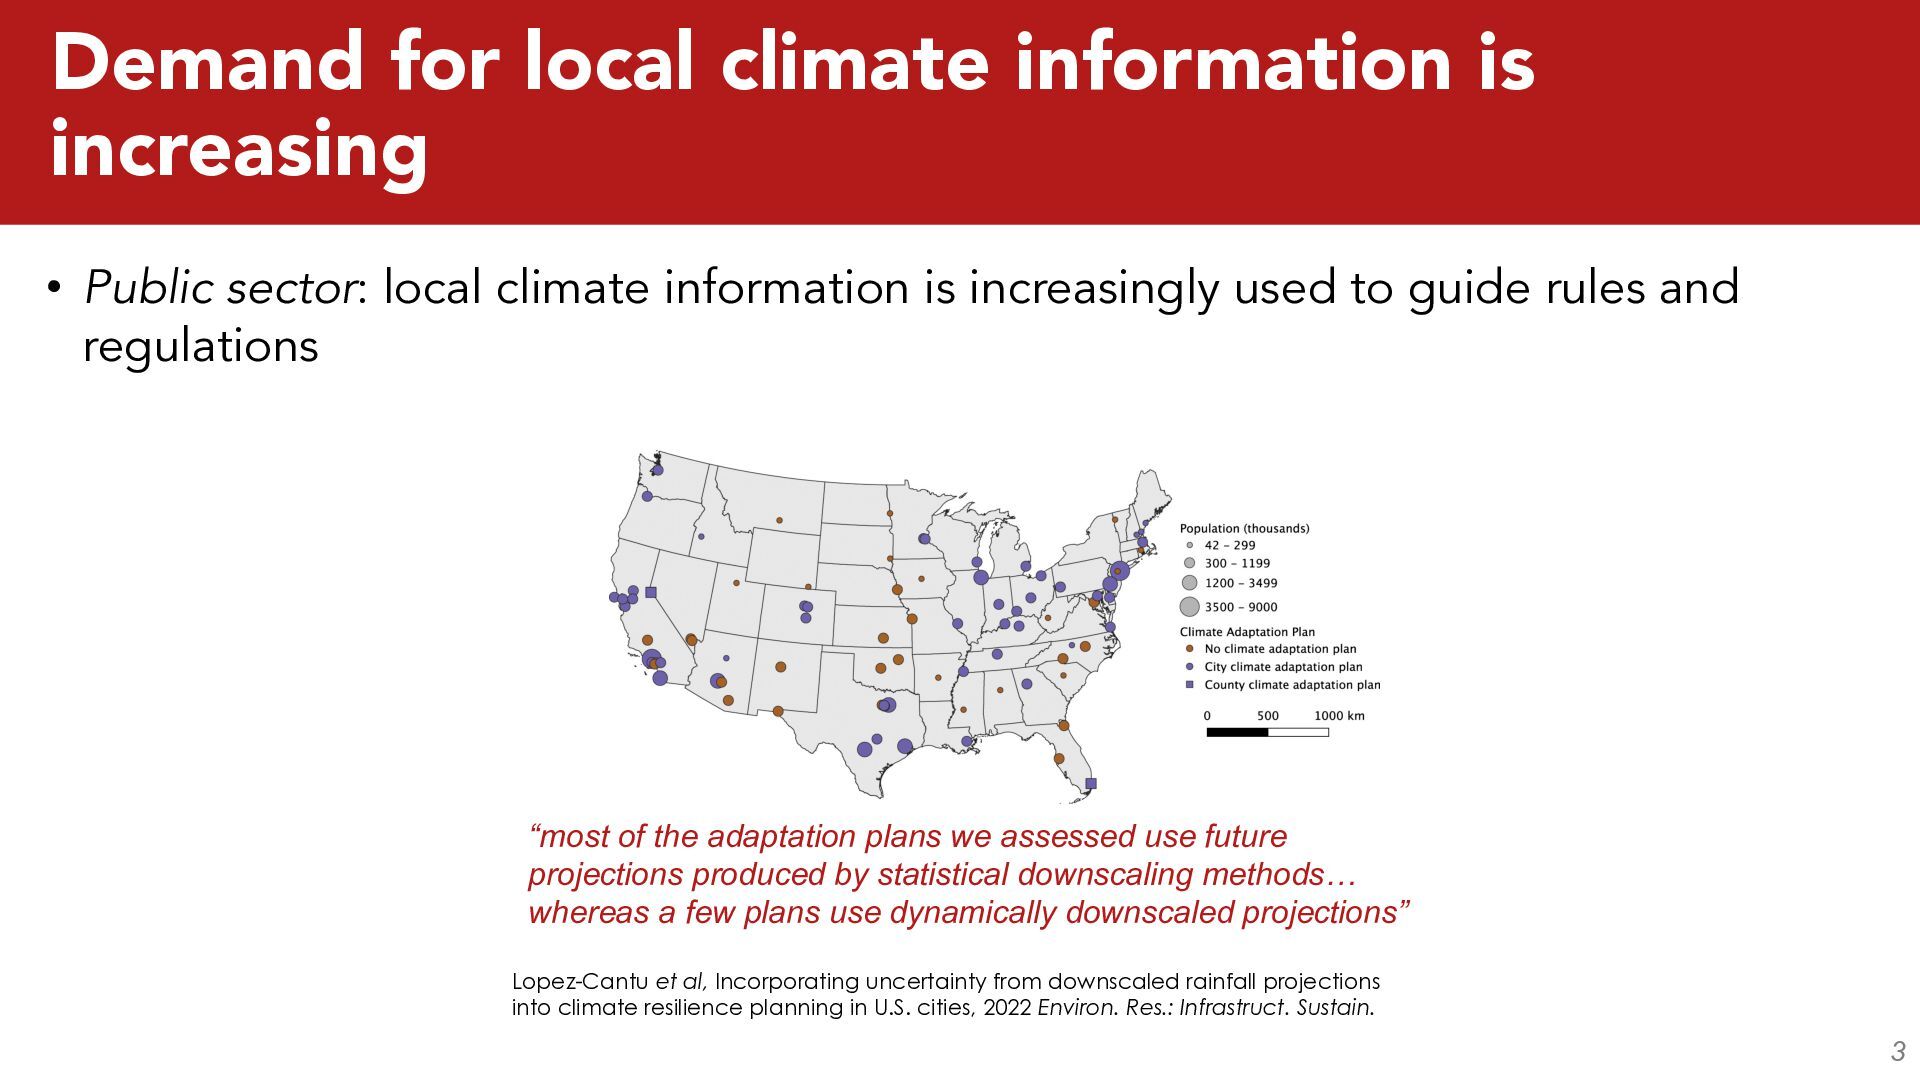
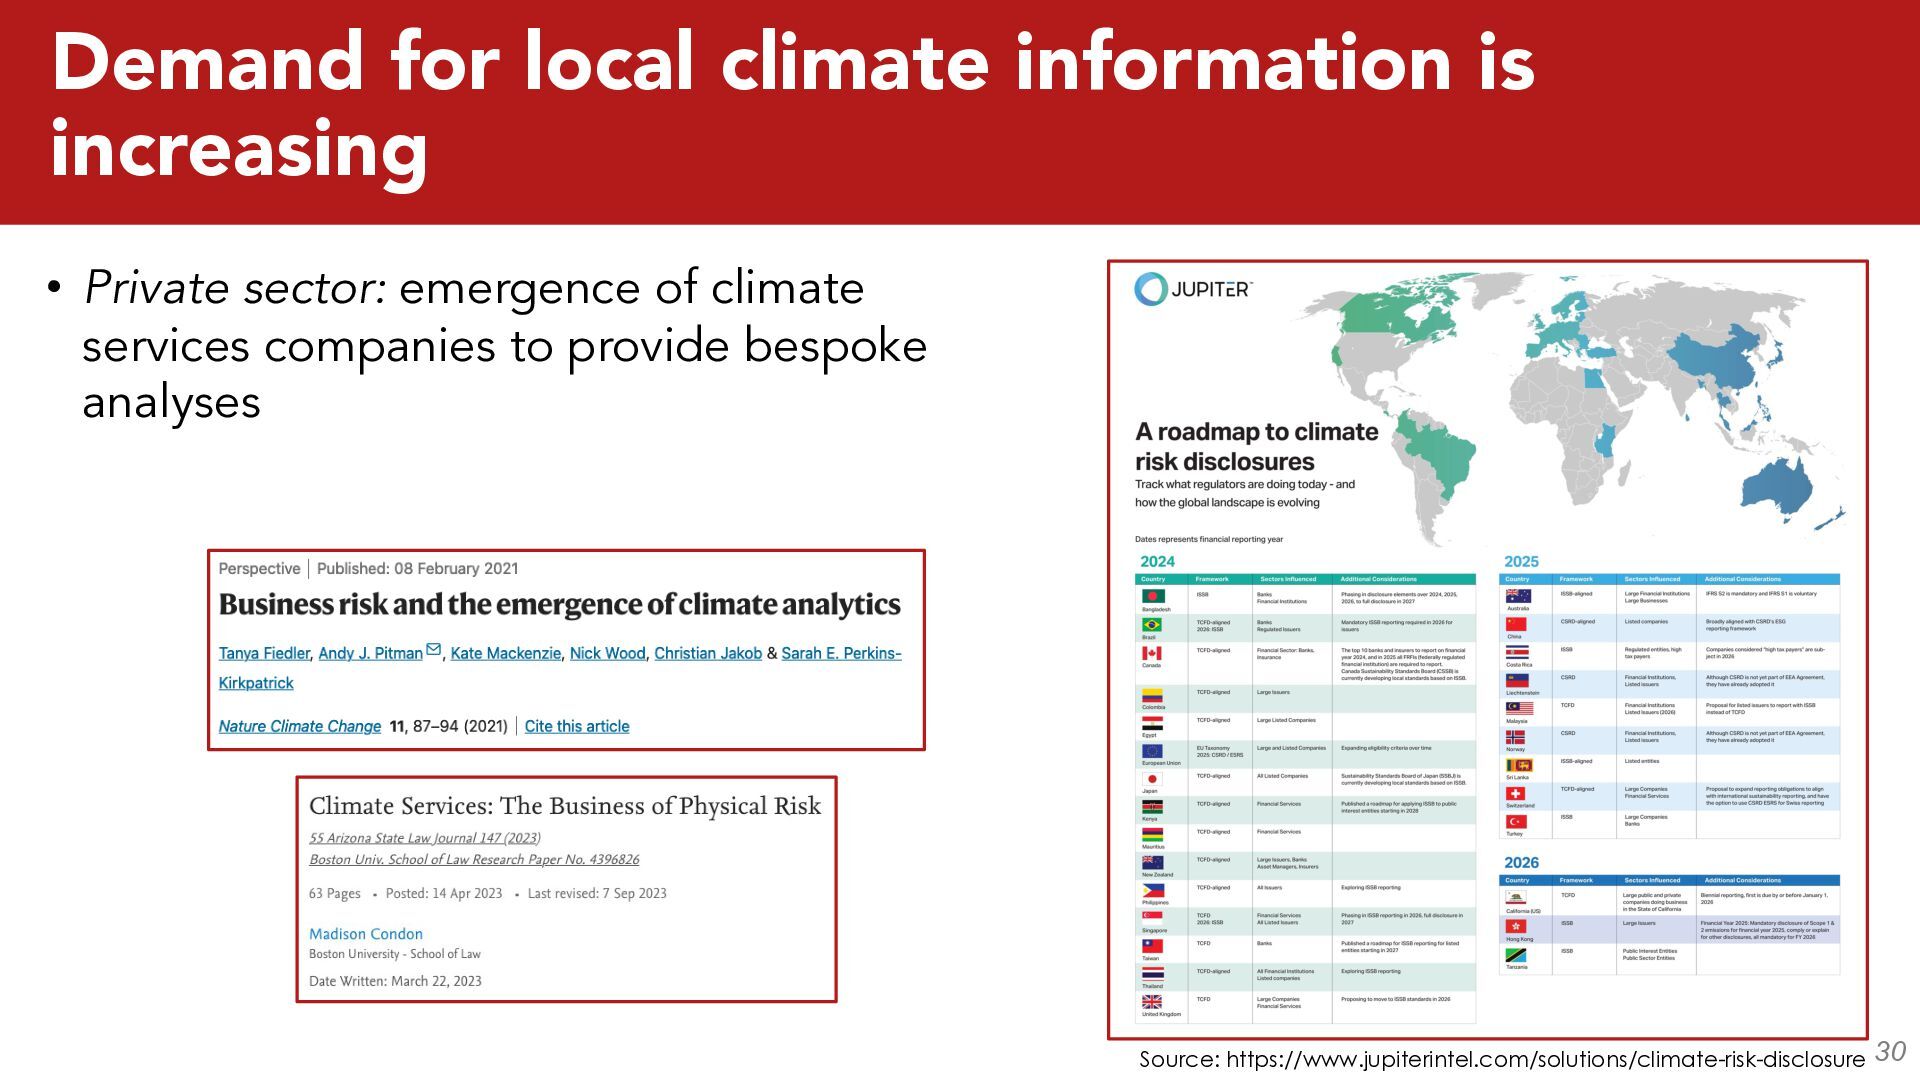
local climate information is increasingly used to guide rules and regulations 3 Lopez-Cantu et al, Incorporating uncertainty from downscaled rainfall projections into climate resilience planning in U.S. cities, 2022 Environ. Res.: Infrastruct. Sustain. “most of the adaptation plans we assessed use future projections produced by statistical downscaling methods… whereas a few plans use dynamically downscaled projections”
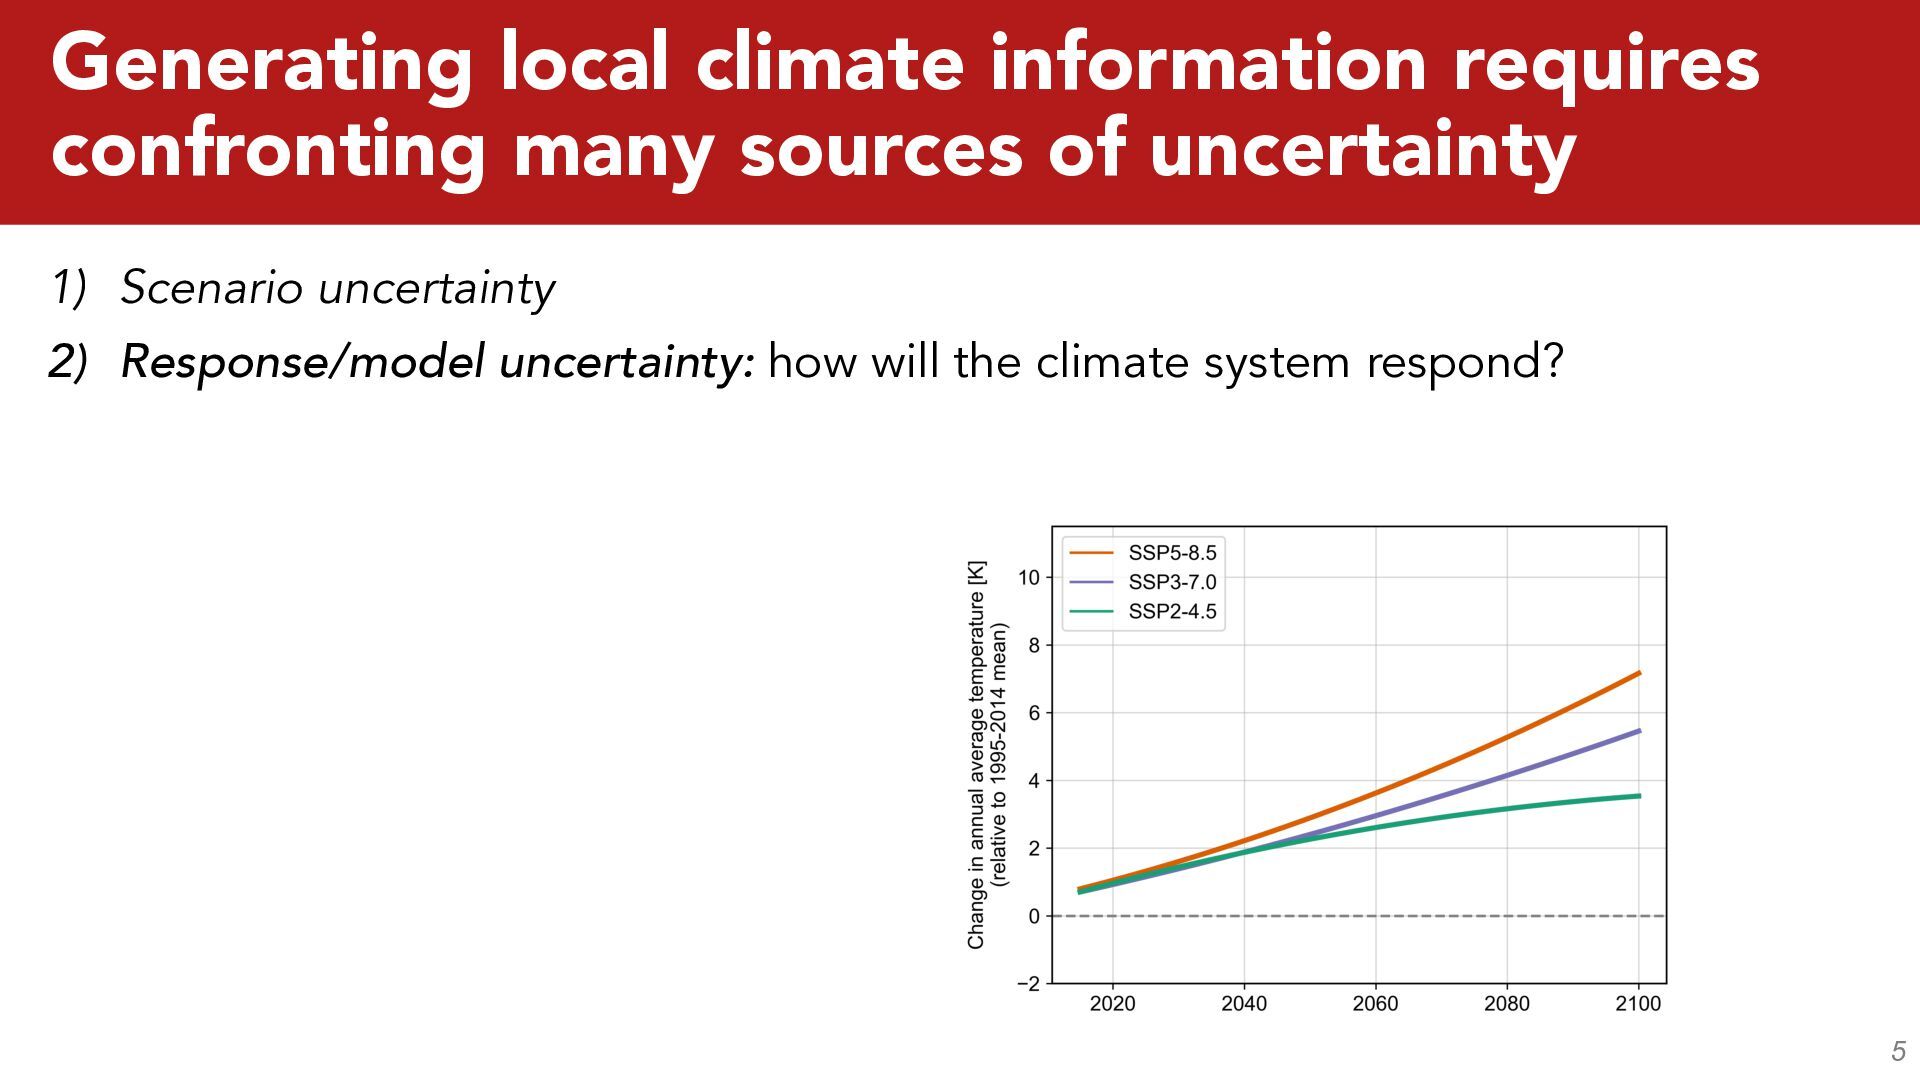
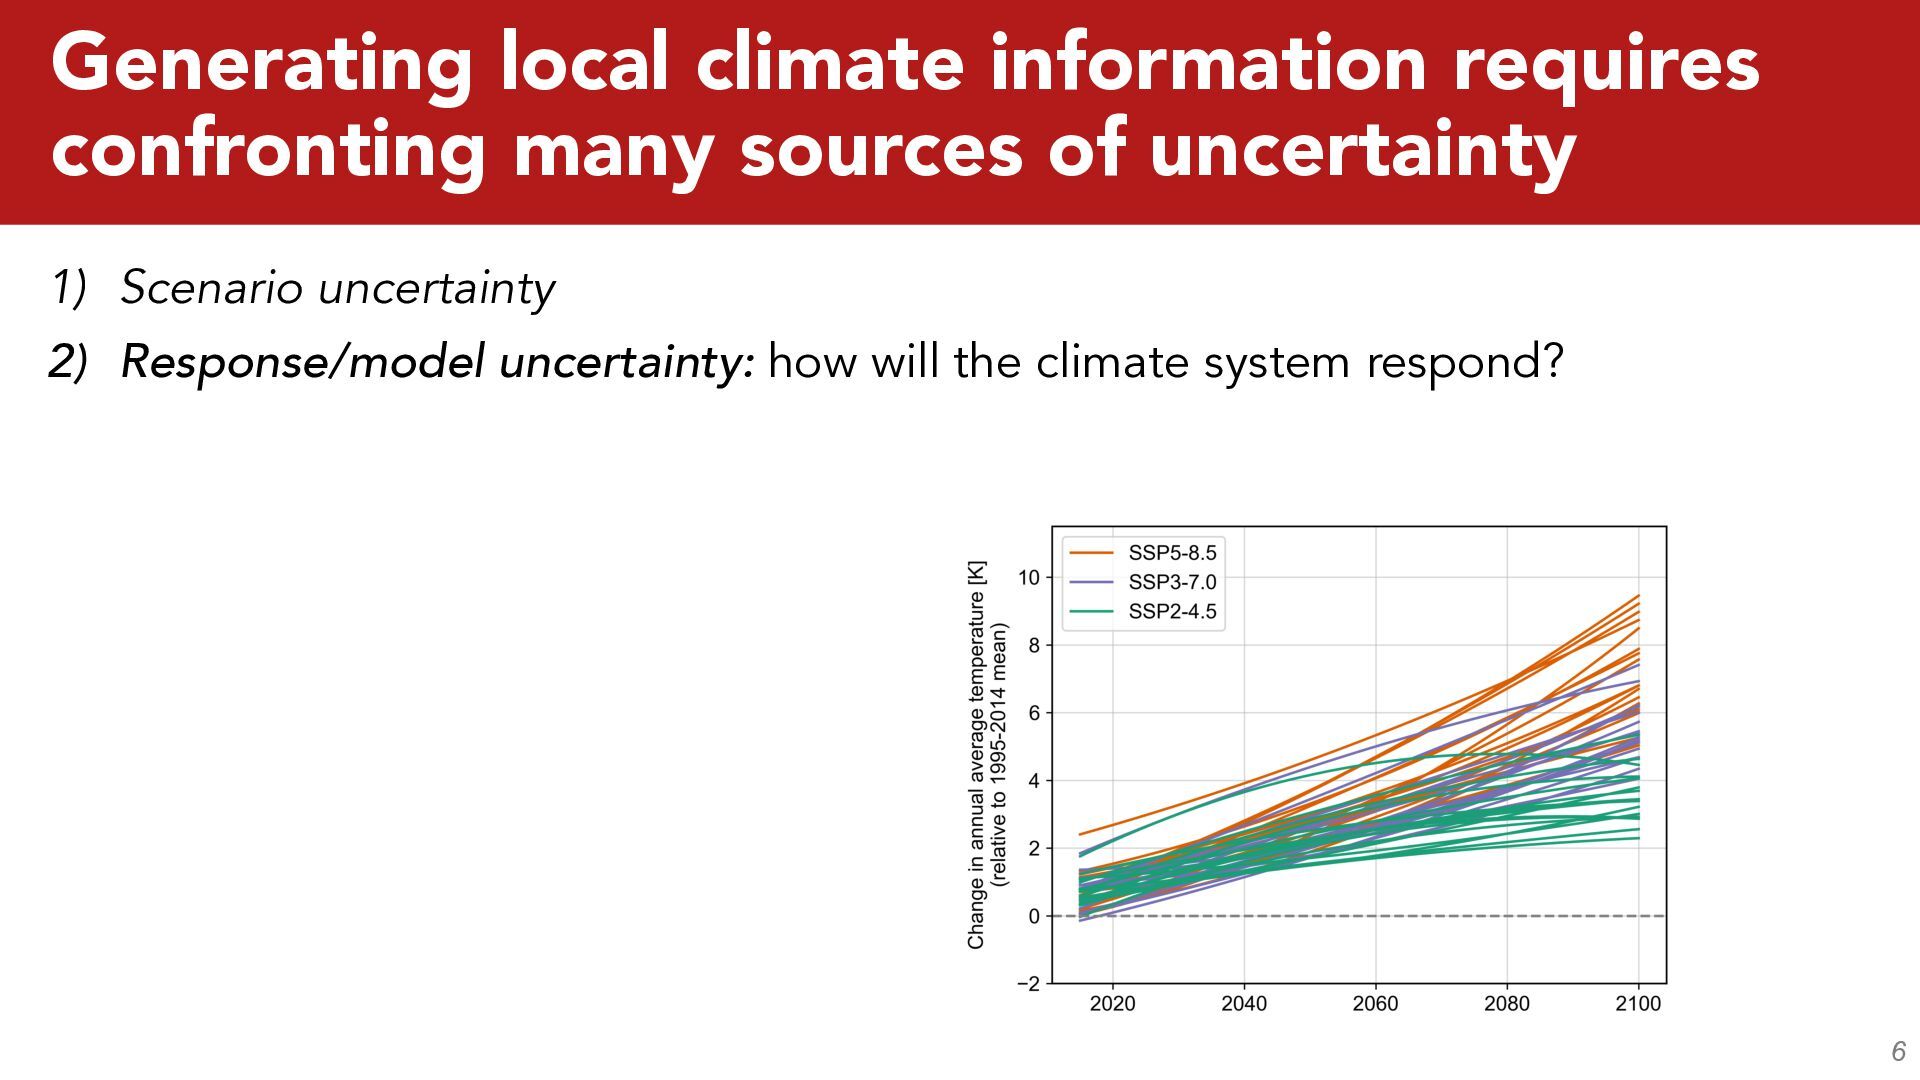
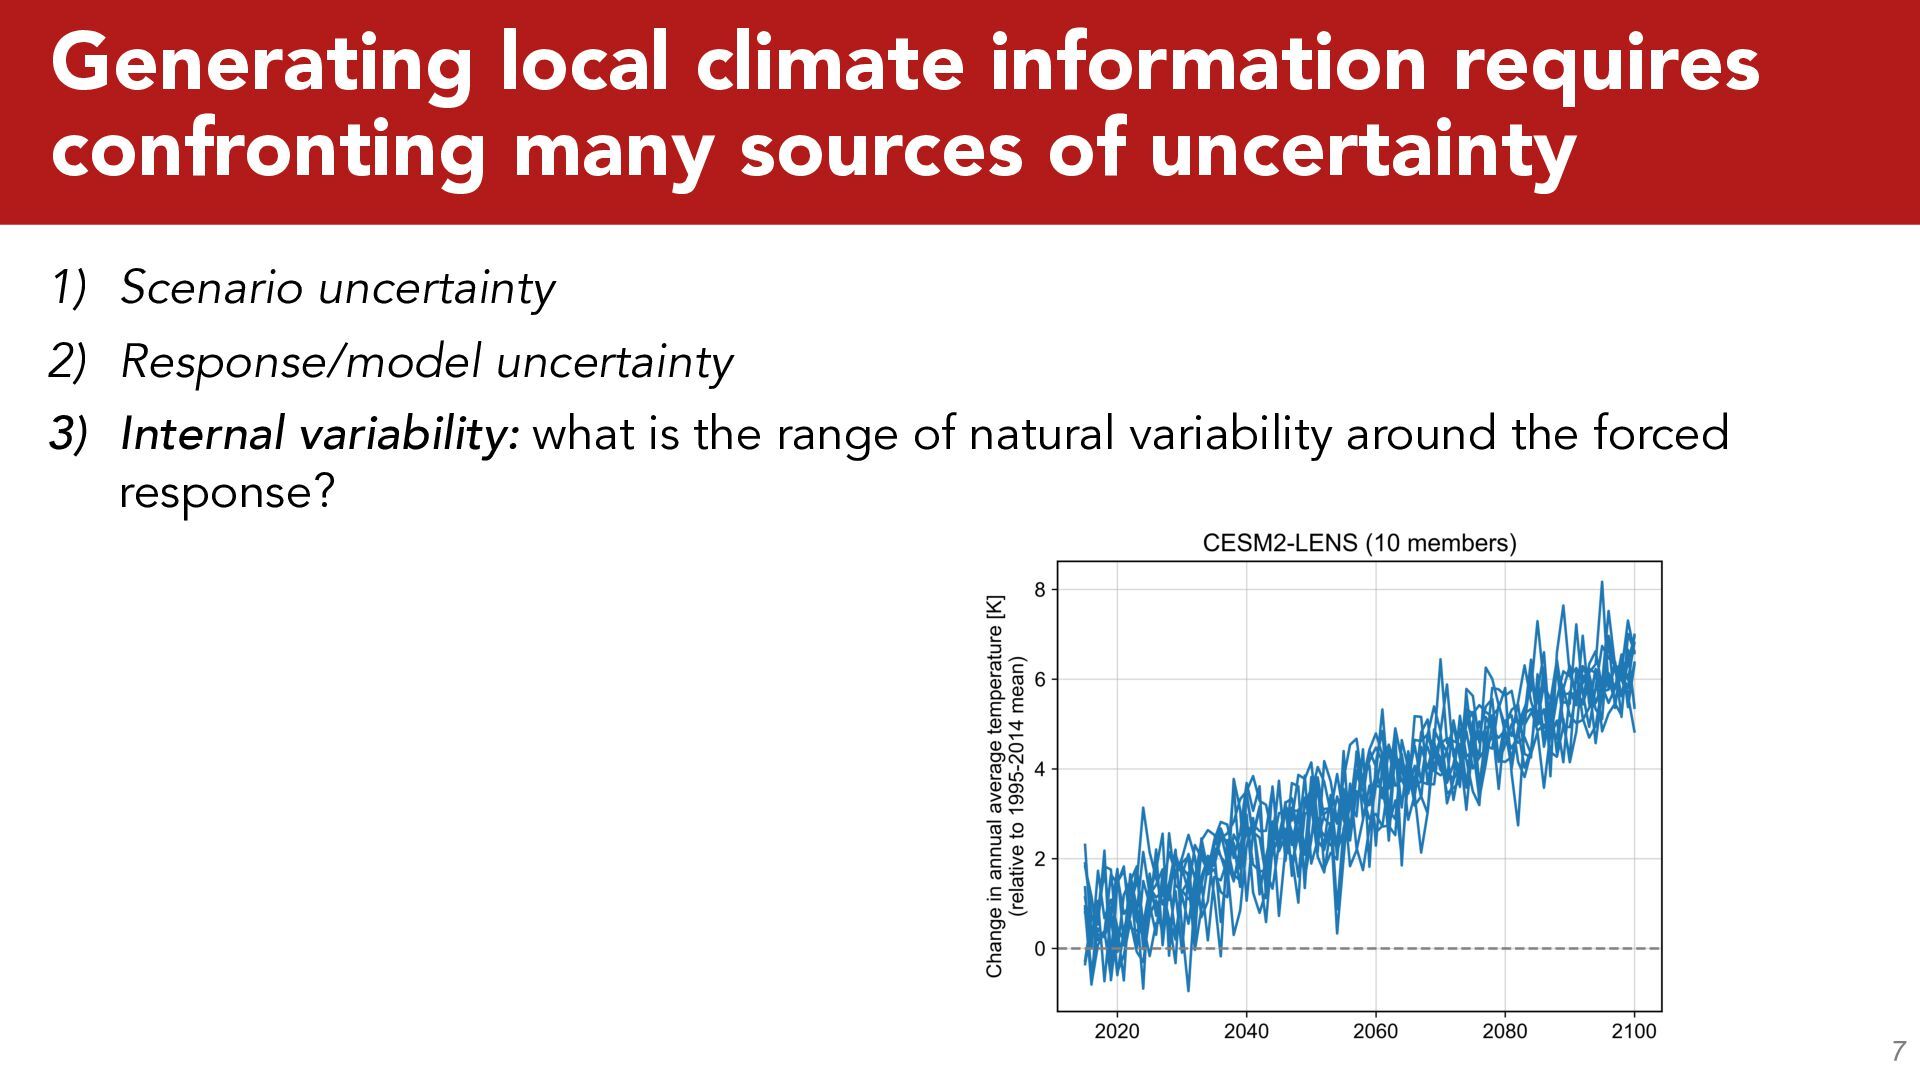
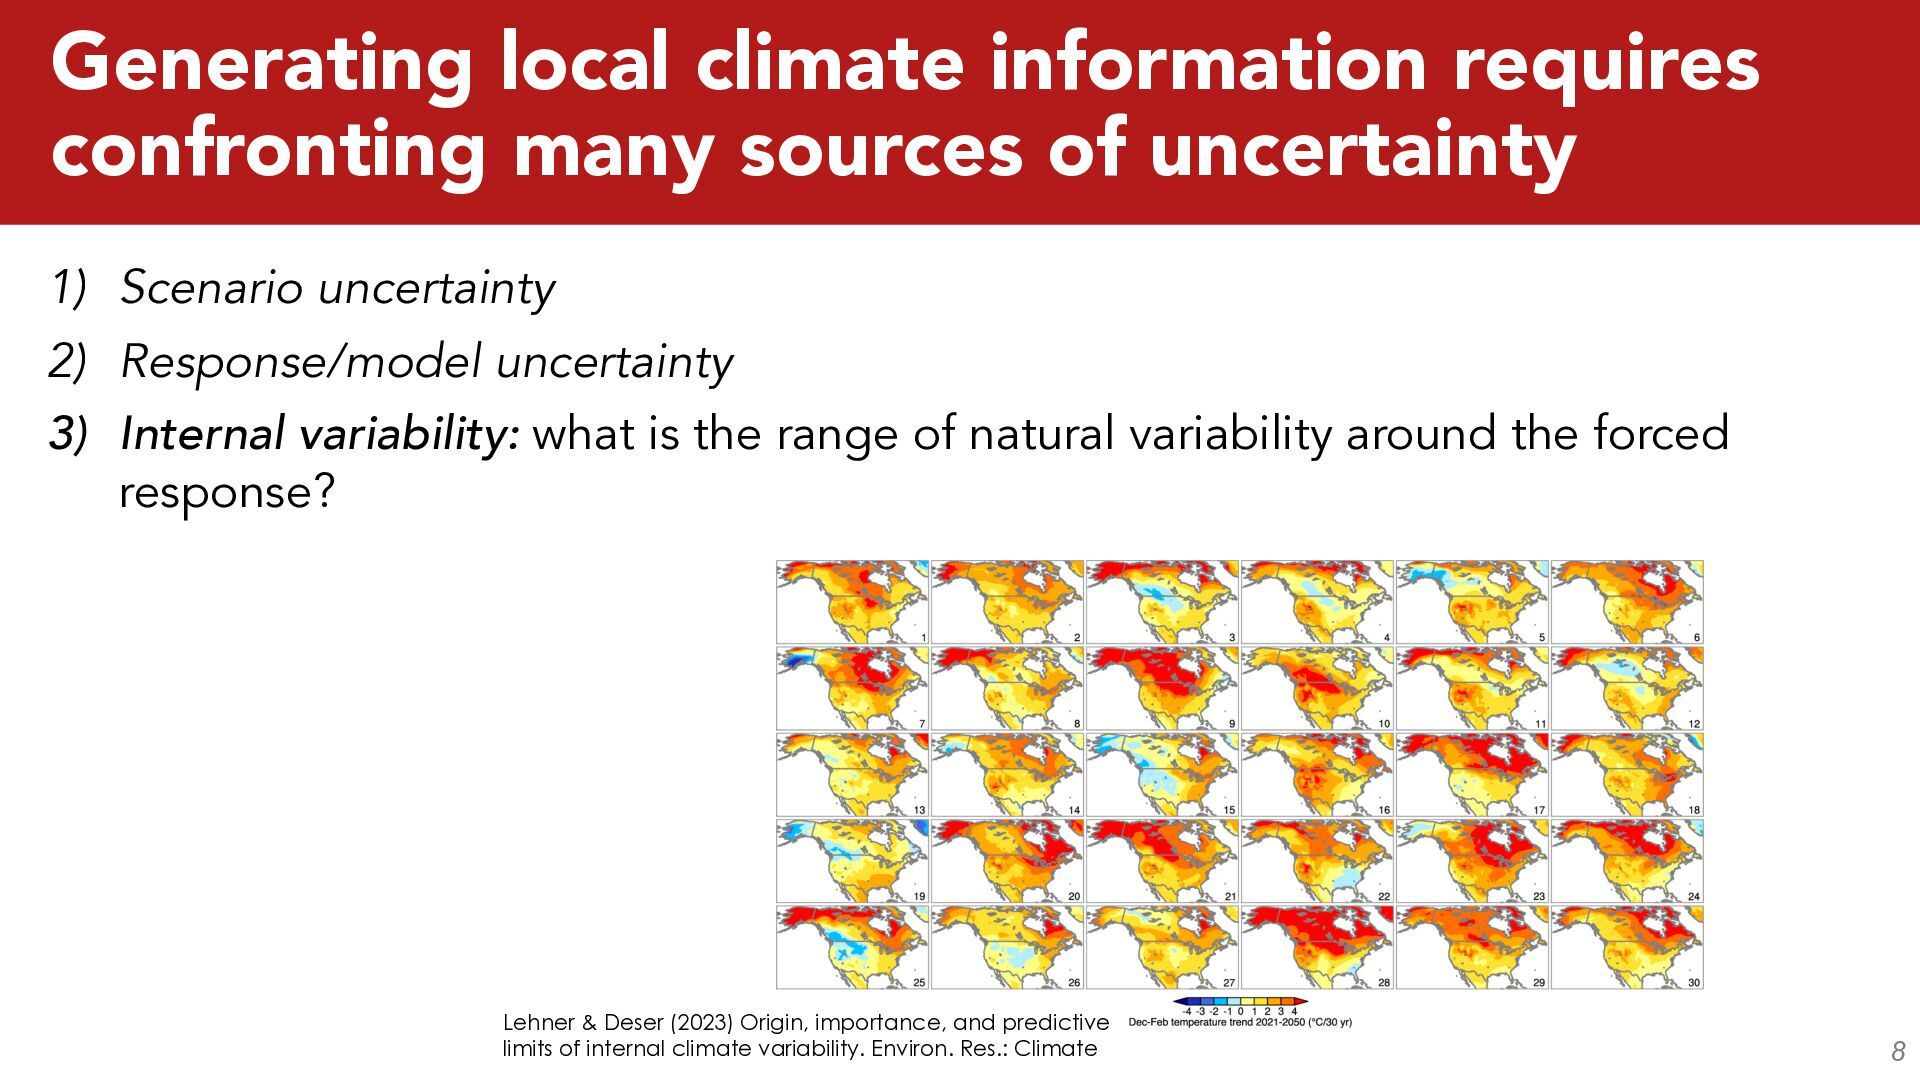
8 1) Scenario uncertainty 2) Response/model uncertainty 3) Internal variability: what is the range of natural variability around the forced response? Lehner & Deser (2023) Origin, importance, and predictive limits of internal climate variability. Environ. Res.: Climate
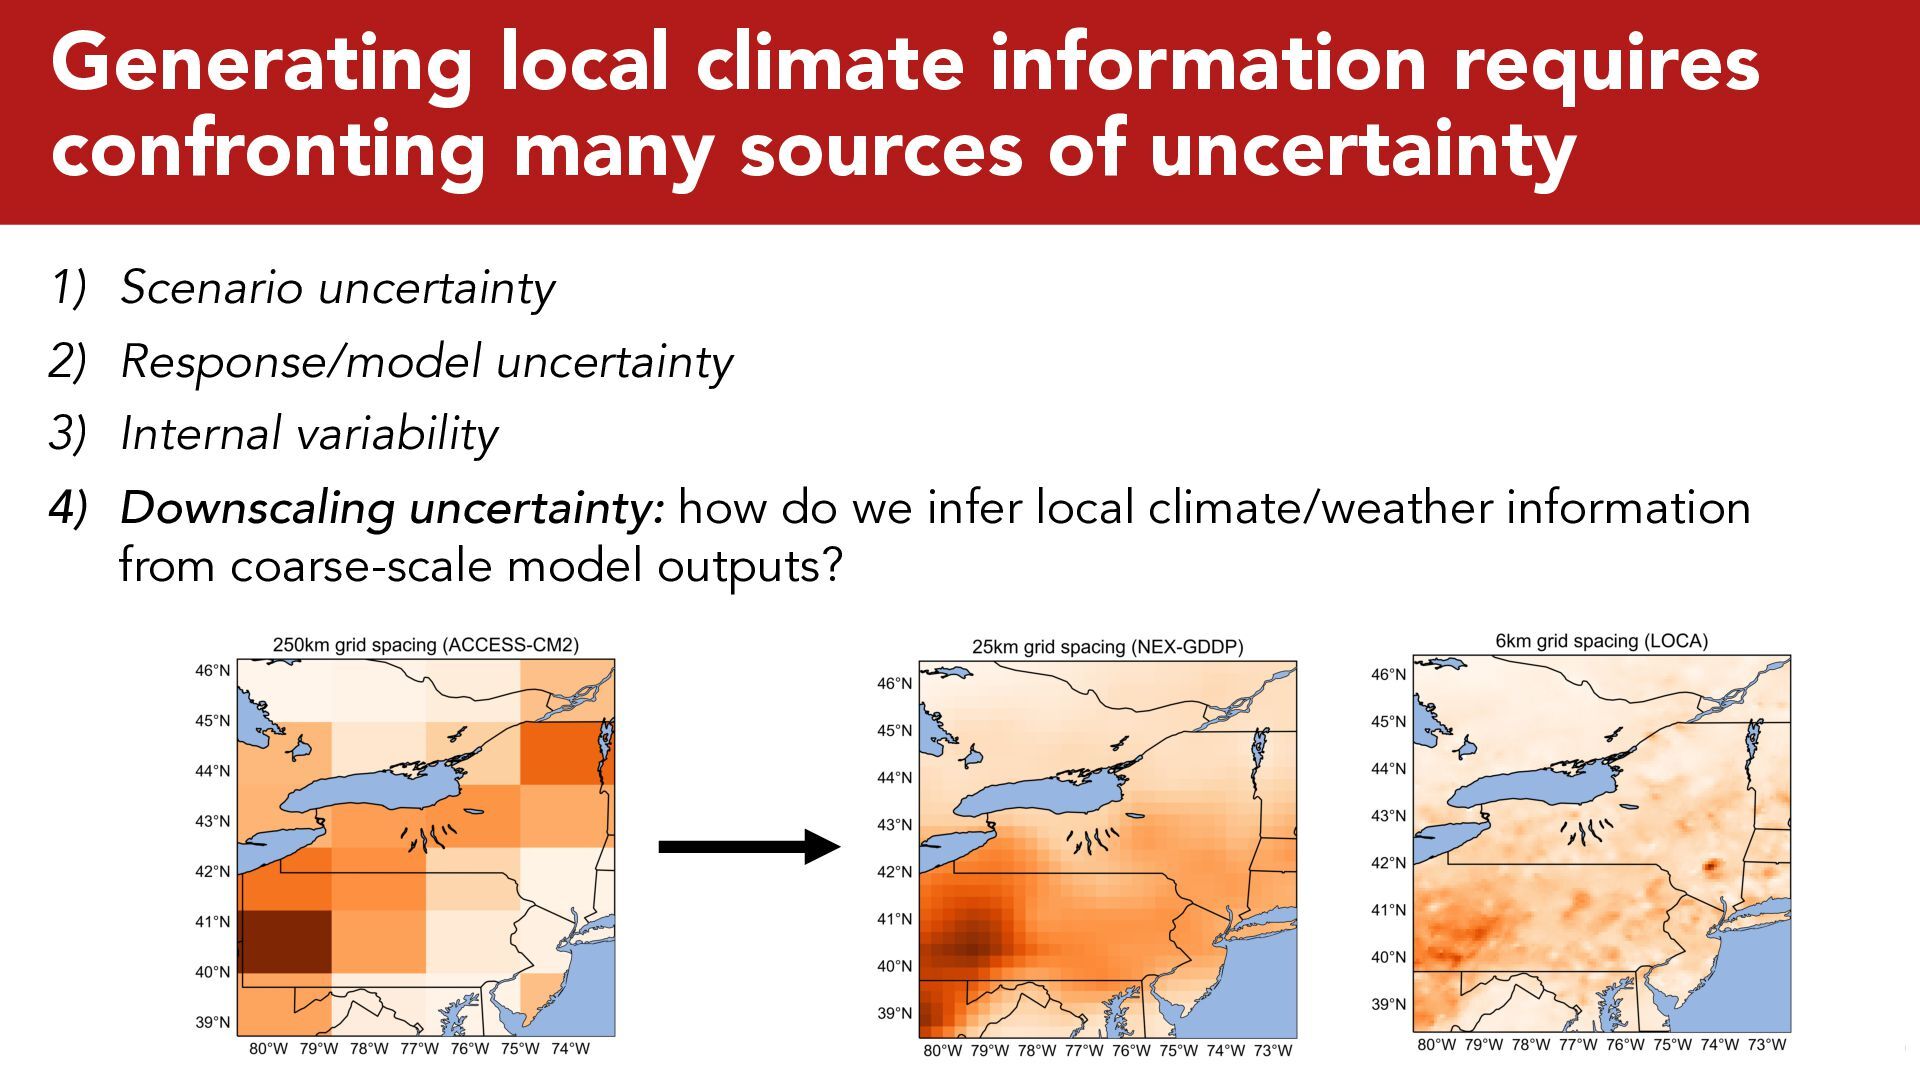
9 1) Scenario uncertainty 2) Response/model uncertainty 3) Internal variability 4) Downscaling uncertainty: how do we infer local climate/weather information from coarse-scale model outputs?
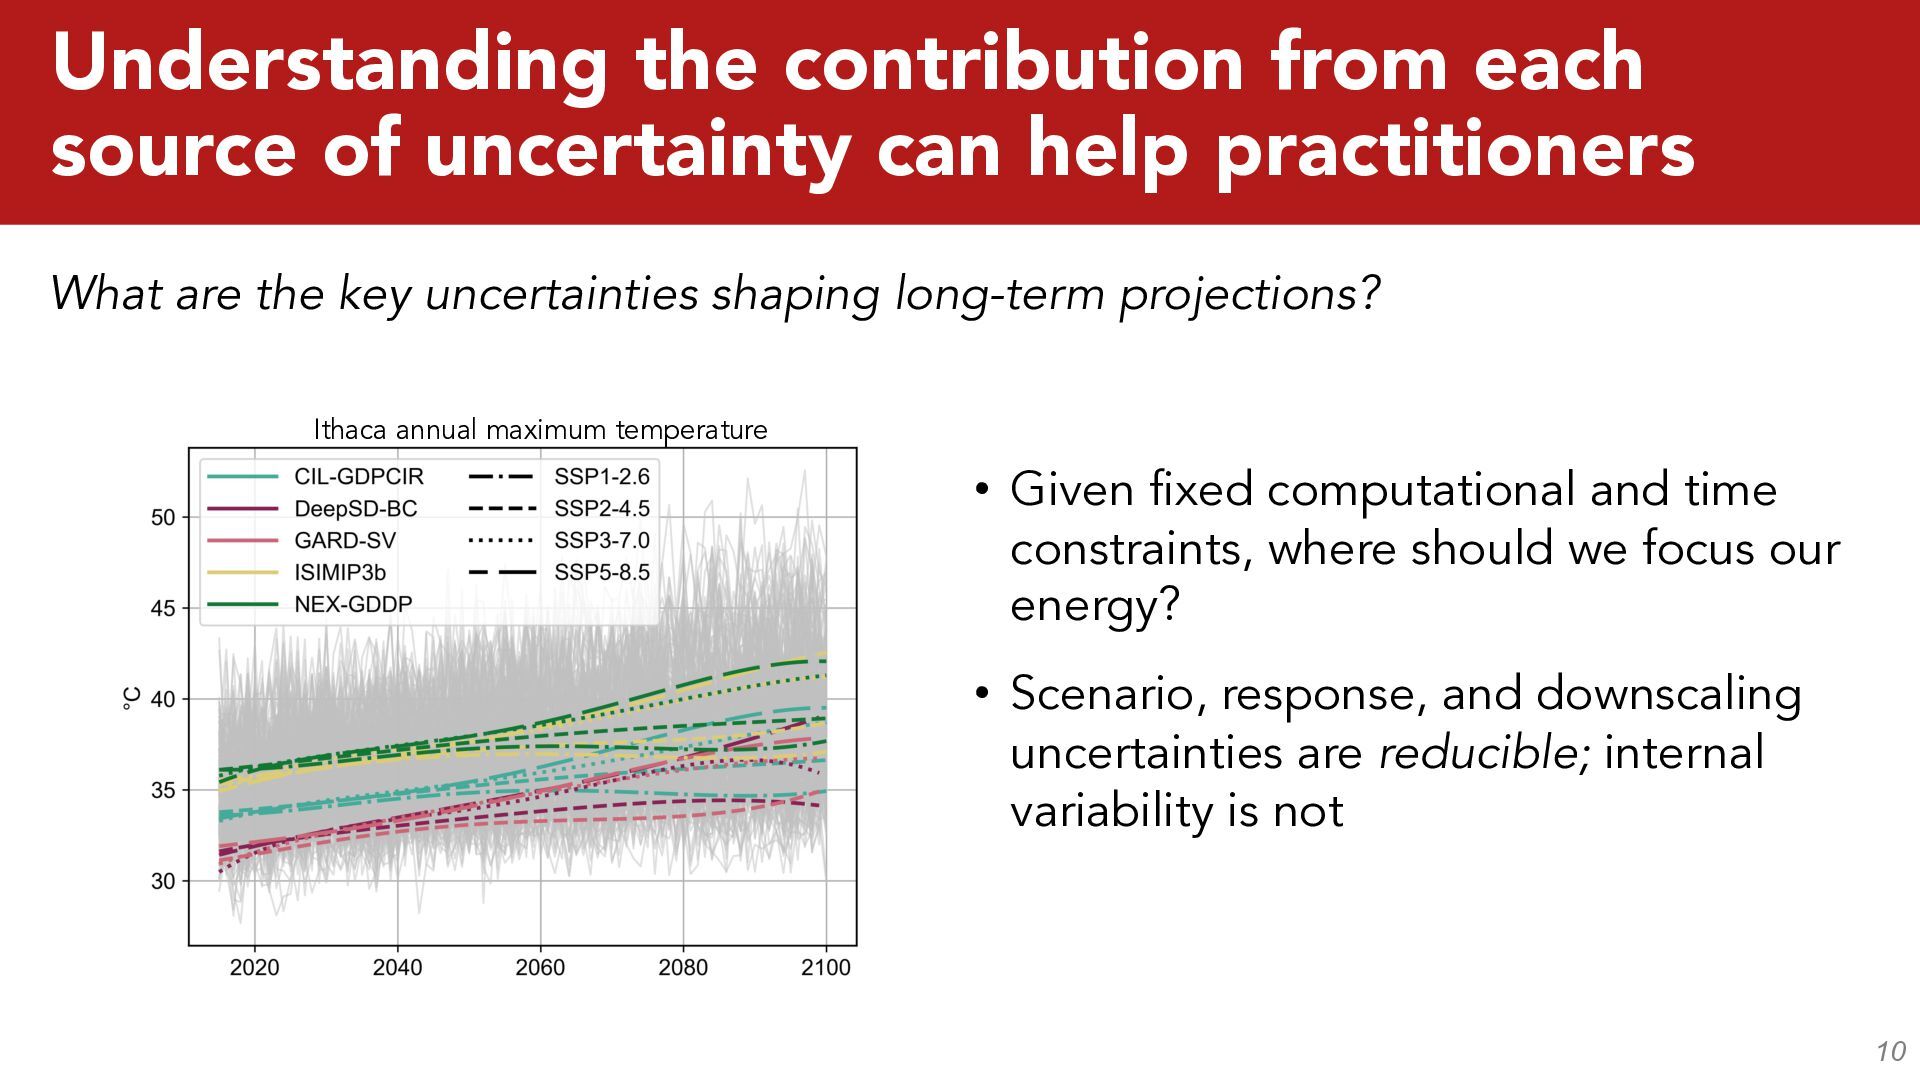
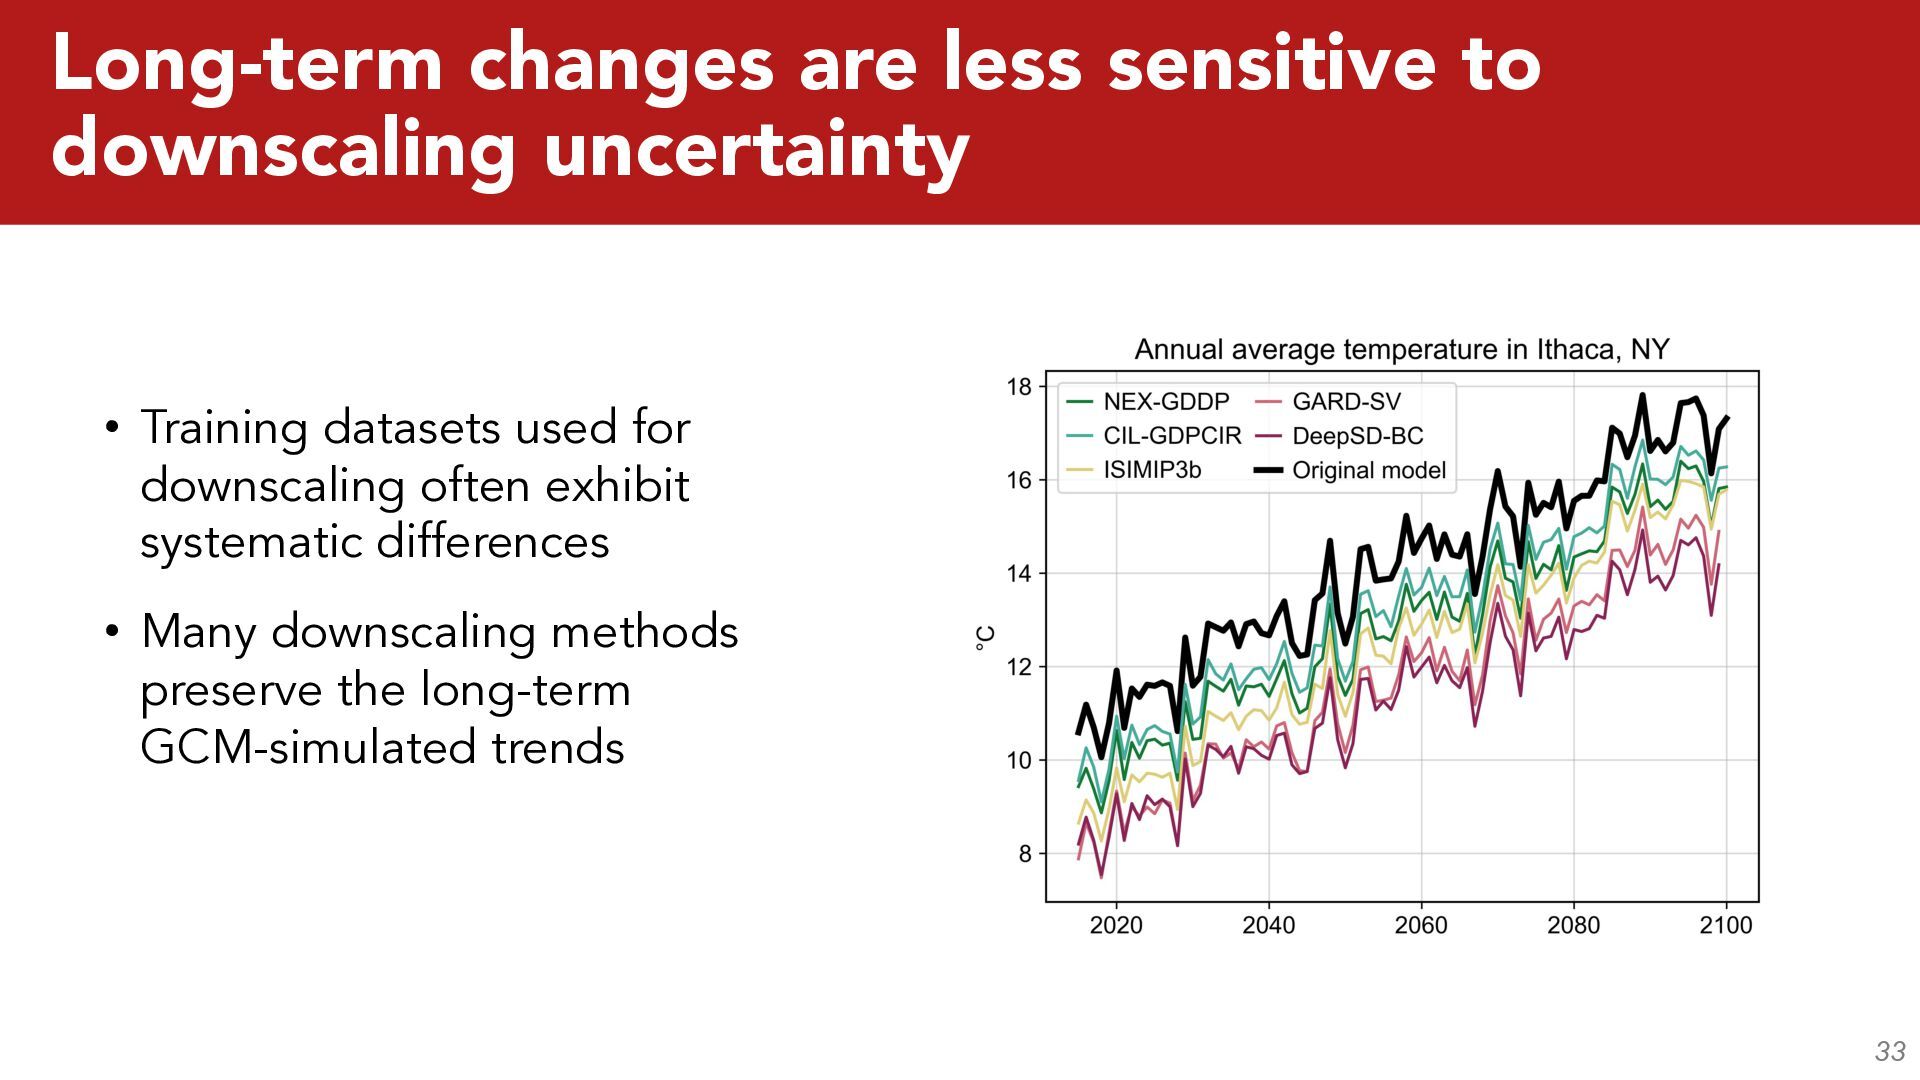
practitioners 10 What are the key uncertainties shaping long-term projections? • Given fixed computational and time constraints, where should we focus our energy? • Scenario, response, and downscaling uncertainties are reducible; internal variability is not Ithaca annual maximum temperature
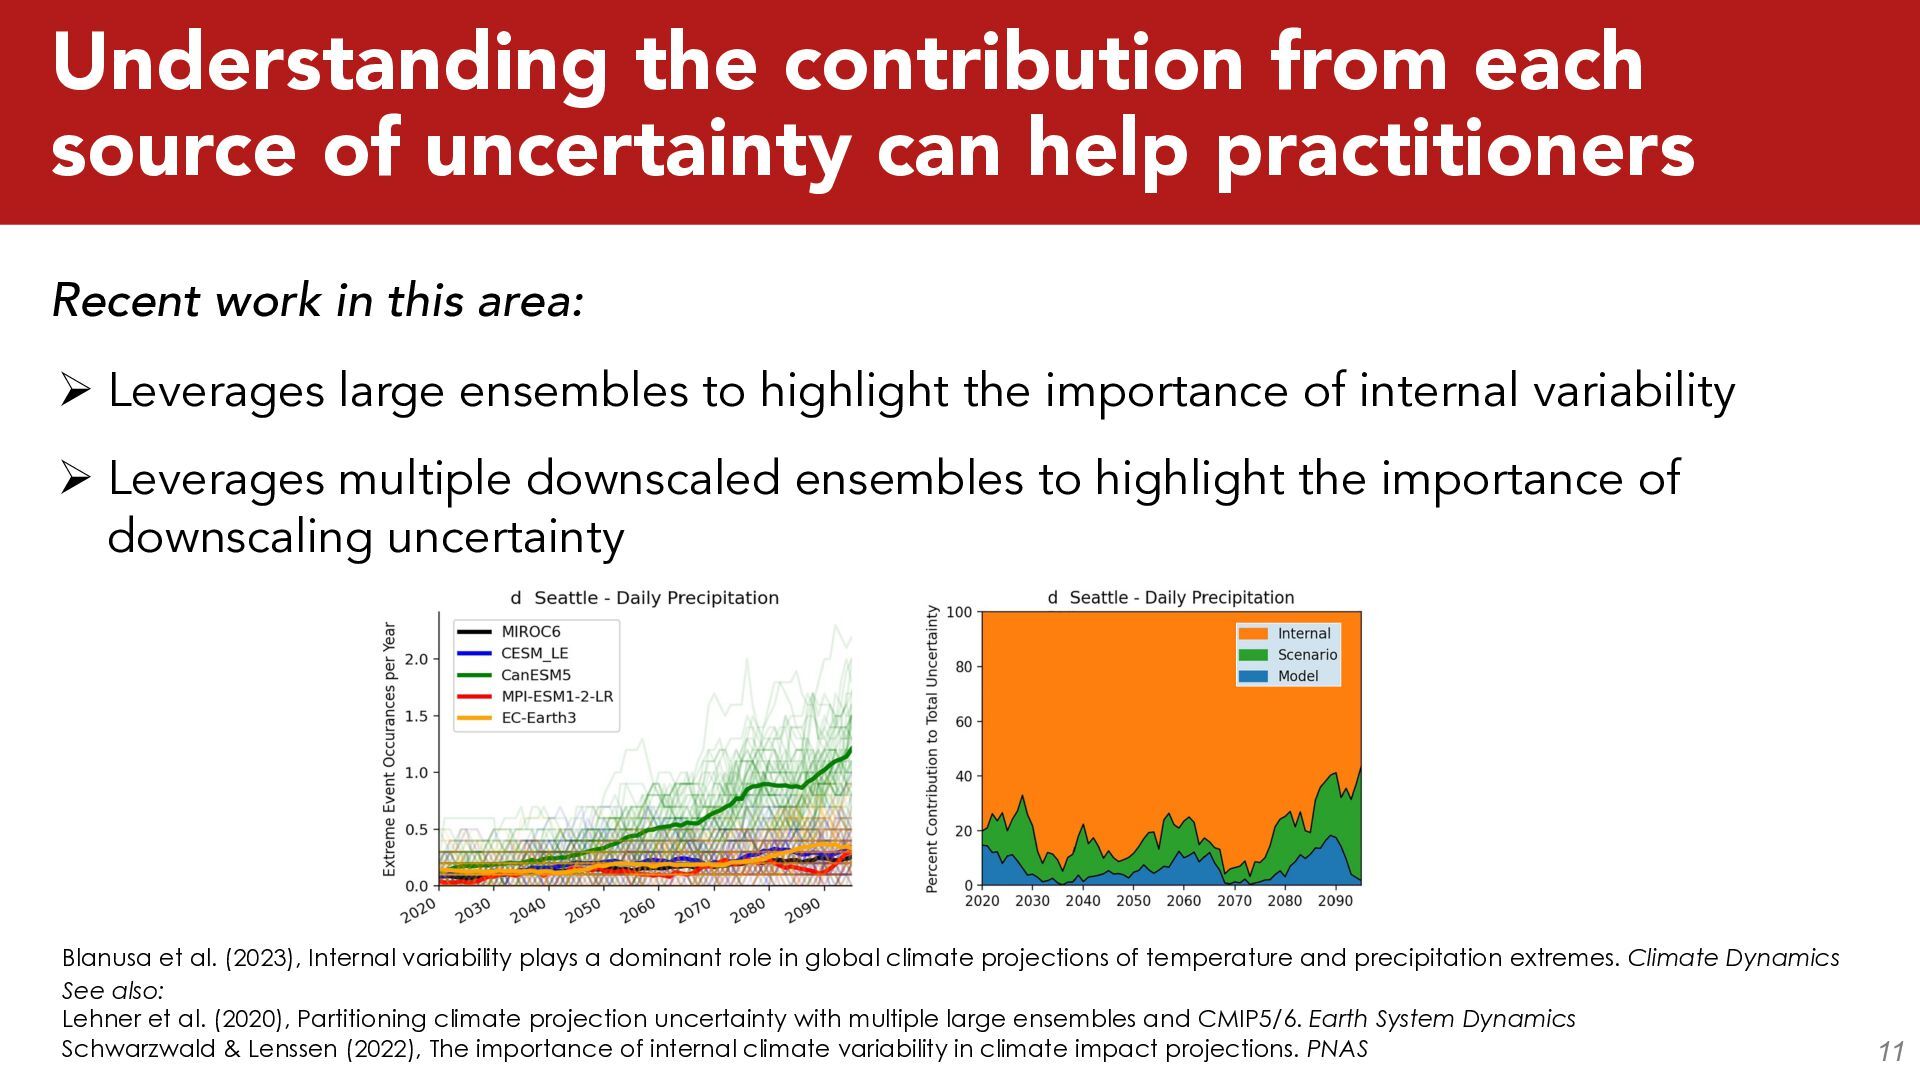
practitioners 11 Blanusa et al. (2023), Internal variability plays a dominant role in global climate projections of temperature and precipitation extremes. Climate Dynamics See also: Lehner et al. (2020), Partitioning climate projection uncertainty with multiple large ensembles and CMIP5/6. Earth System Dynamics Schwarzwald & Lenssen (2022), The importance of internal climate variability in climate impact projections. PNAS Recent work in this area: Ø Leverages large ensembles to highlight the importance of internal variability Ø Leverages multiple downscaled ensembles to highlight the importance of downscaling uncertainty
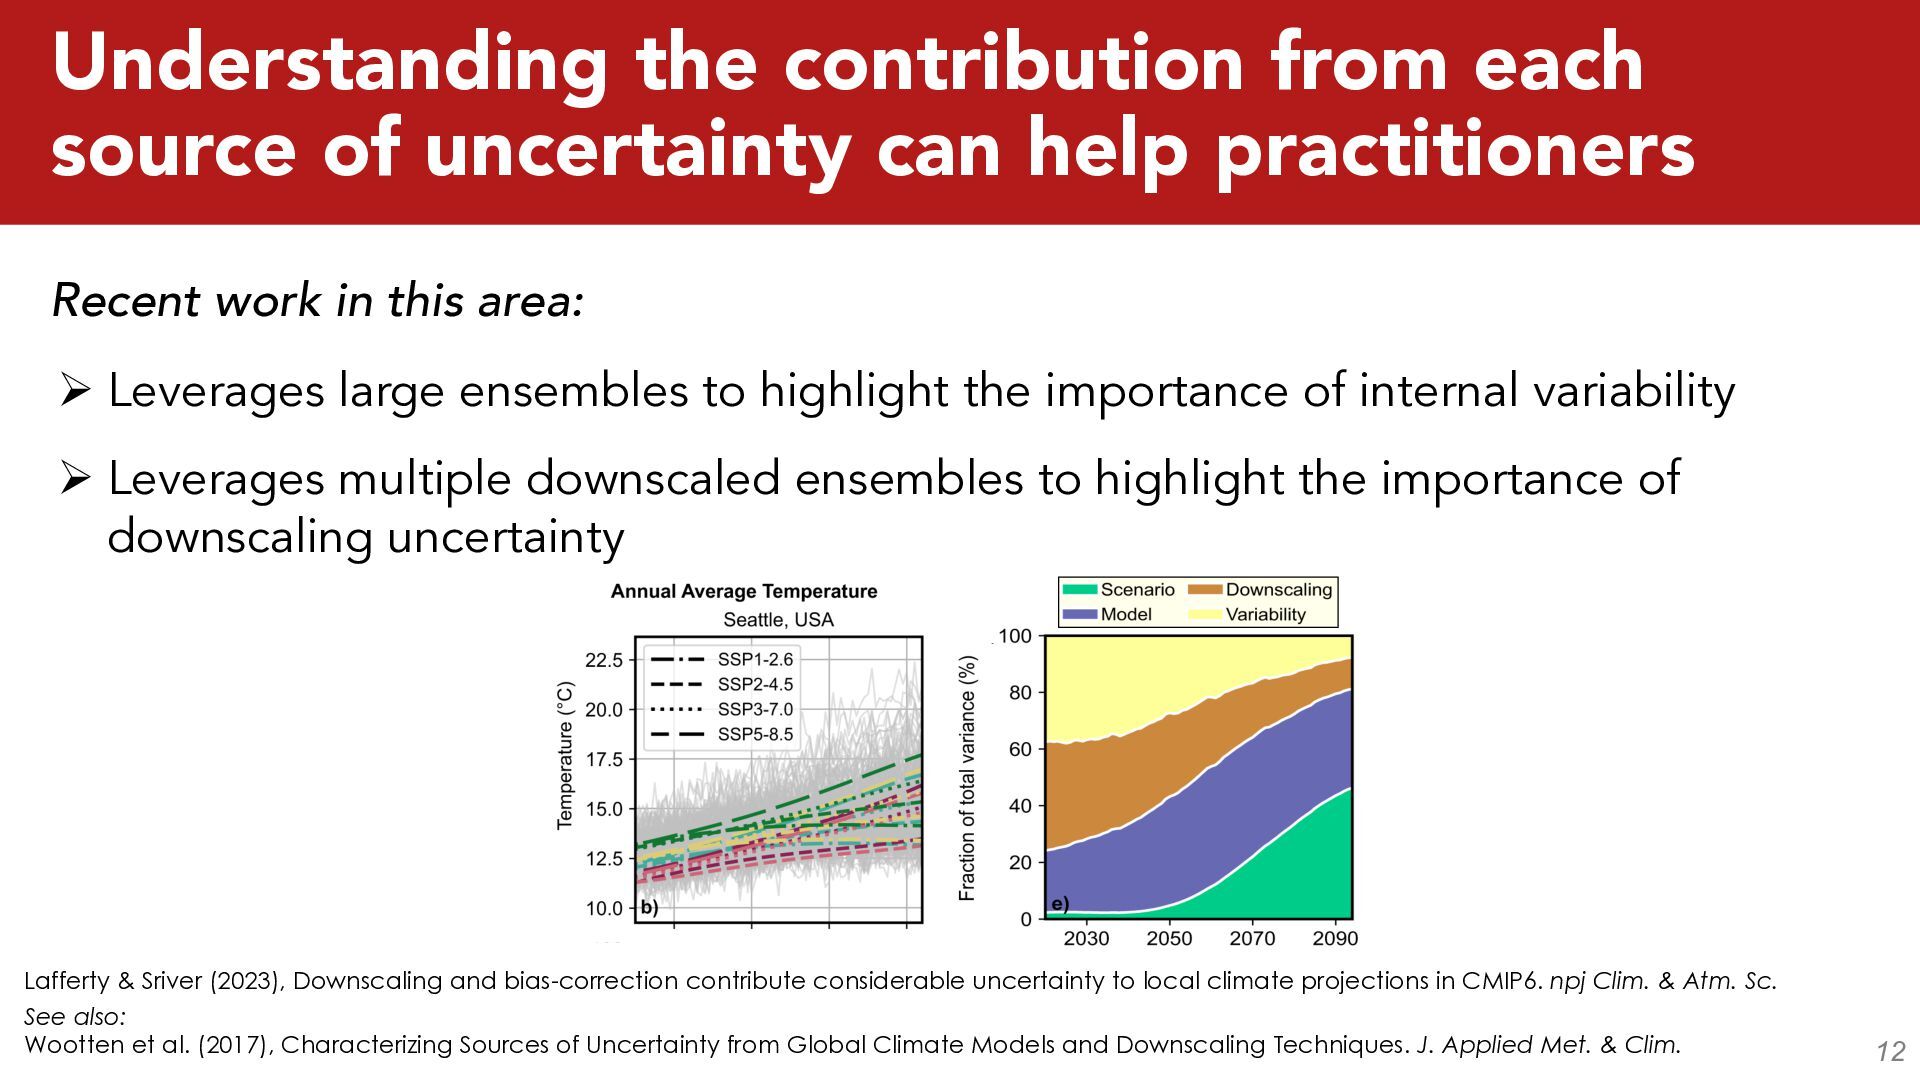
practitioners 12 Recent work in this area: Ø Leverages large ensembles to highlight the importance of internal variability Ø Leverages multiple downscaled ensembles to highlight the importance of downscaling uncertainty Lafferty & Sriver (2023), Downscaling and bias-correction contribute considerable uncertainty to local climate projections in CMIP6. npj Clim. & Atm. Sc. See also: Wootten et al. (2017), Characterizing Sources of Uncertainty from Global Climate Models and Downscaling Techniques. J. Applied Met. & Clim.
practitioners 13 Recent work in this area: Ø Leverages large ensembles to highlight the importance of internal variability Ø Leverages multiple downscaled ensembles to highlight the importance of downscaling uncertainty Outstanding questions: o How do internal variability and downscaling uncertainty combine to shape local risk estimates? Data limitations have prevented us analyzing internal variability and downscaling uncertainty in a single framework.
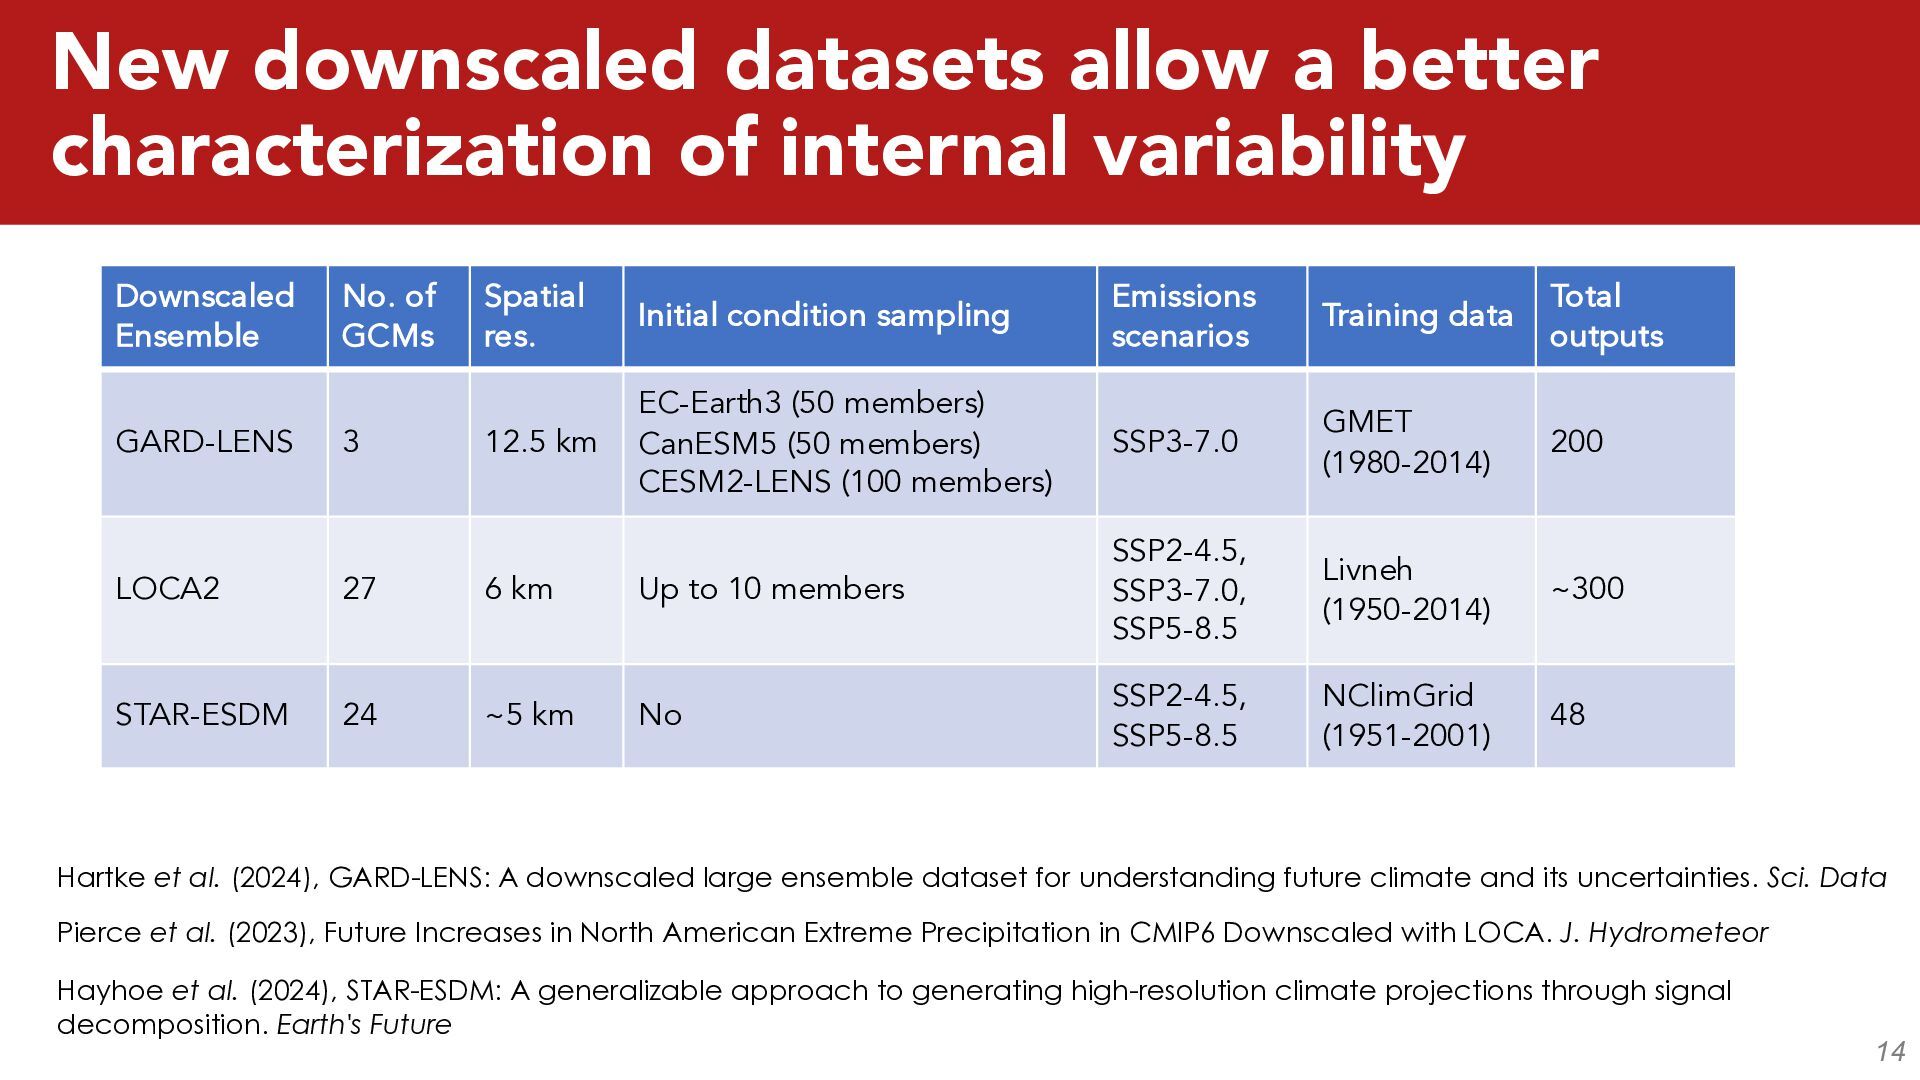
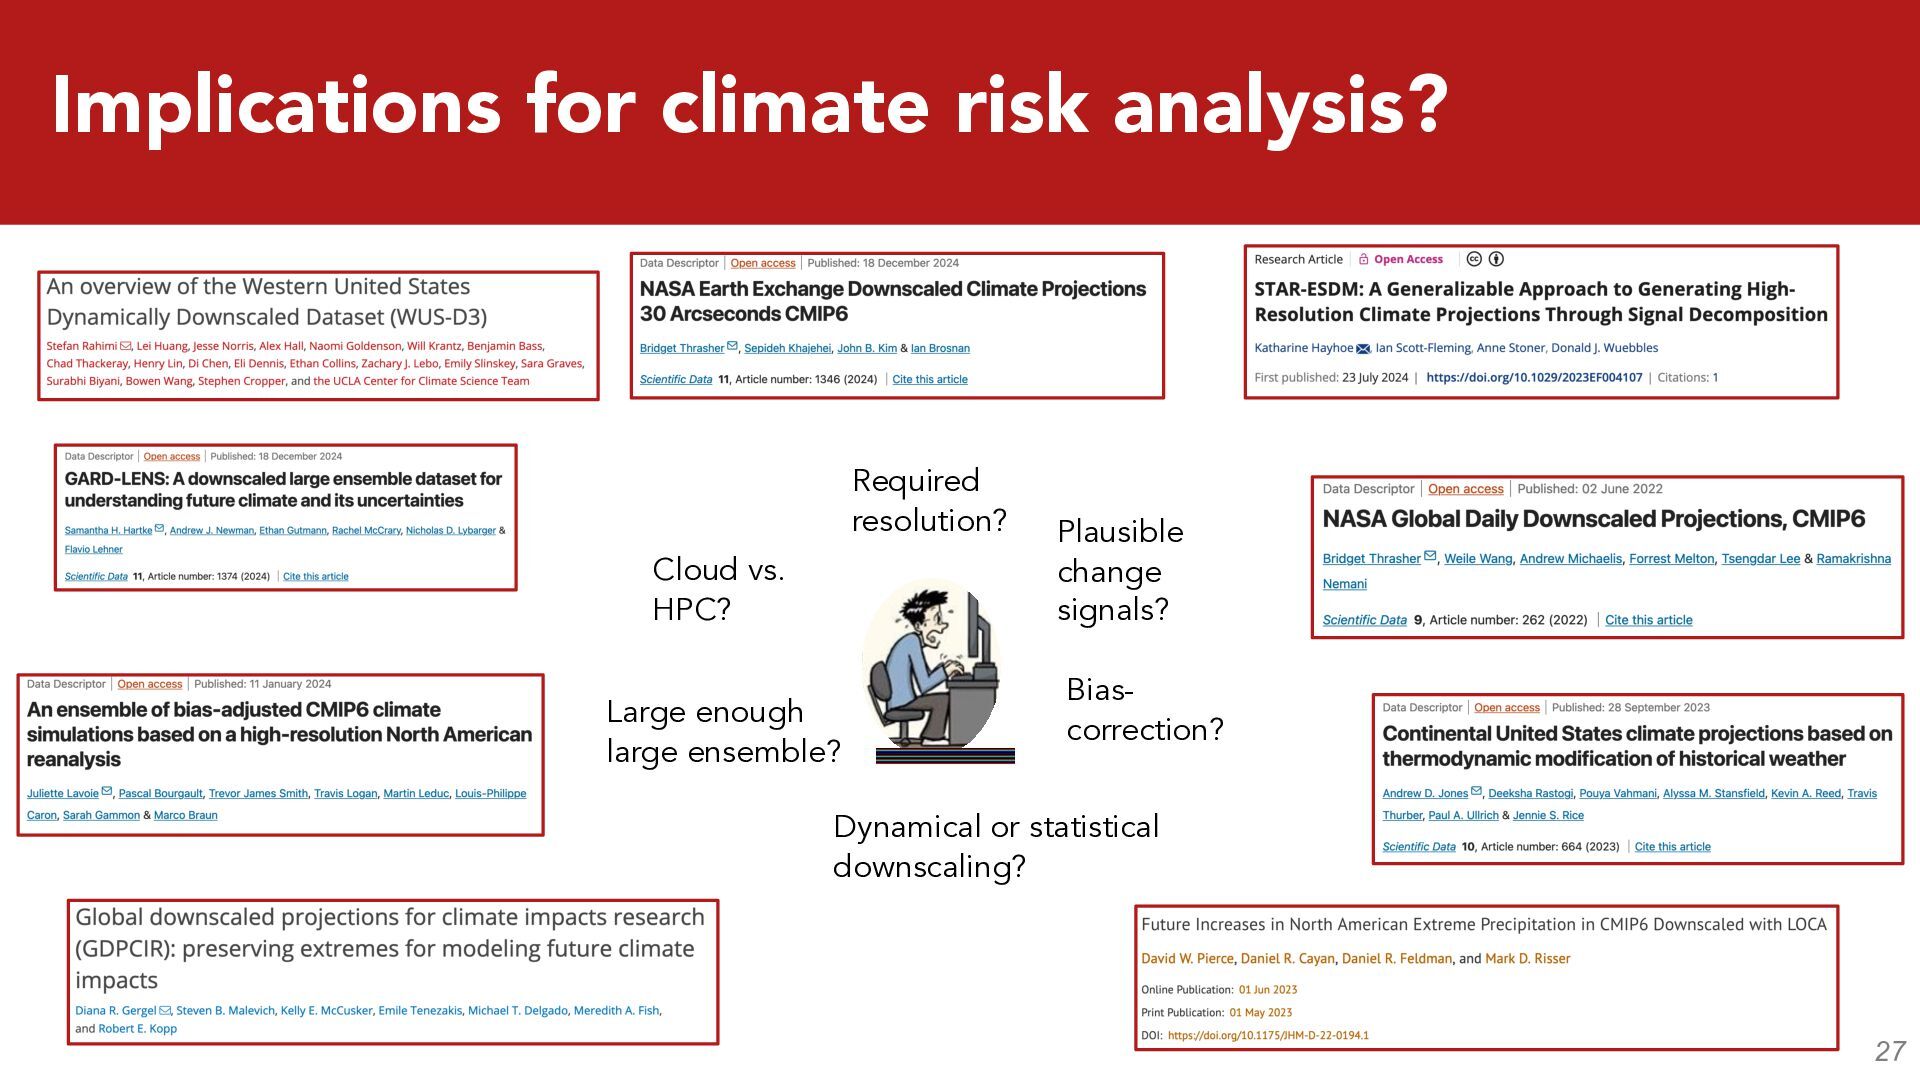
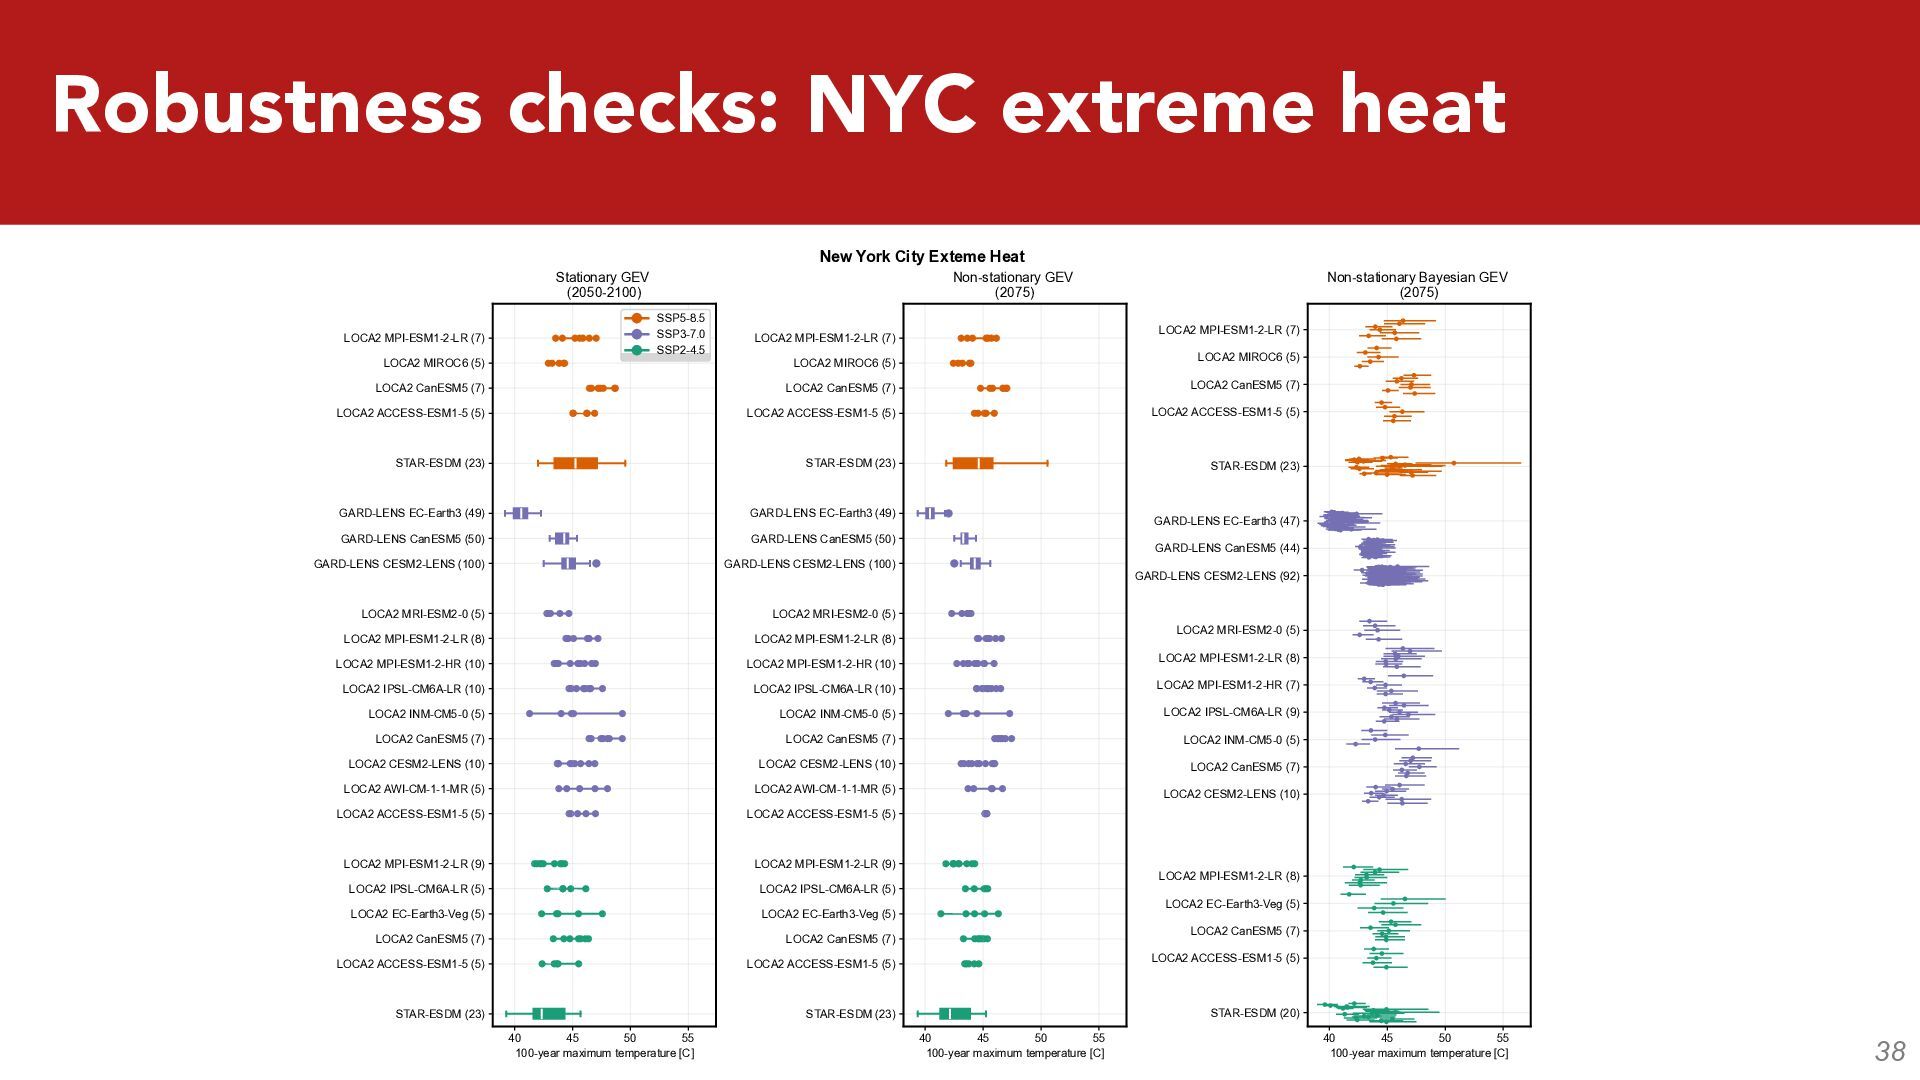
14 Downscaled Ensemble No. of GCMs Spatial res. Initial condition sampling Emissions scenarios Training data Total outputs GARD-LENS 3 12.5 km EC-Earth3 (50 members) CanESM5 (50 members) CESM2-LENS (100 members) SSP3-7.0 GMET (1980-2014) 200 LOCA2 27 6 km Up to 10 members SSP2-4.5, SSP3-7.0, SSP5-8.5 Livneh (1950-2014) ~300 STAR-ESDM 24 ~5 km No SSP2-4.5, SSP5-8.5 NClimGrid (1951-2001) 48 Hartke et al. (2024), GARD-LENS: A downscaled large ensemble dataset for understanding future climate and its uncertainties. Sci. Data Pierce et al. (2023), Future Increases in North American Extreme Precipitation in CMIP6 Downscaled with LOCA. J. Hydrometeor Hayhoe et al. (2024), STAR-ESDM: A generalizable approach to generating high-resolution climate projections through signal decomposition. Earth's Future
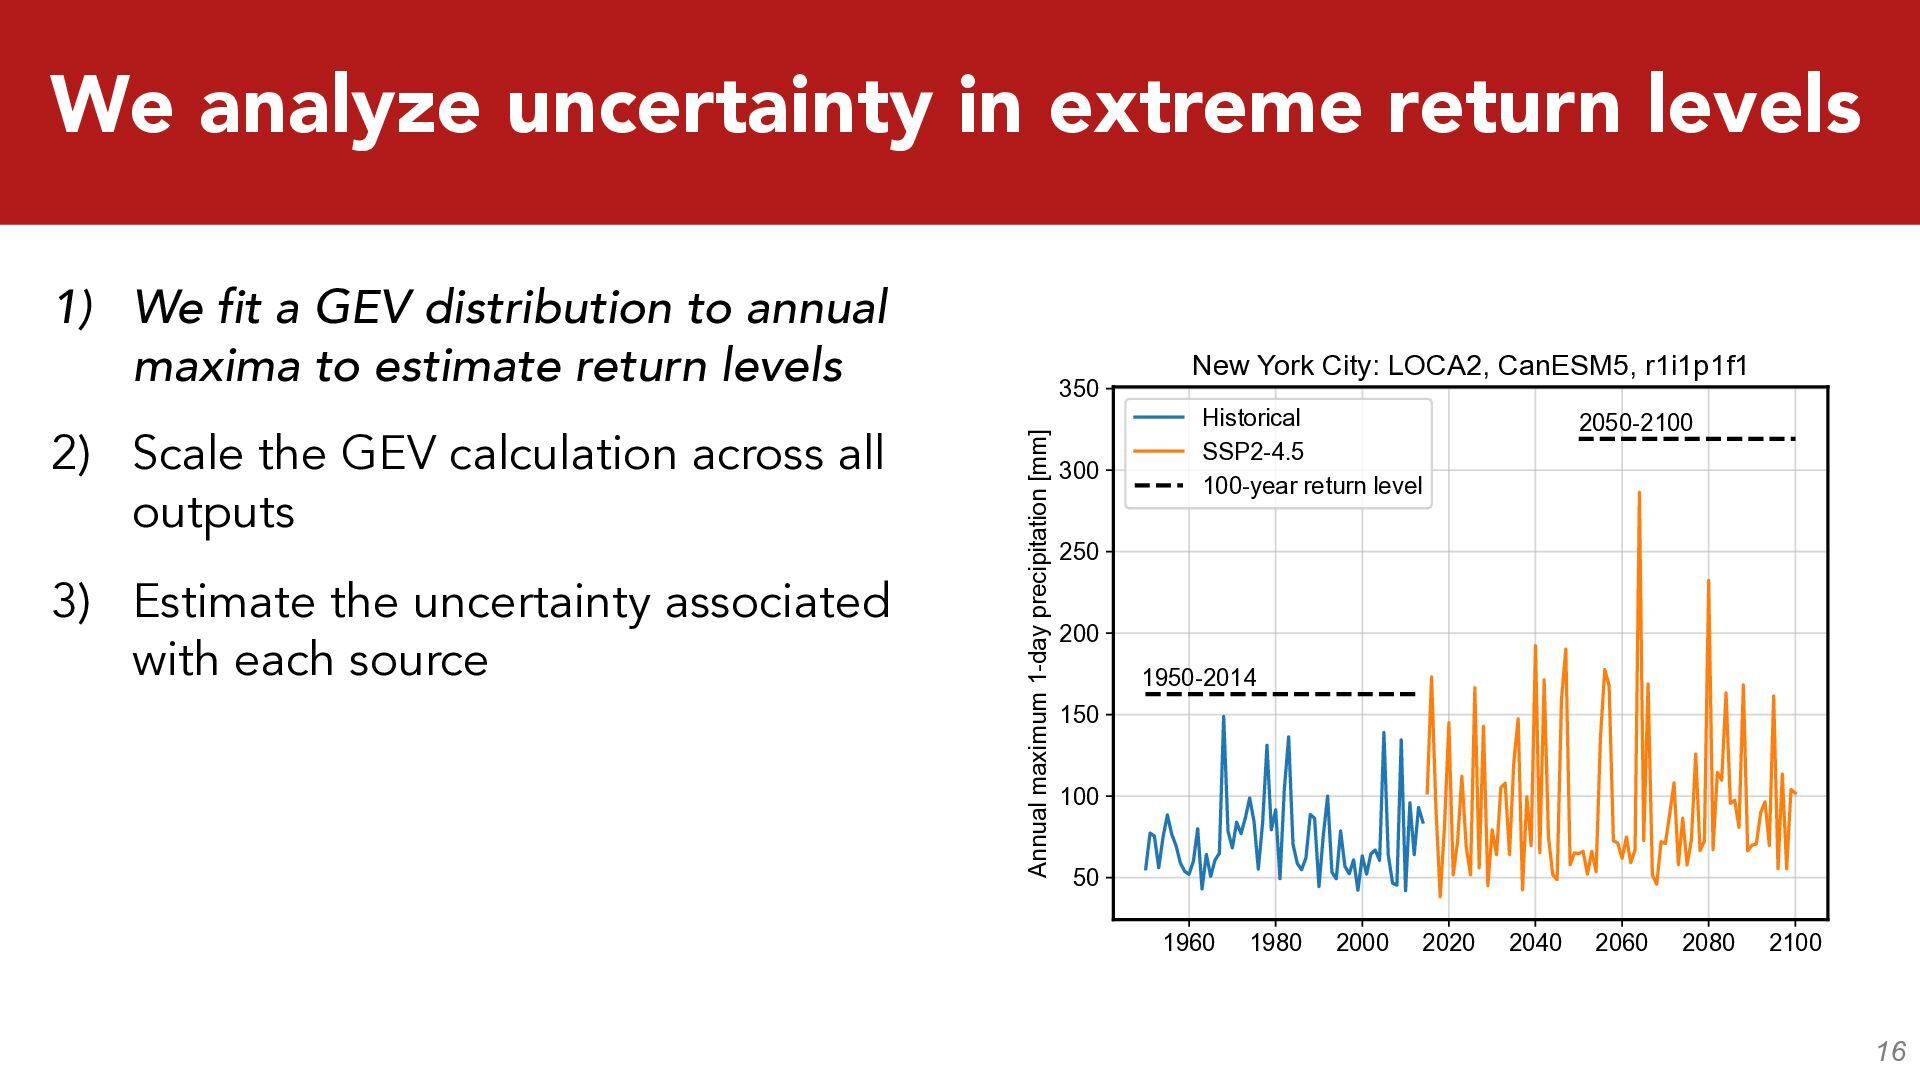
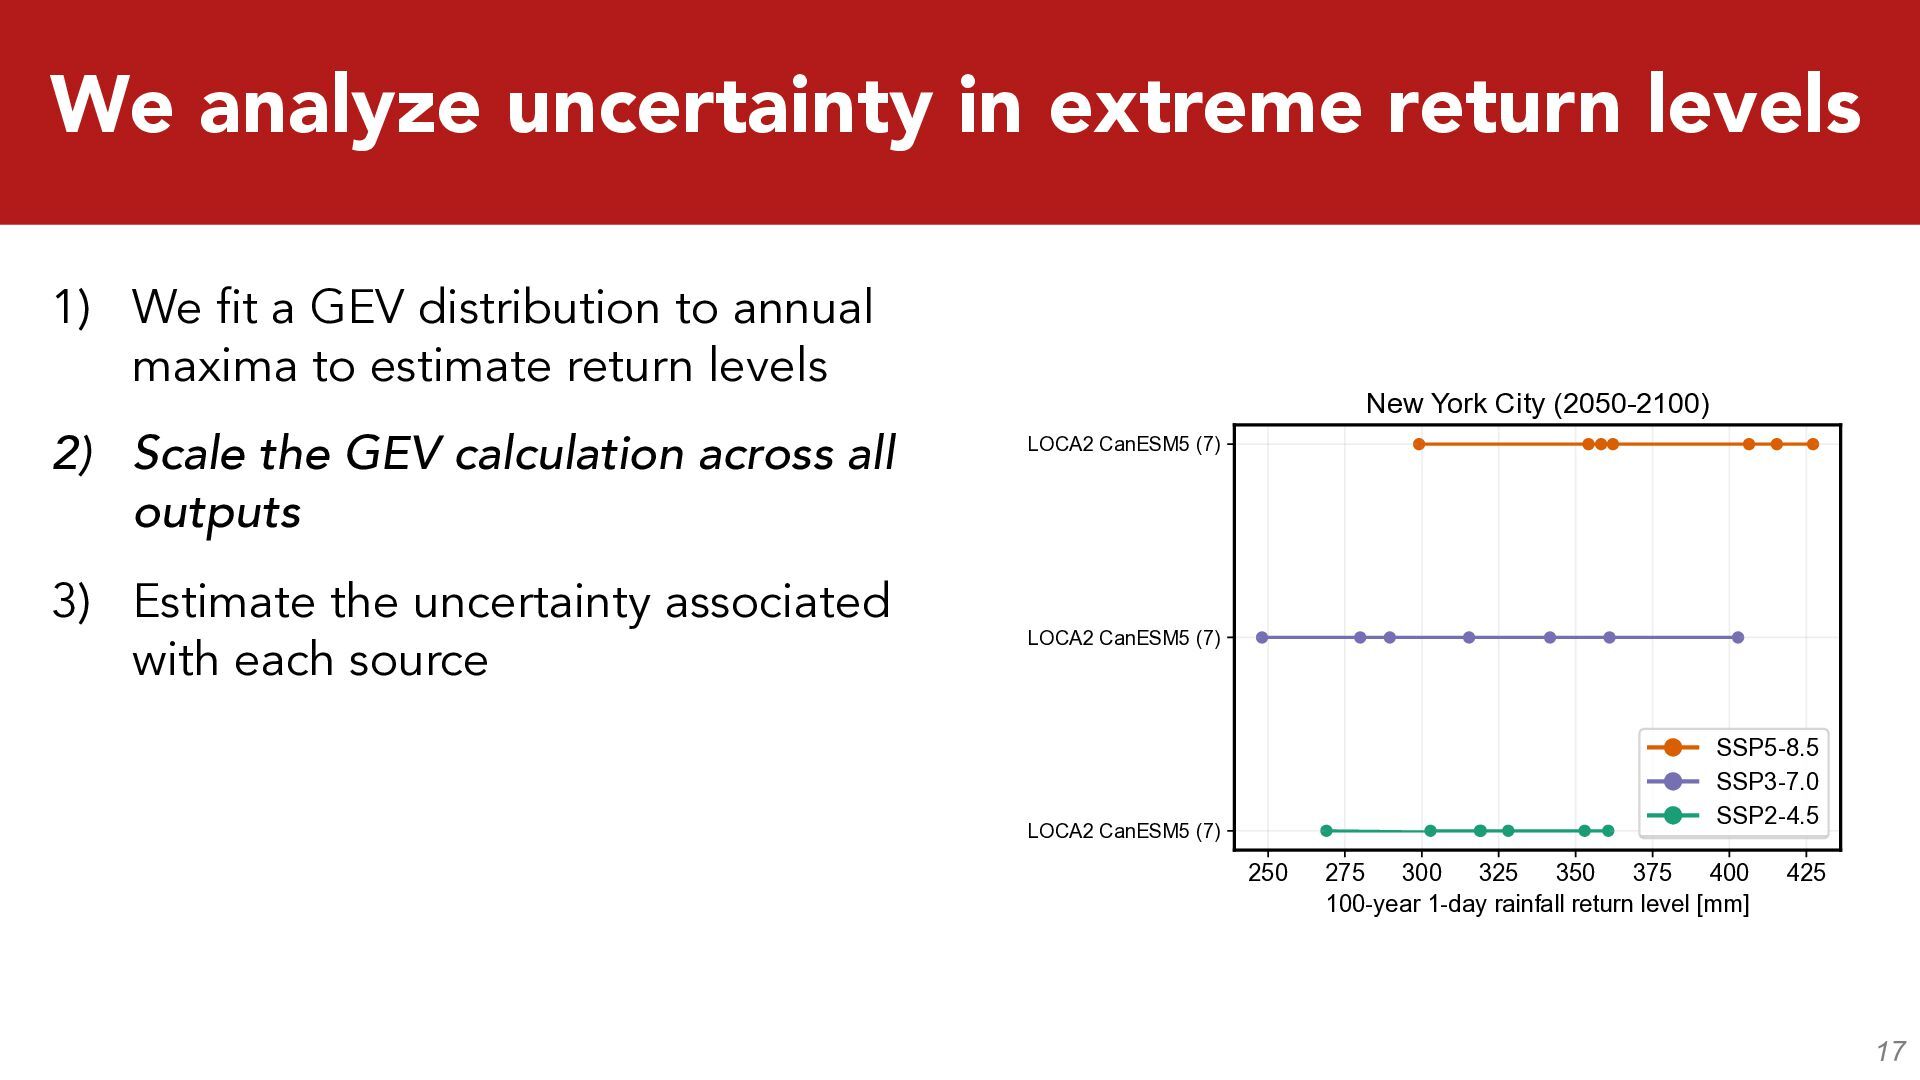
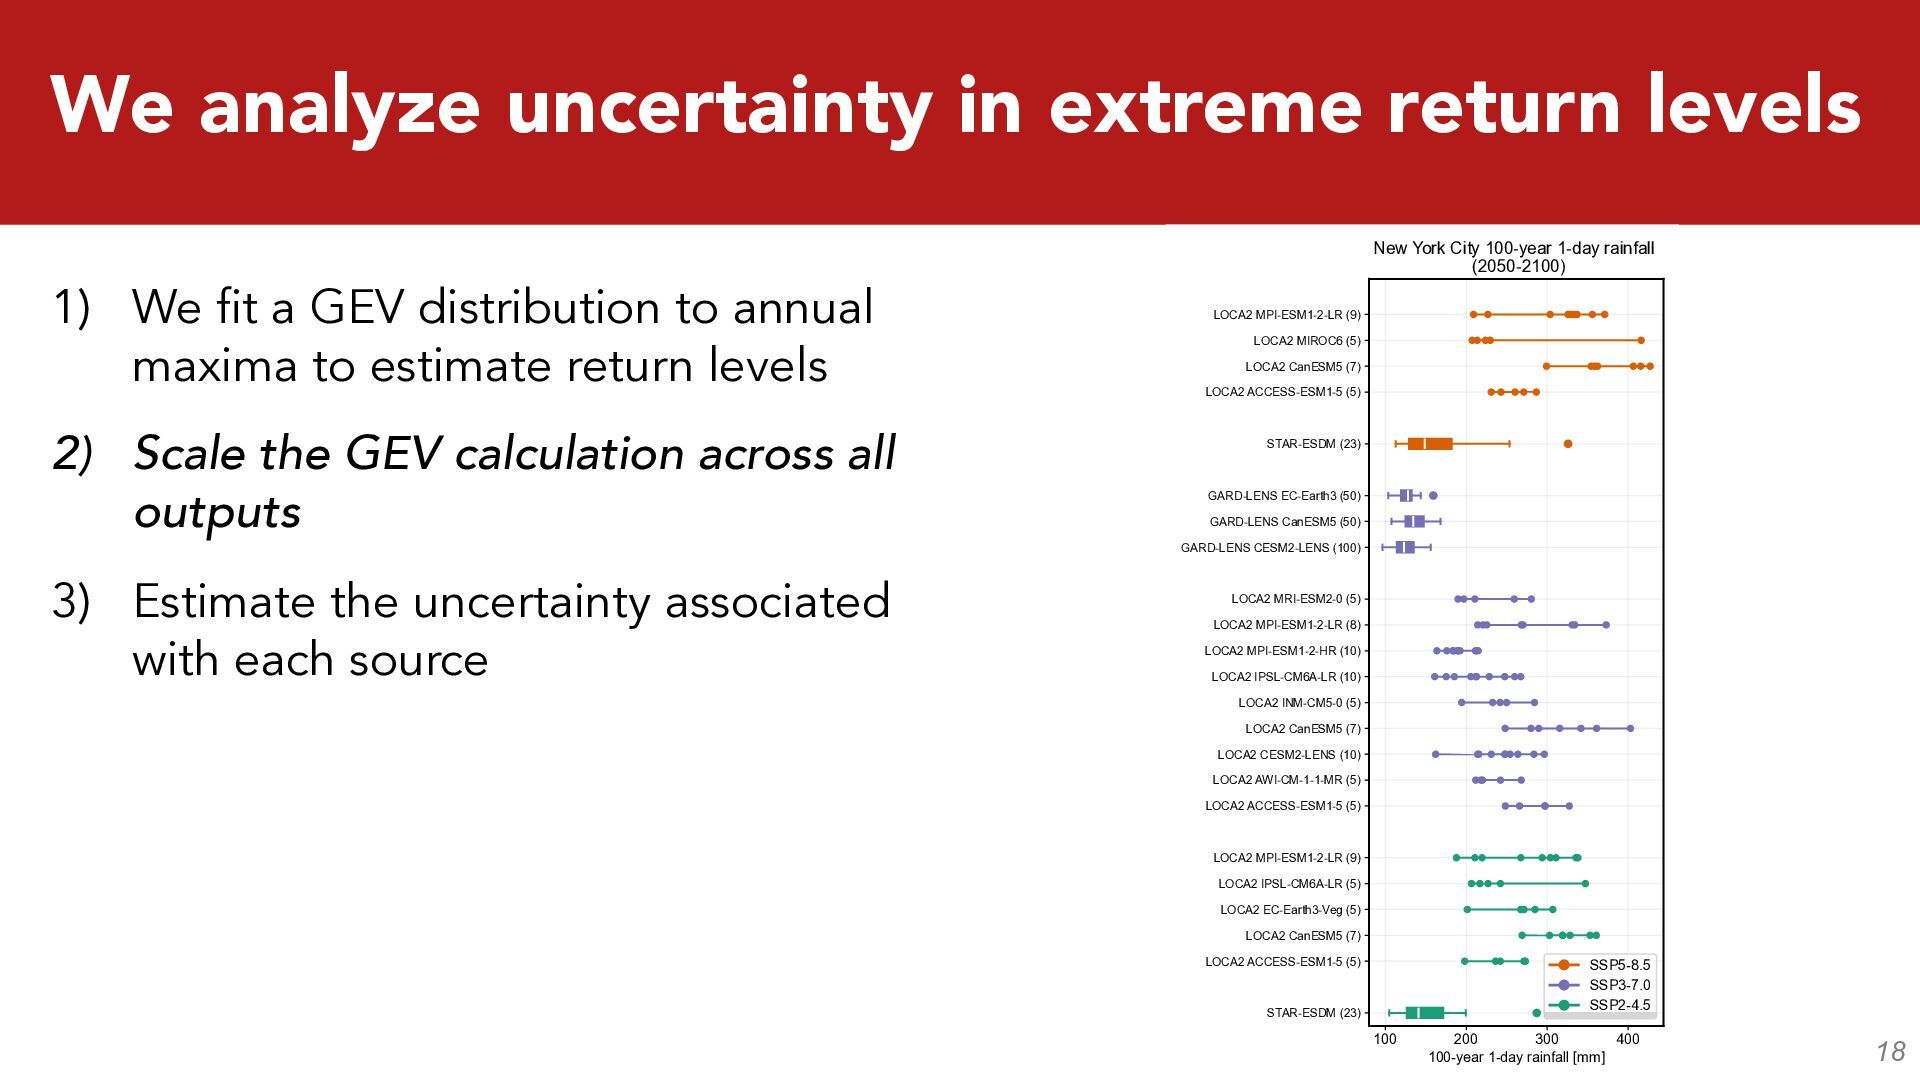
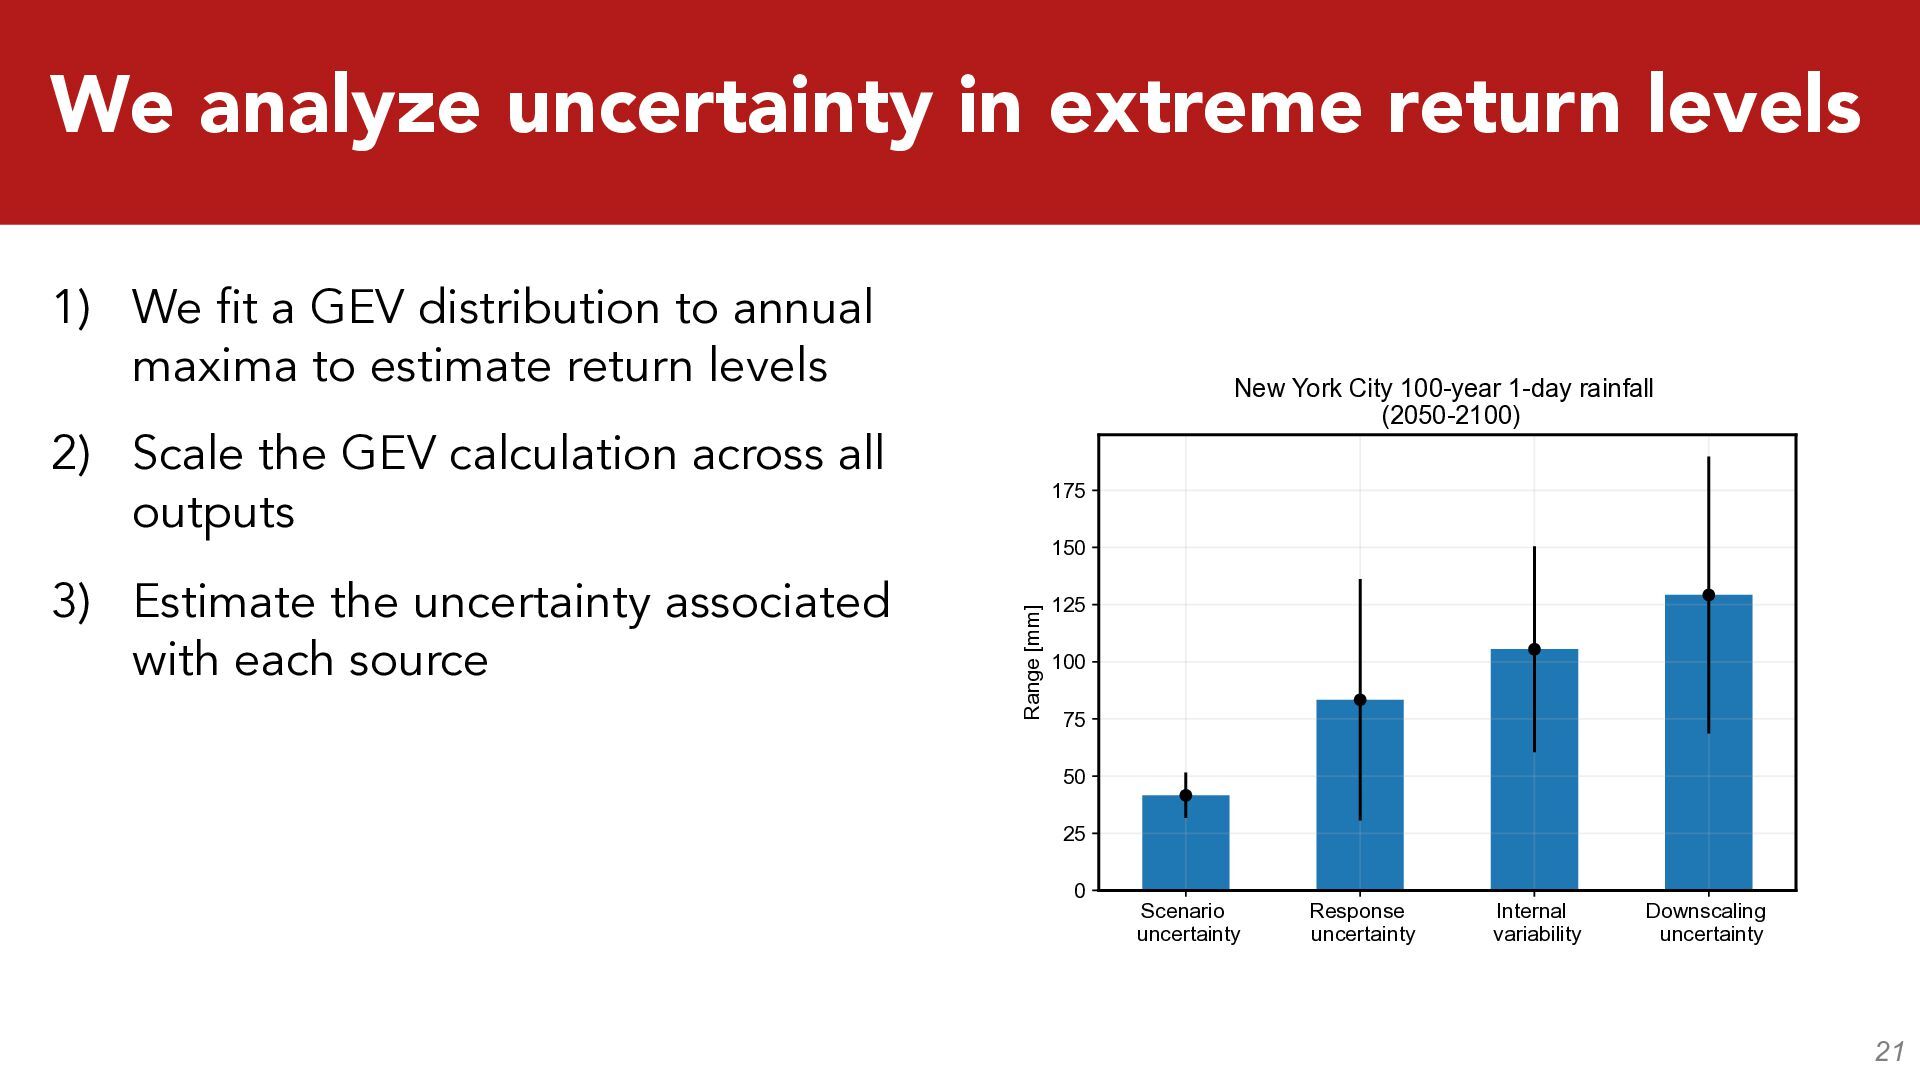
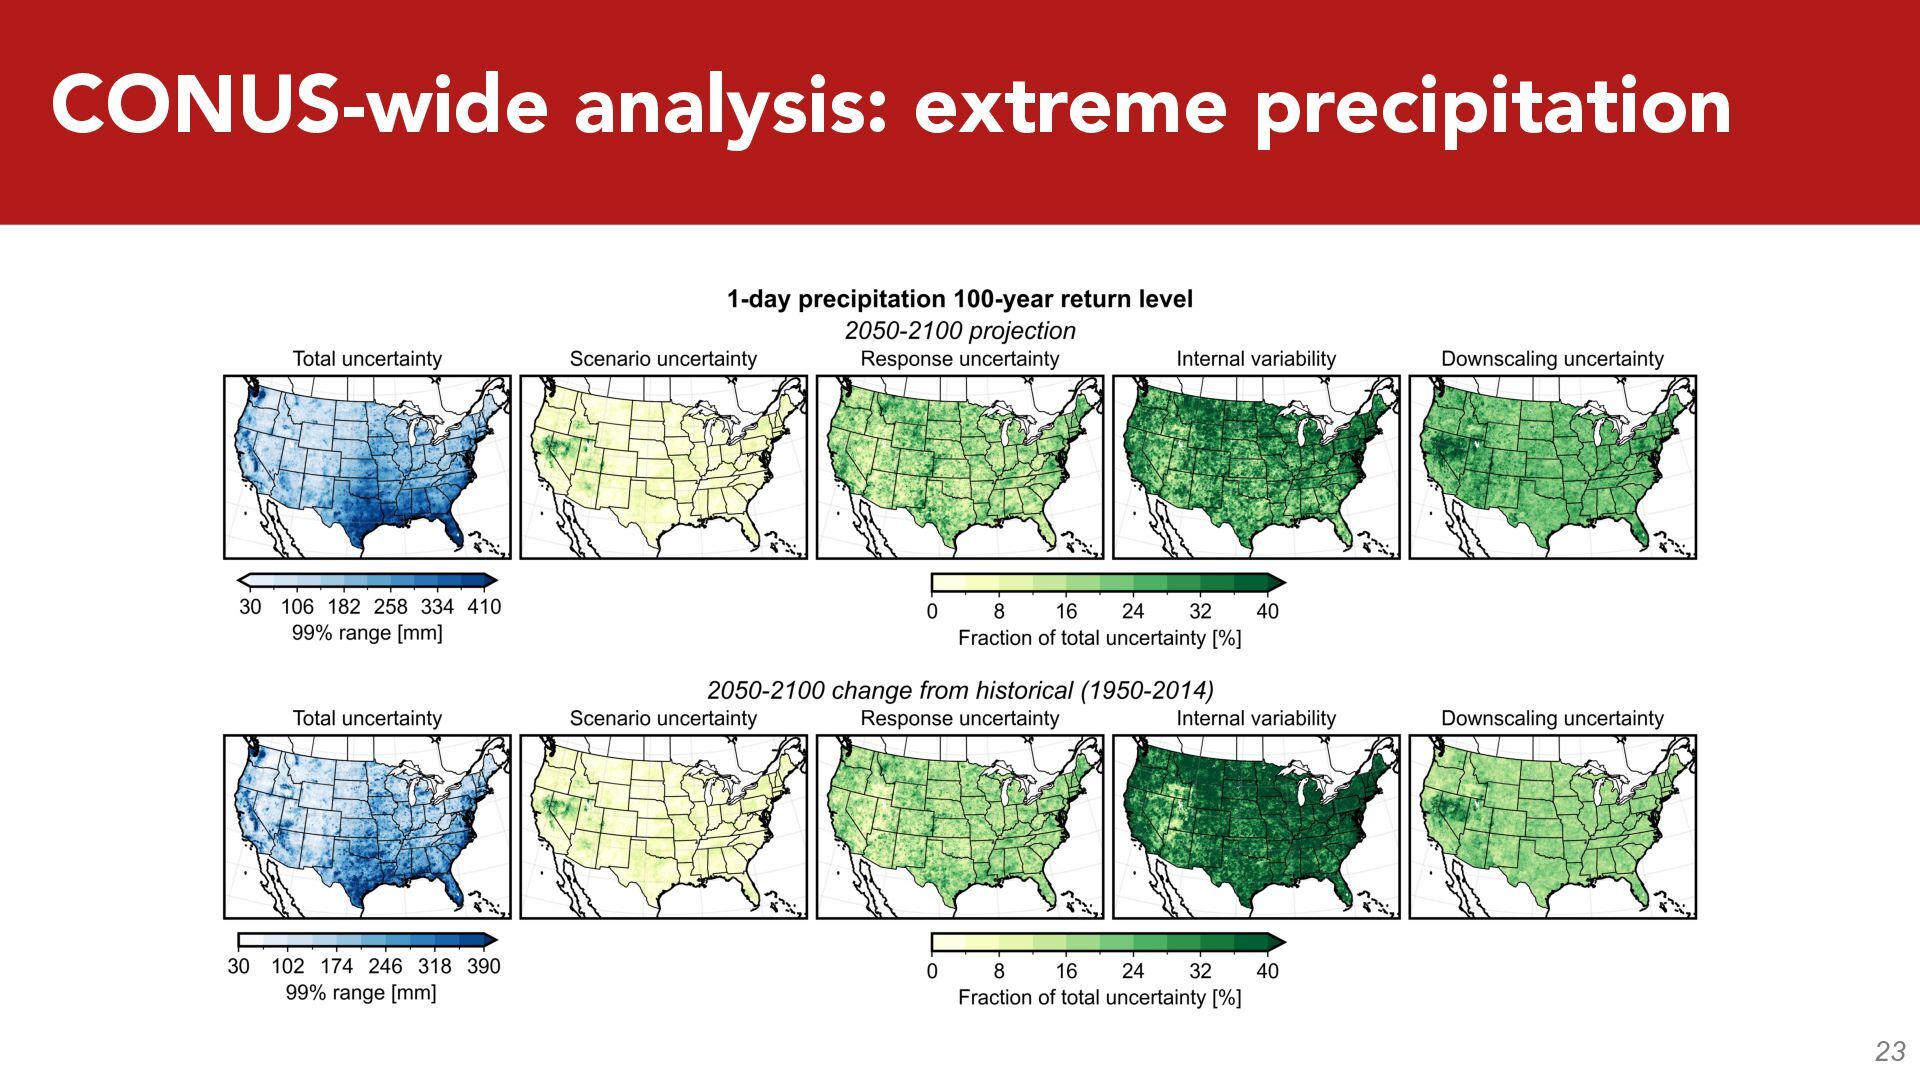
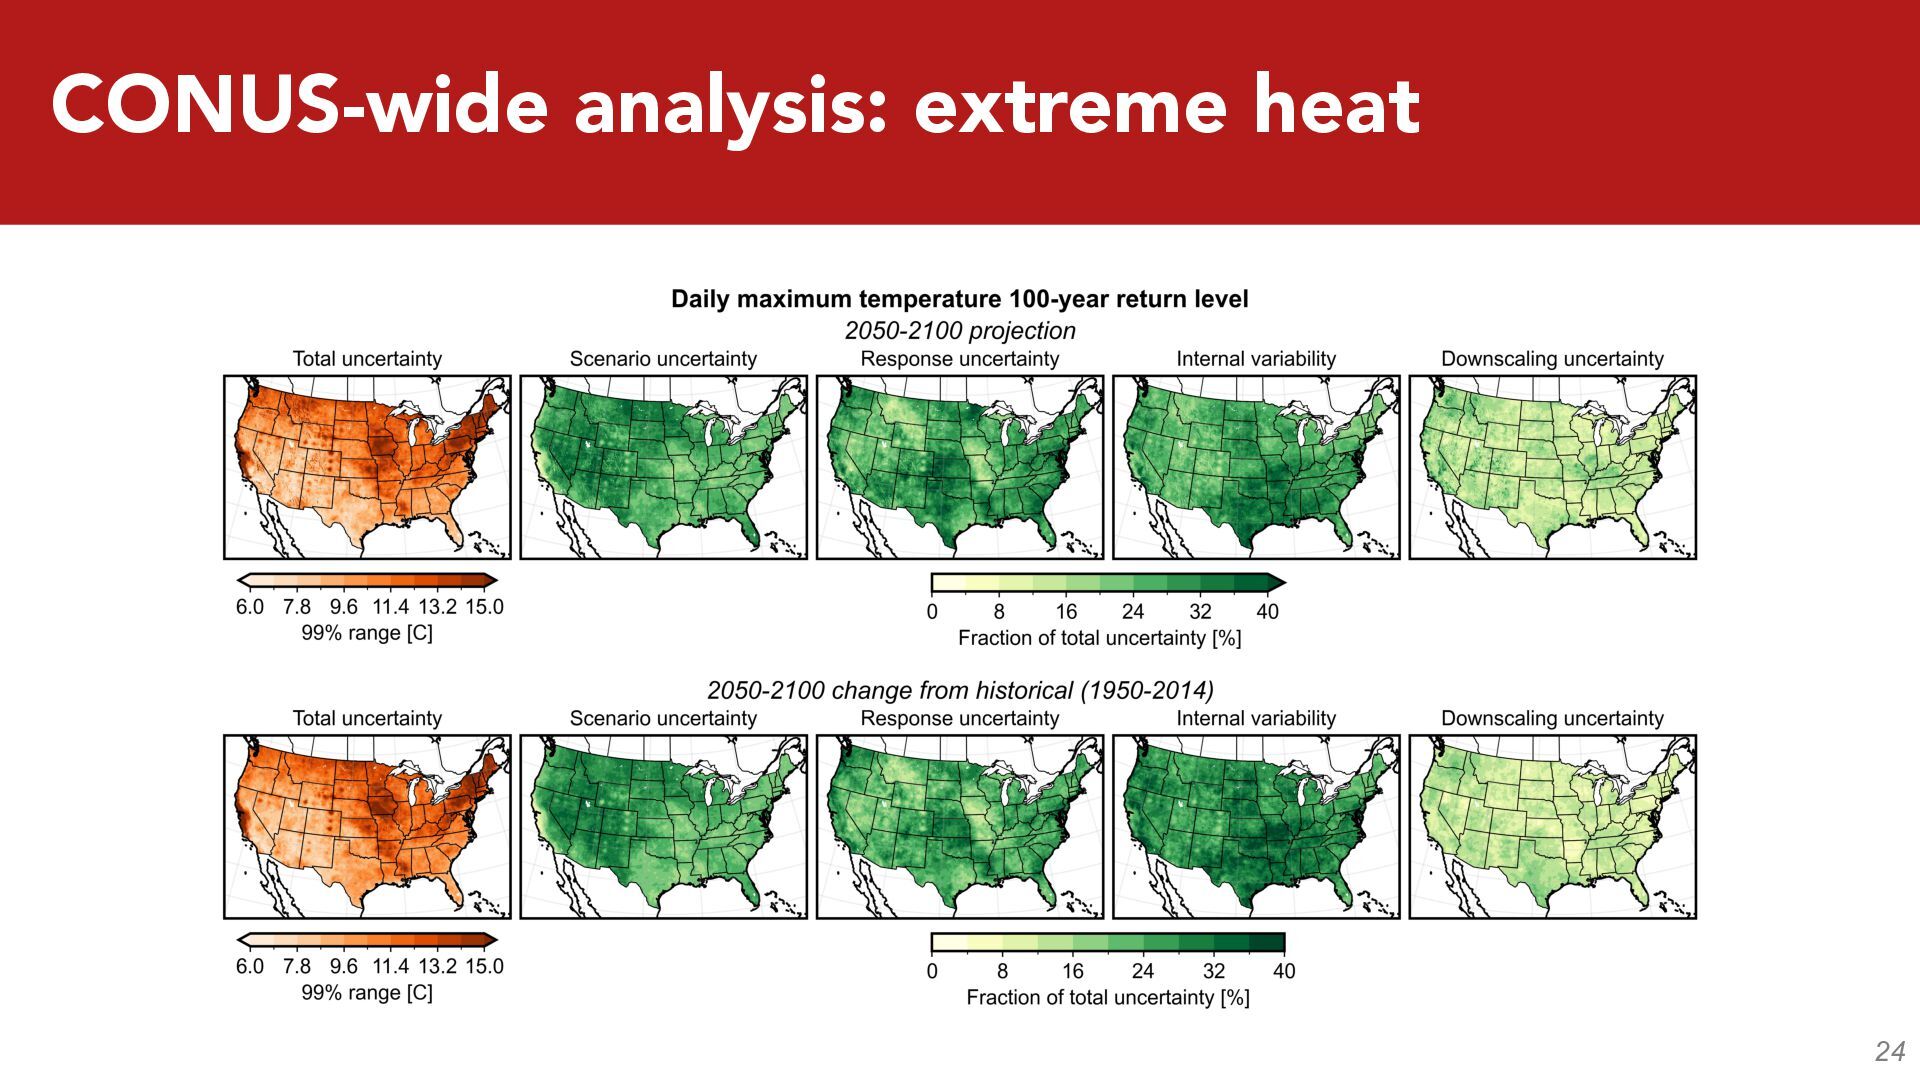
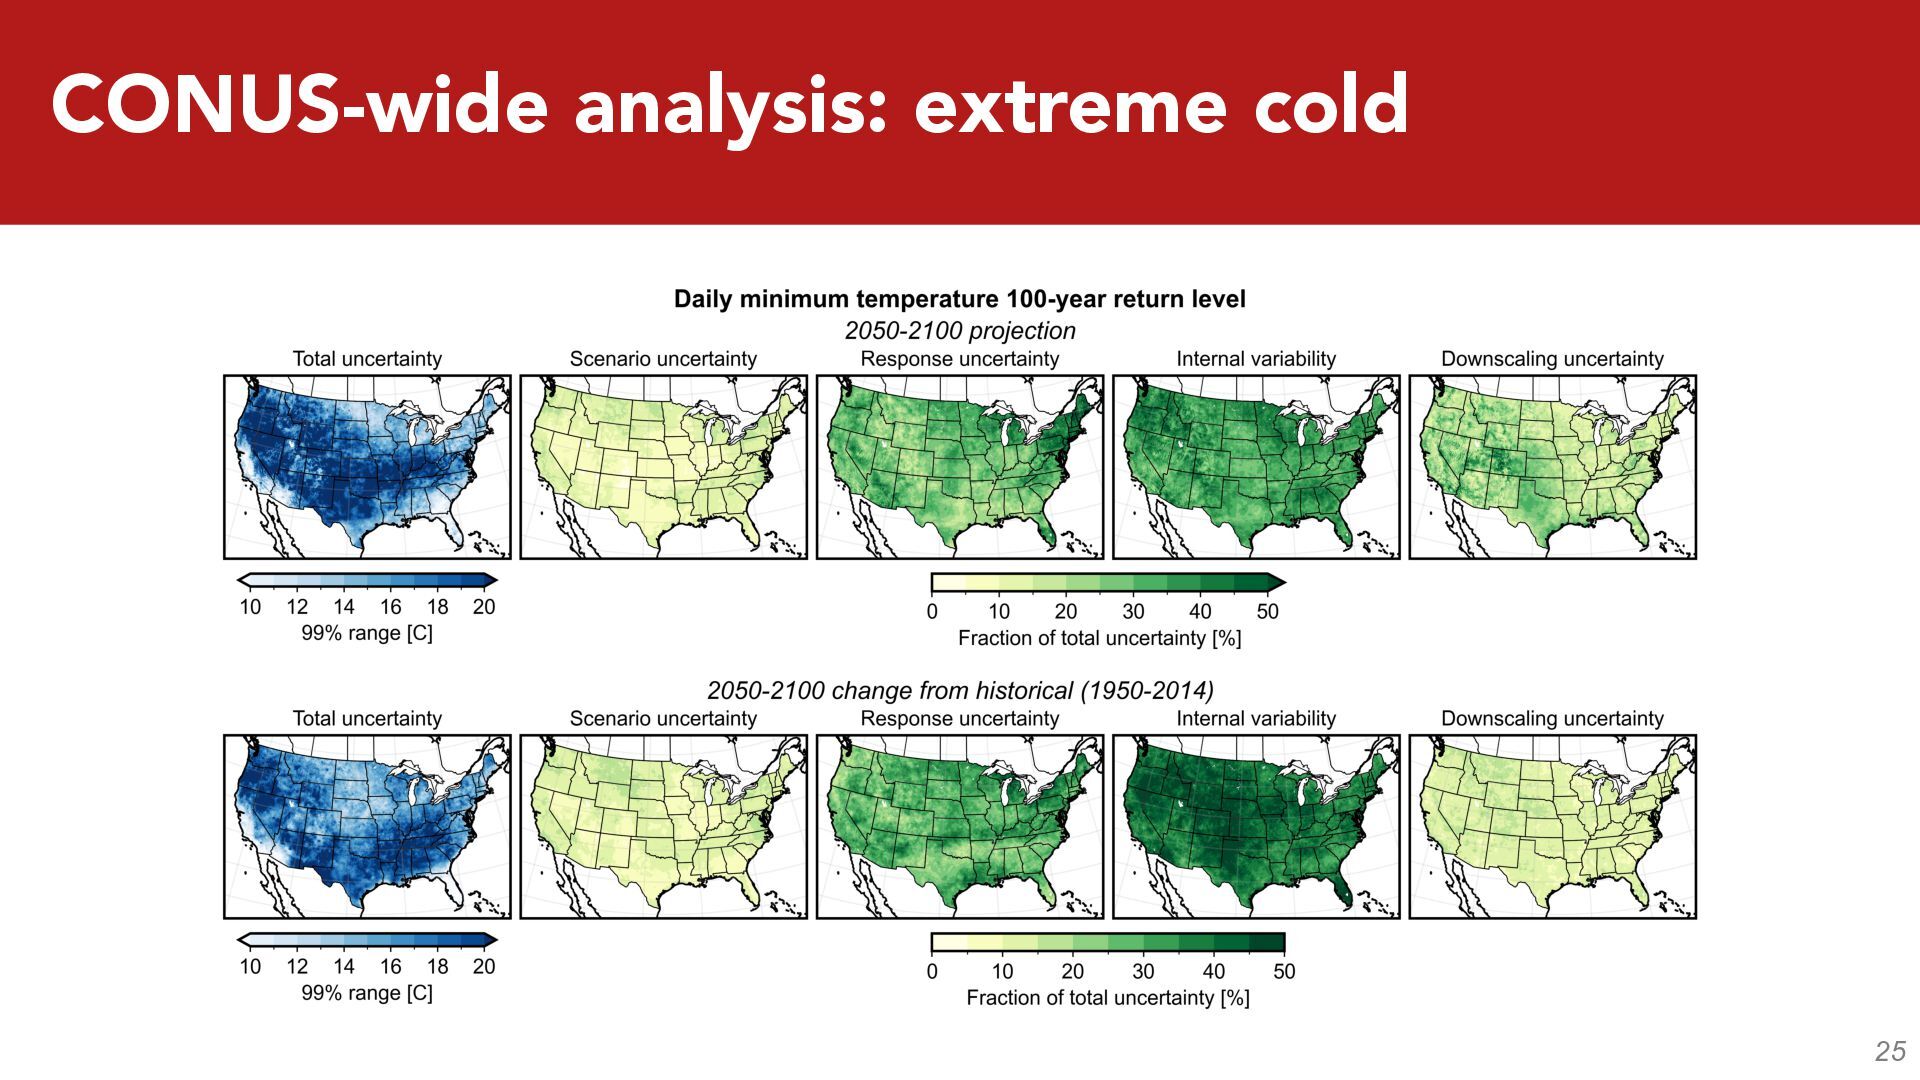
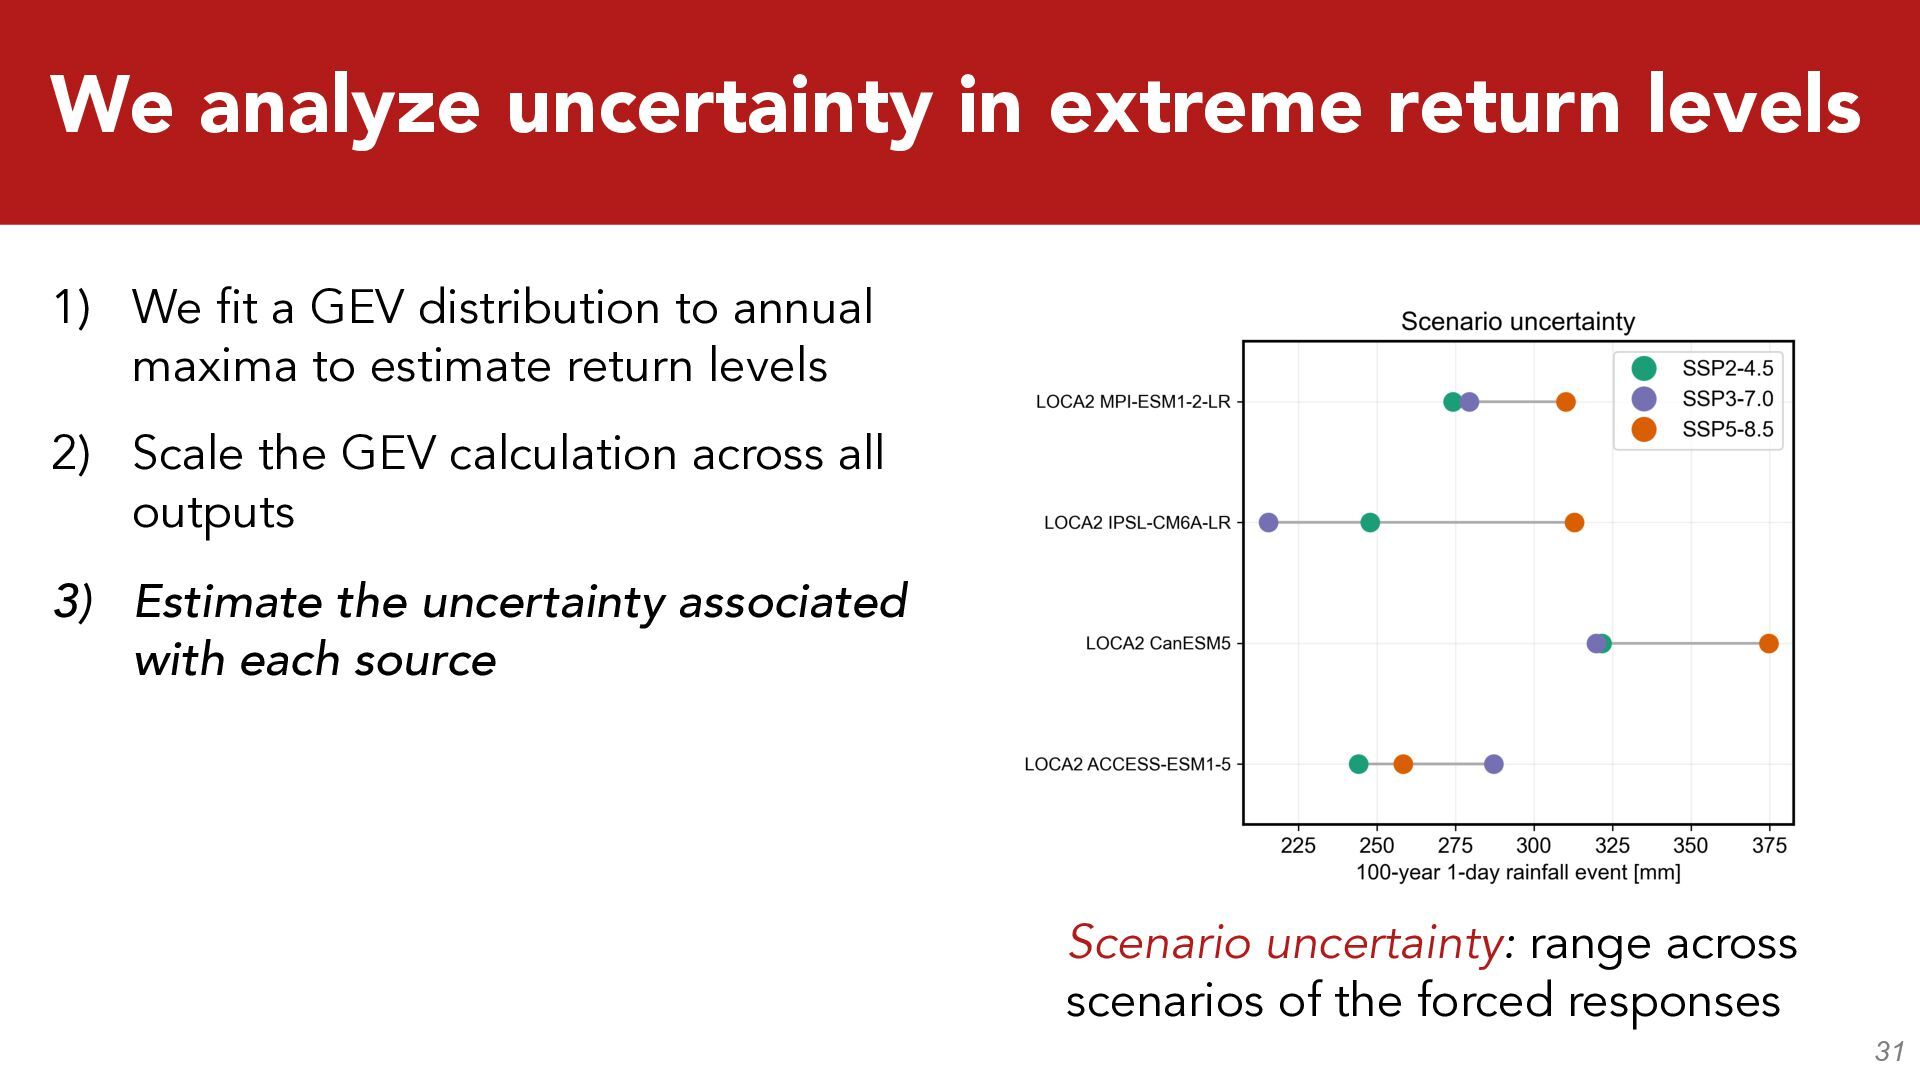
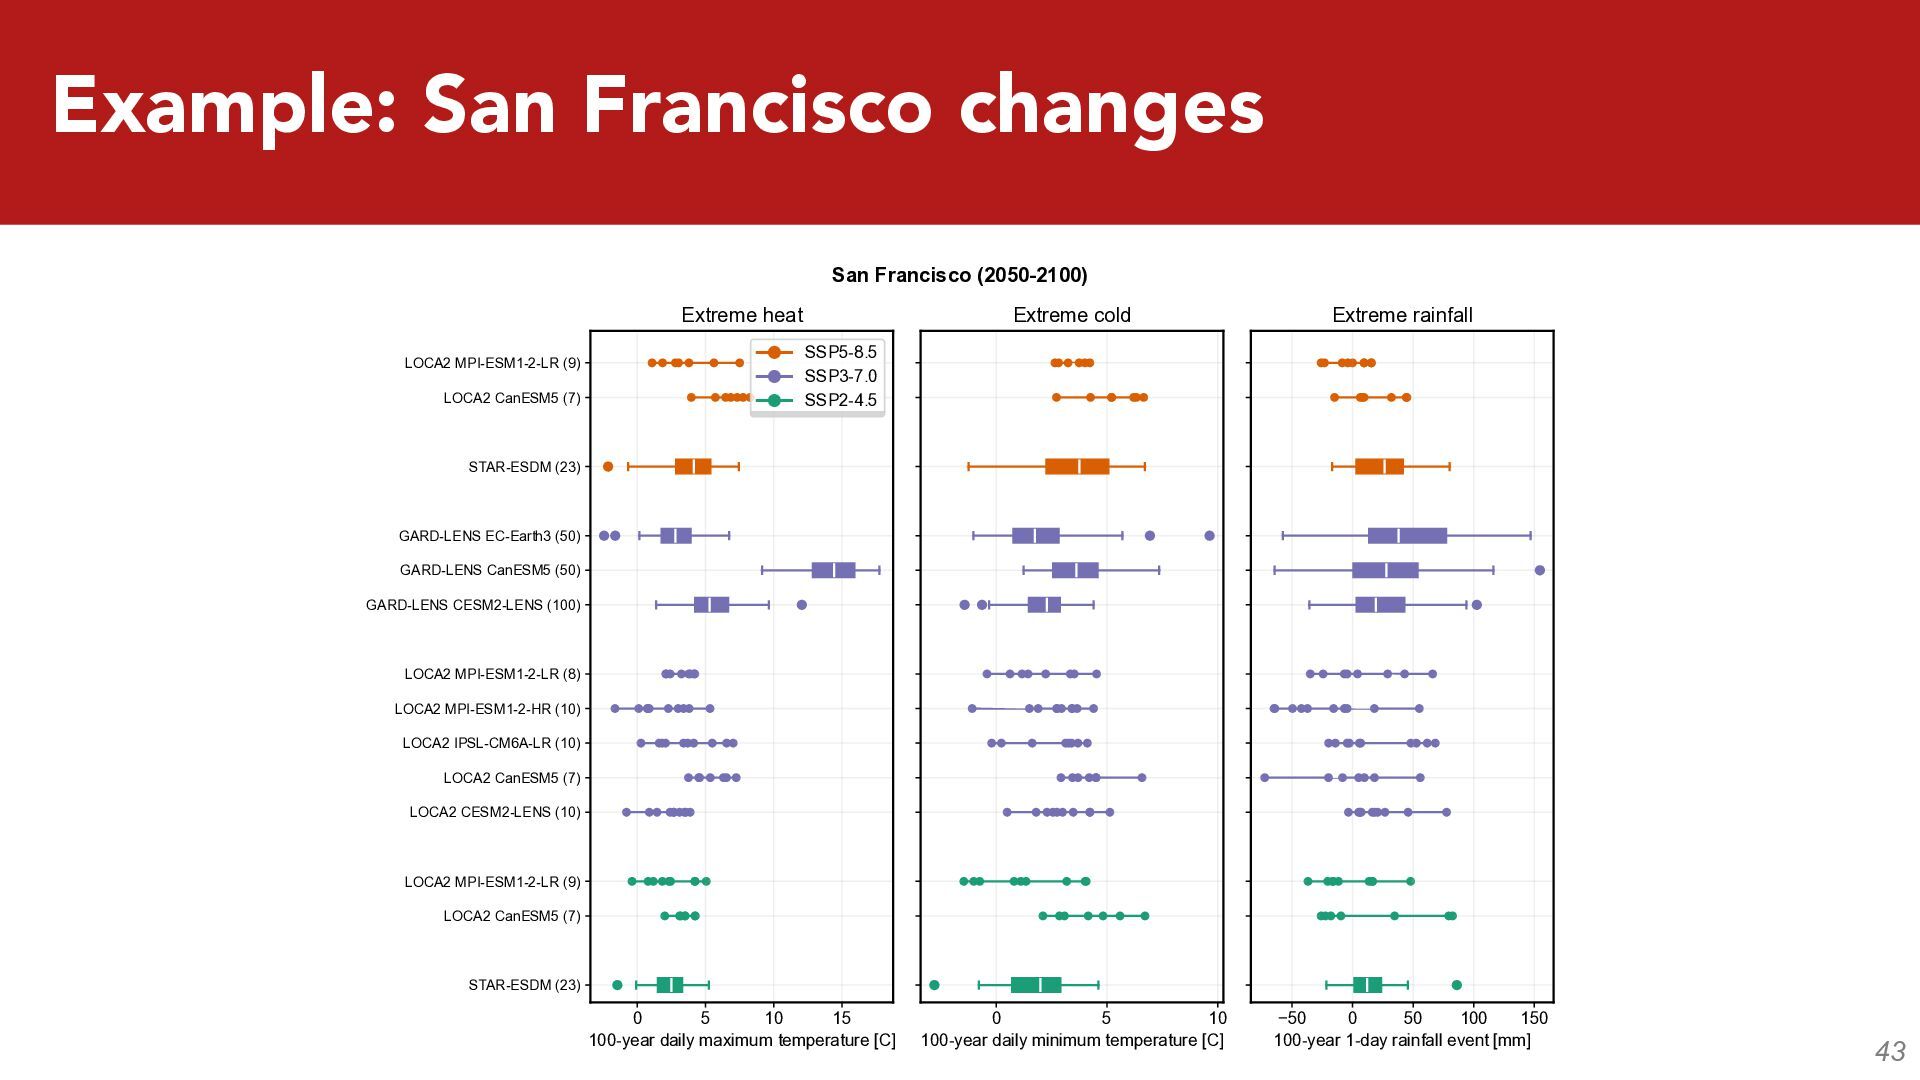
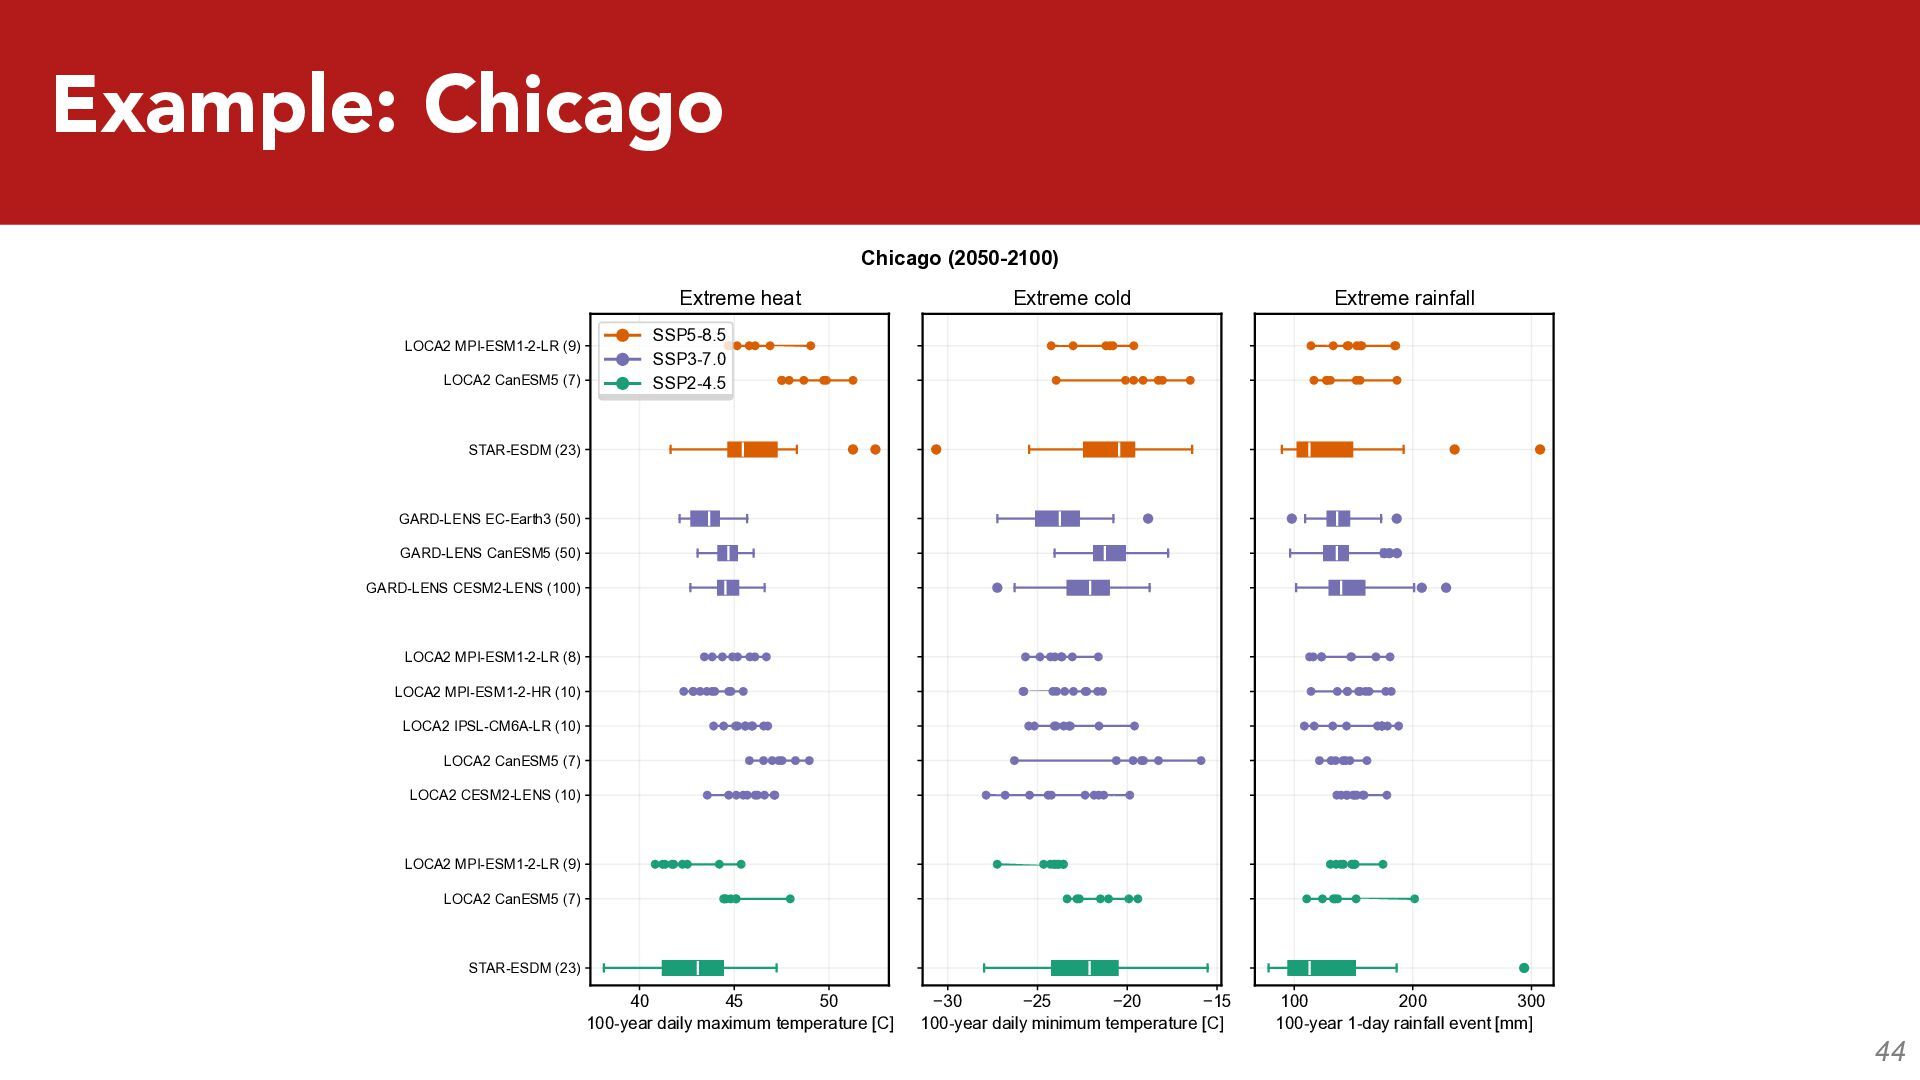
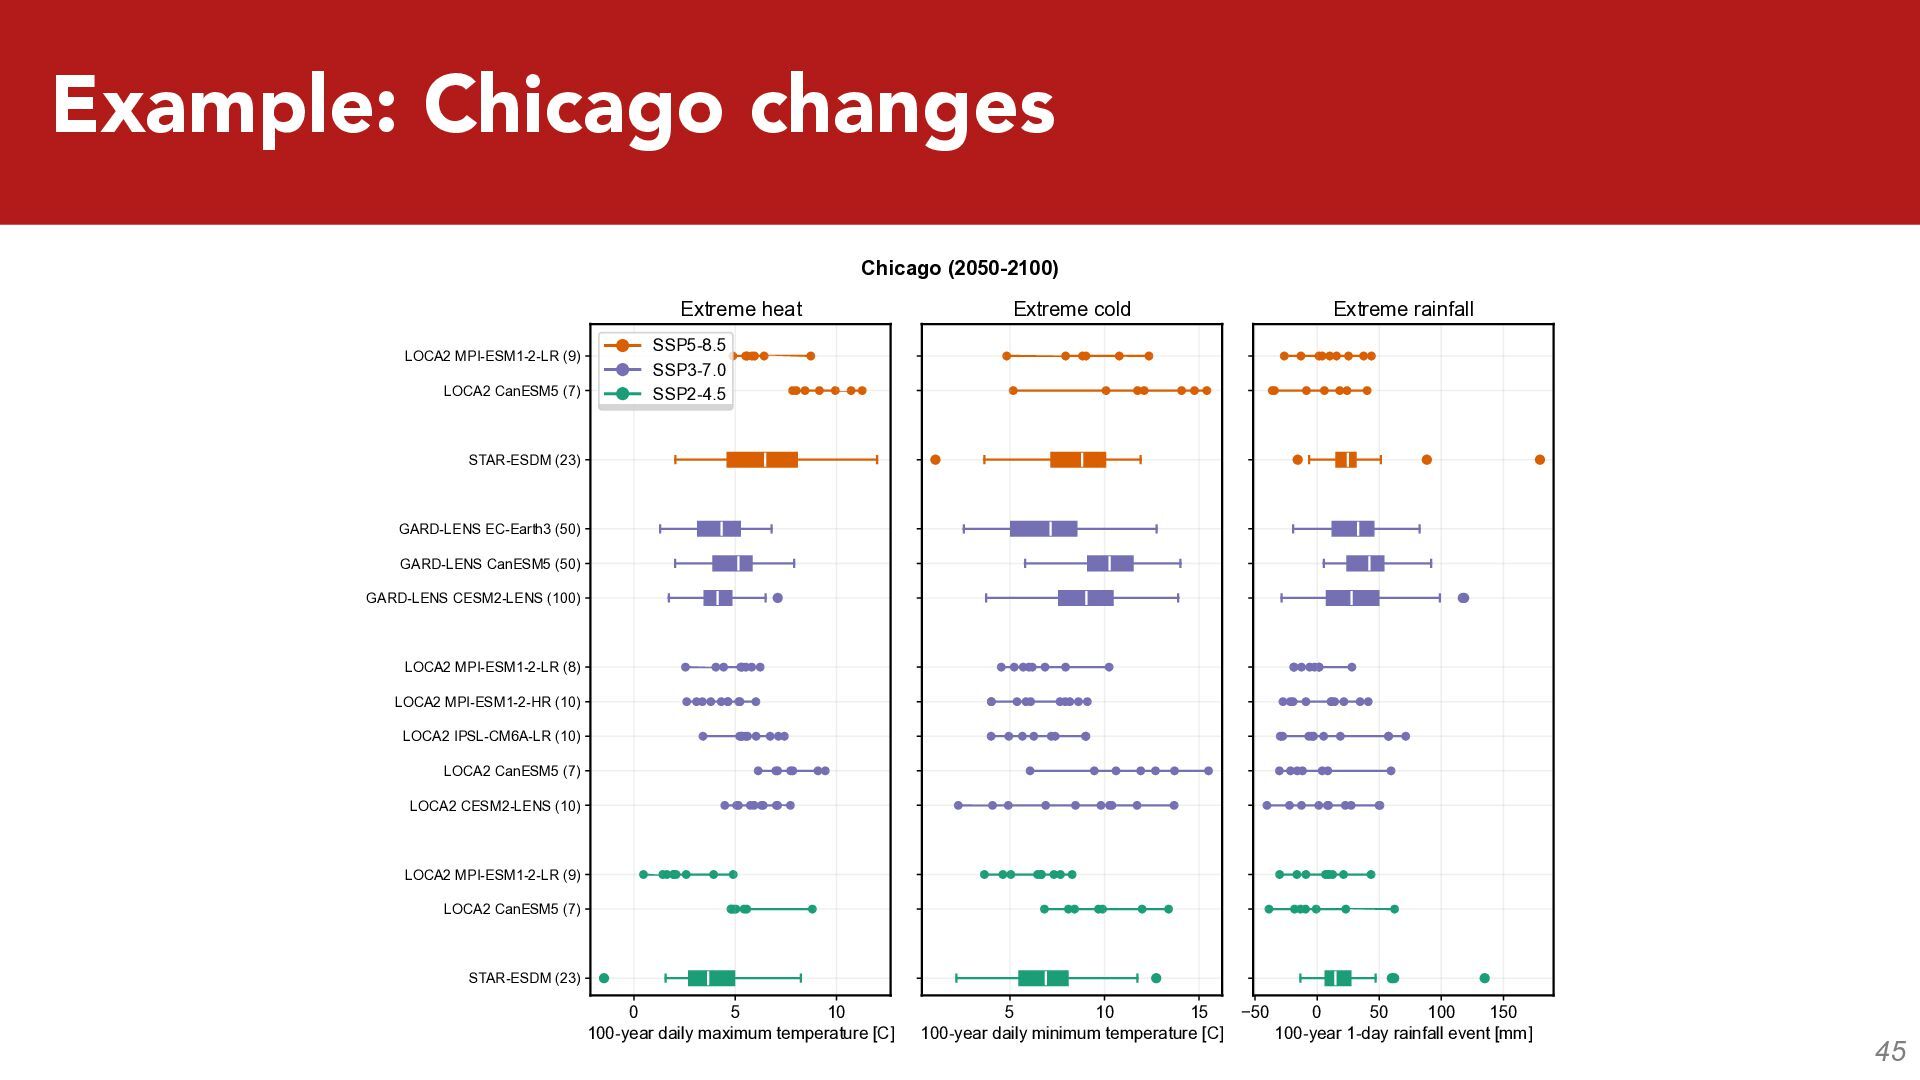
fit a GEV distribution to annual maxima to estimate return levels 2) Scale the GEV calculation across all outputs 3) Estimate the uncertainty associated with each source
- 1 , , ,1 , 1 ,- . 1) We fit a GEV distribution to annual maxima to estimate return levels 2) Scale the GEV calculation across all outputs 3) Estimate the uncertainty associated with each source
fit a GEV distribution to annual maxima to estimate return levels 2) Scale the GEV calculation across all outputs 3) Estimate the uncertainty associated with each source ( )
fit a GEV distribution to annual maxima to estimate return levels 2) Scale the GEV calculation across all outputs 3) Estimate the uncertainty associated with each source 5( 2 5 2 0) .. 0 23 ( 0 0 23 0 (4 12- 35 5( 2 5 2 0) ..
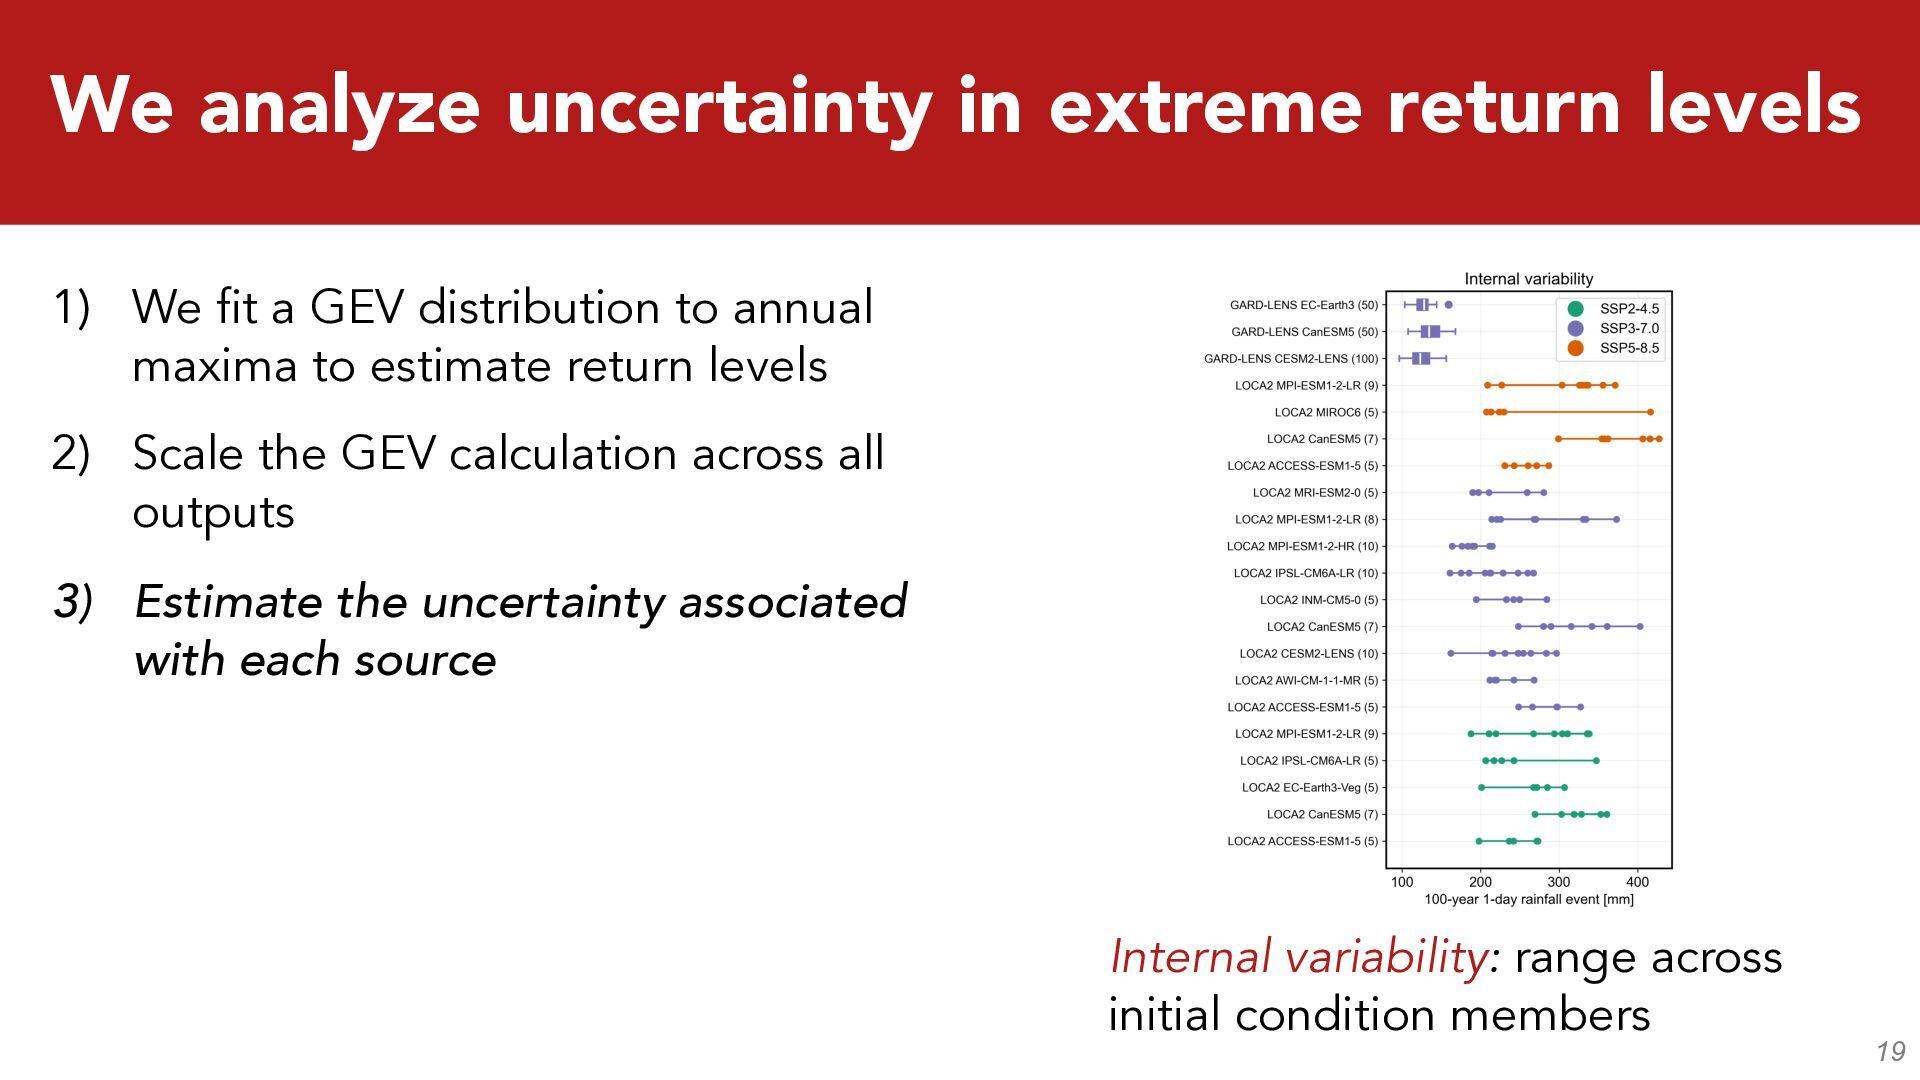
fit a GEV distribution to annual maxima to estimate return levels 2) Scale the GEV calculation across all outputs 3) Estimate the uncertainty associated with each source Internal variability: range across initial condition members
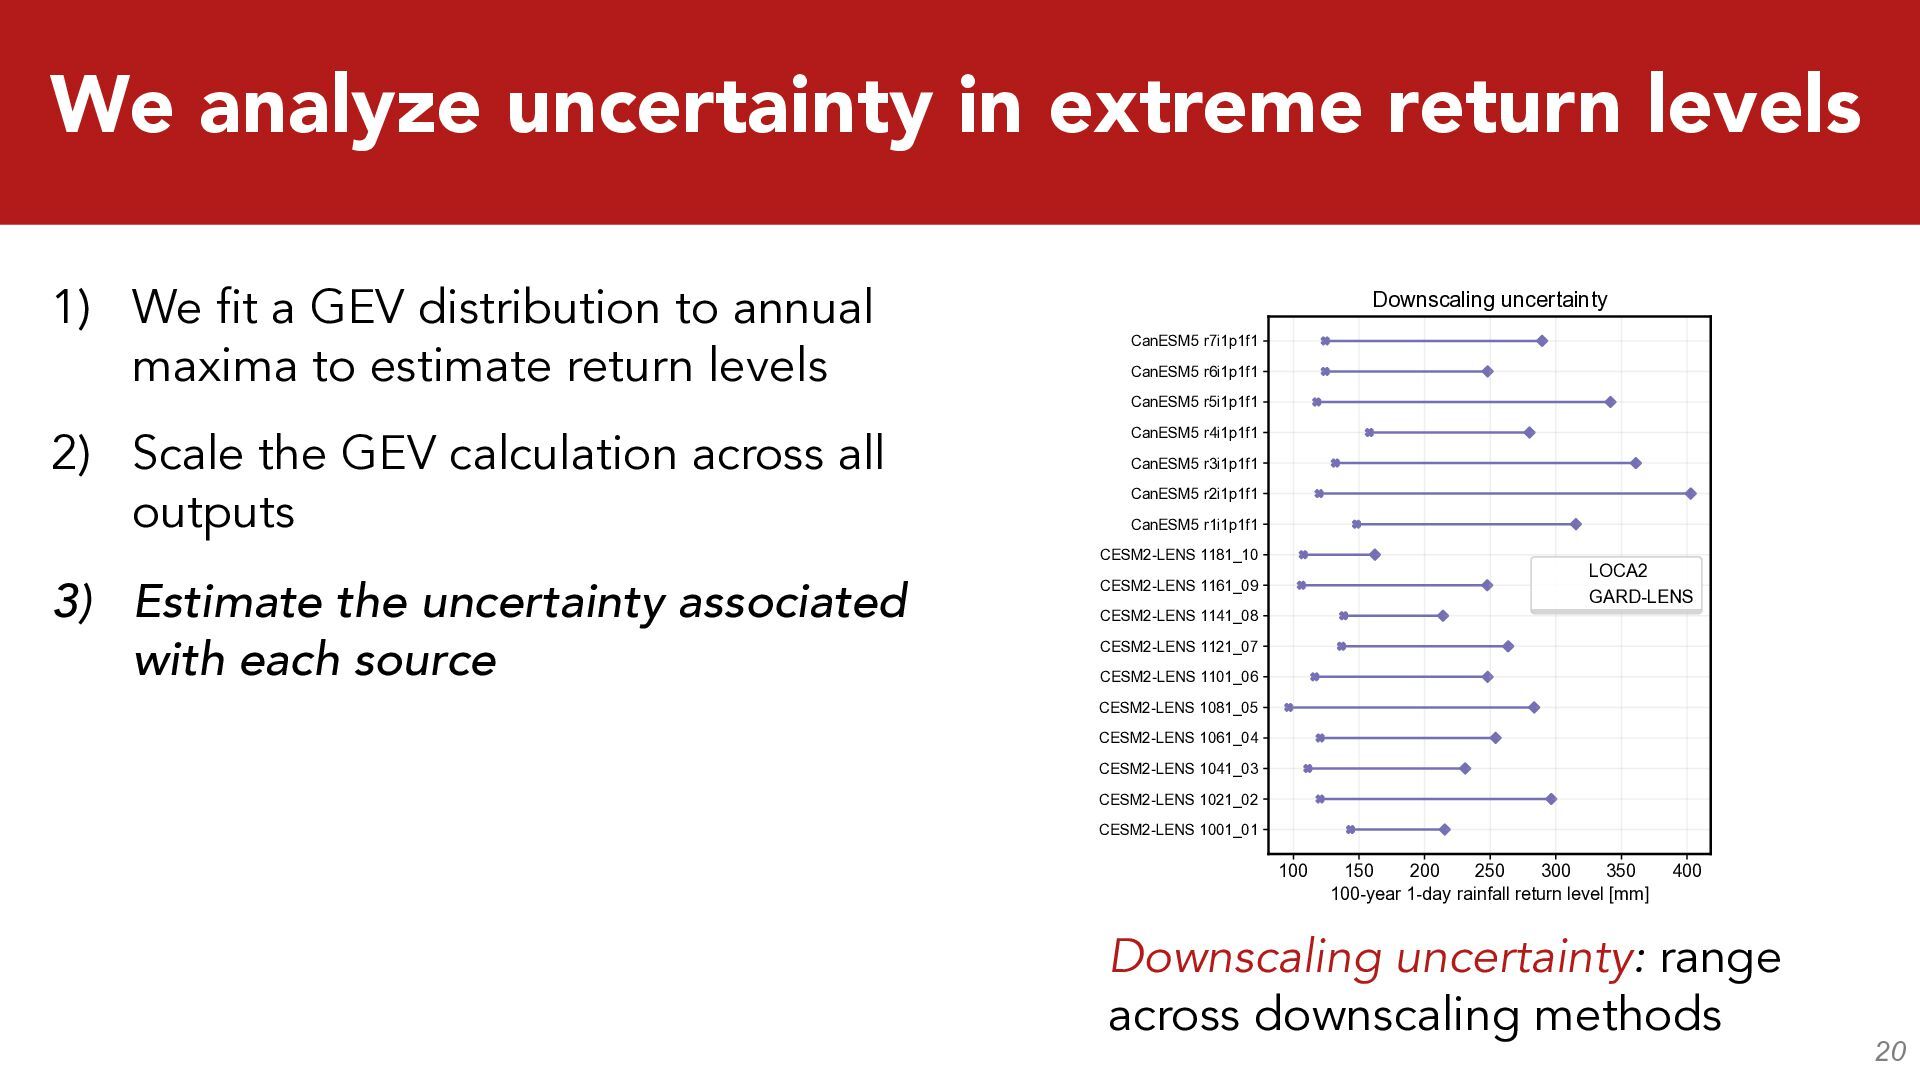
fit a GEV distribution to annual maxima to estimate return levels 2) Scale the GEV calculation across all outputs 3) Estimate the uncertainty associated with each source Downscaling uncertainty: range across downscaling methods -
fit a GEV distribution to annual maxima to estimate return levels 2) Scale the GEV calculation across all outputs 3) Estimate the uncertainty associated with each source ) ) ) ( ) ( ) ) )
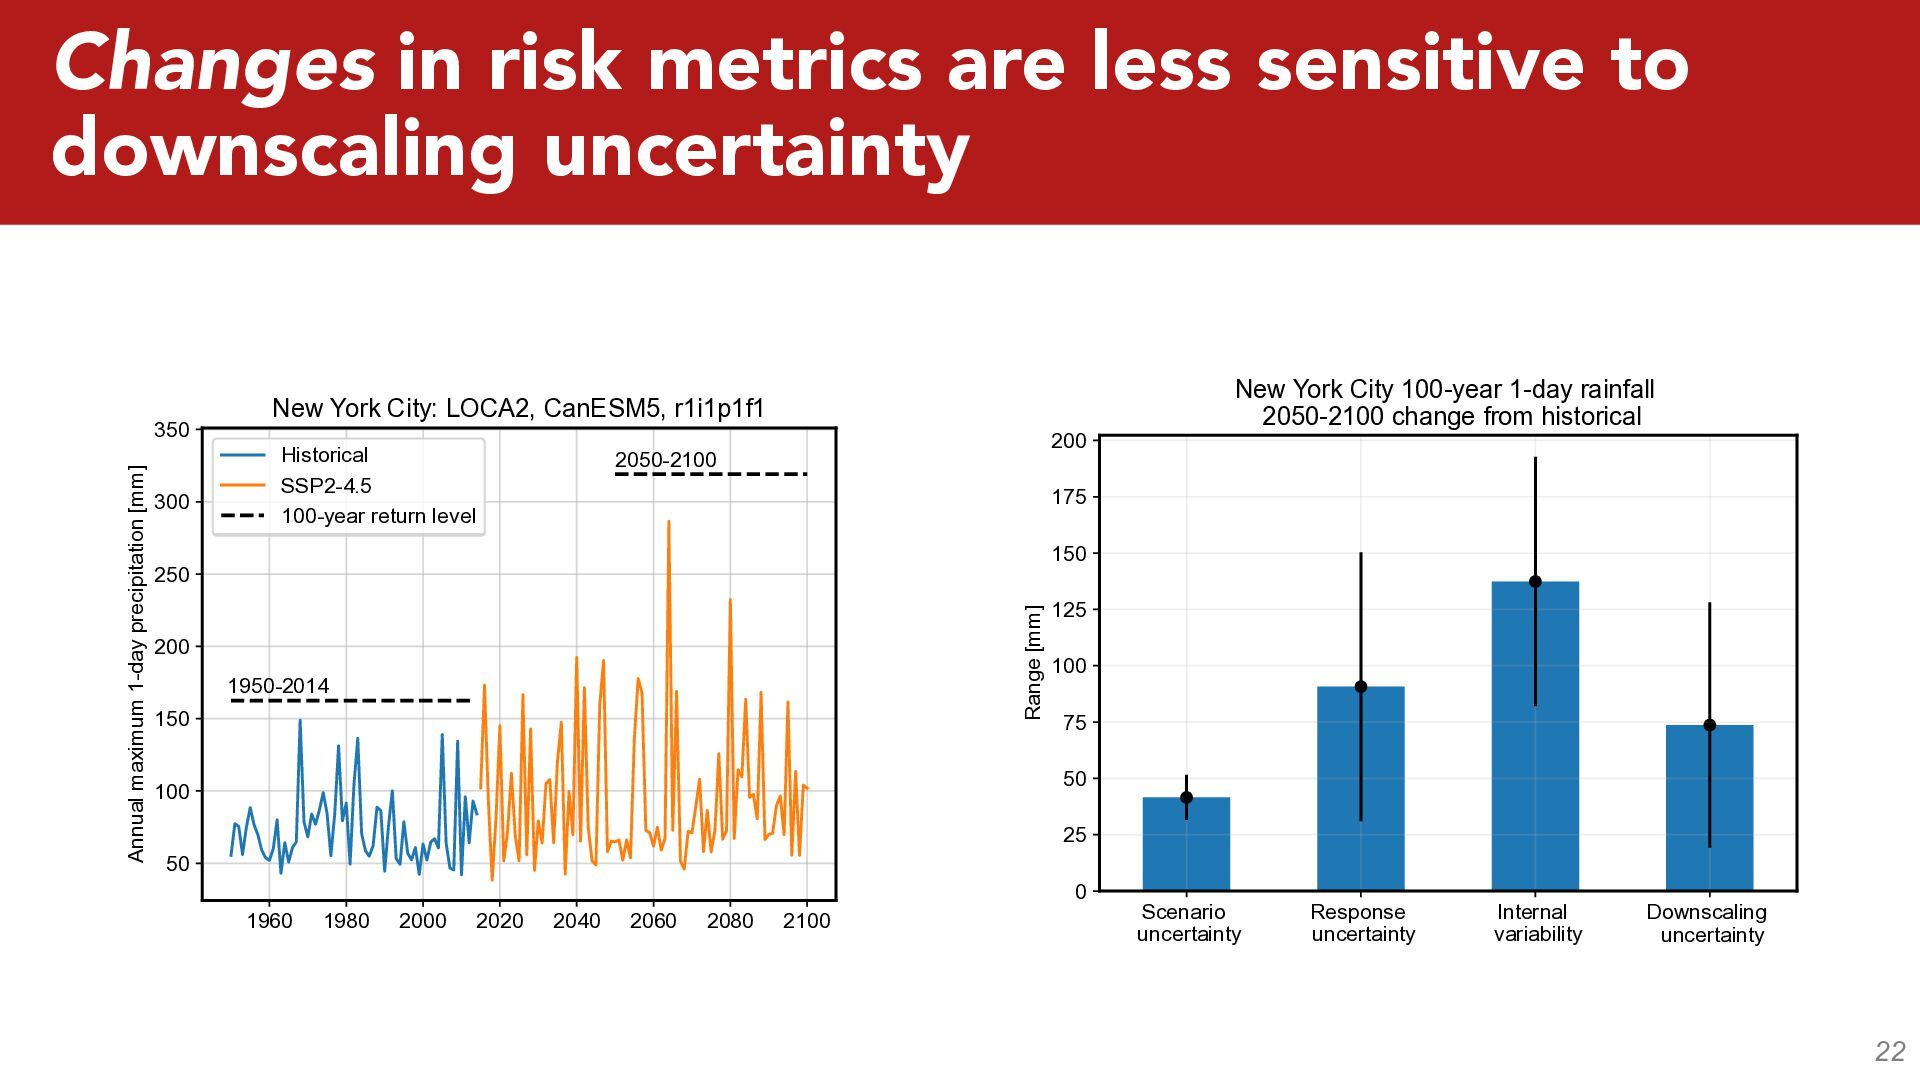
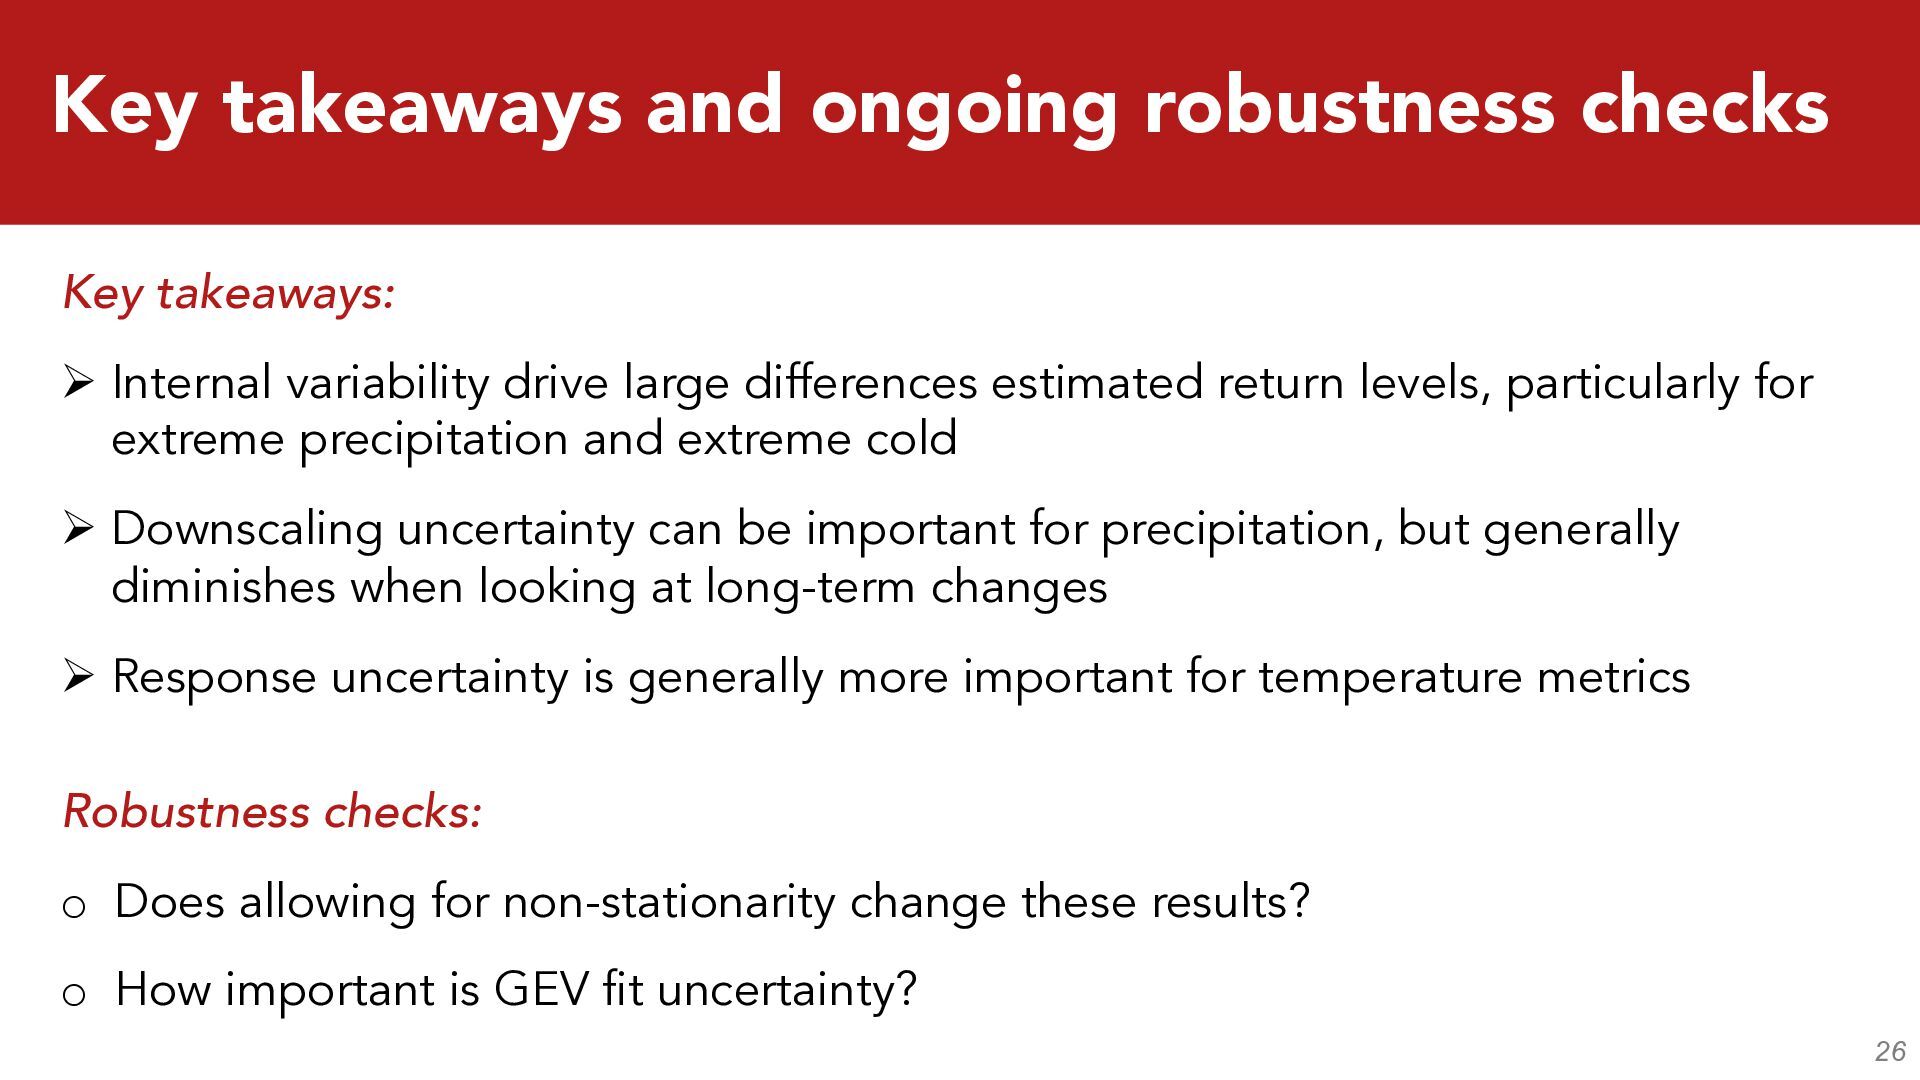
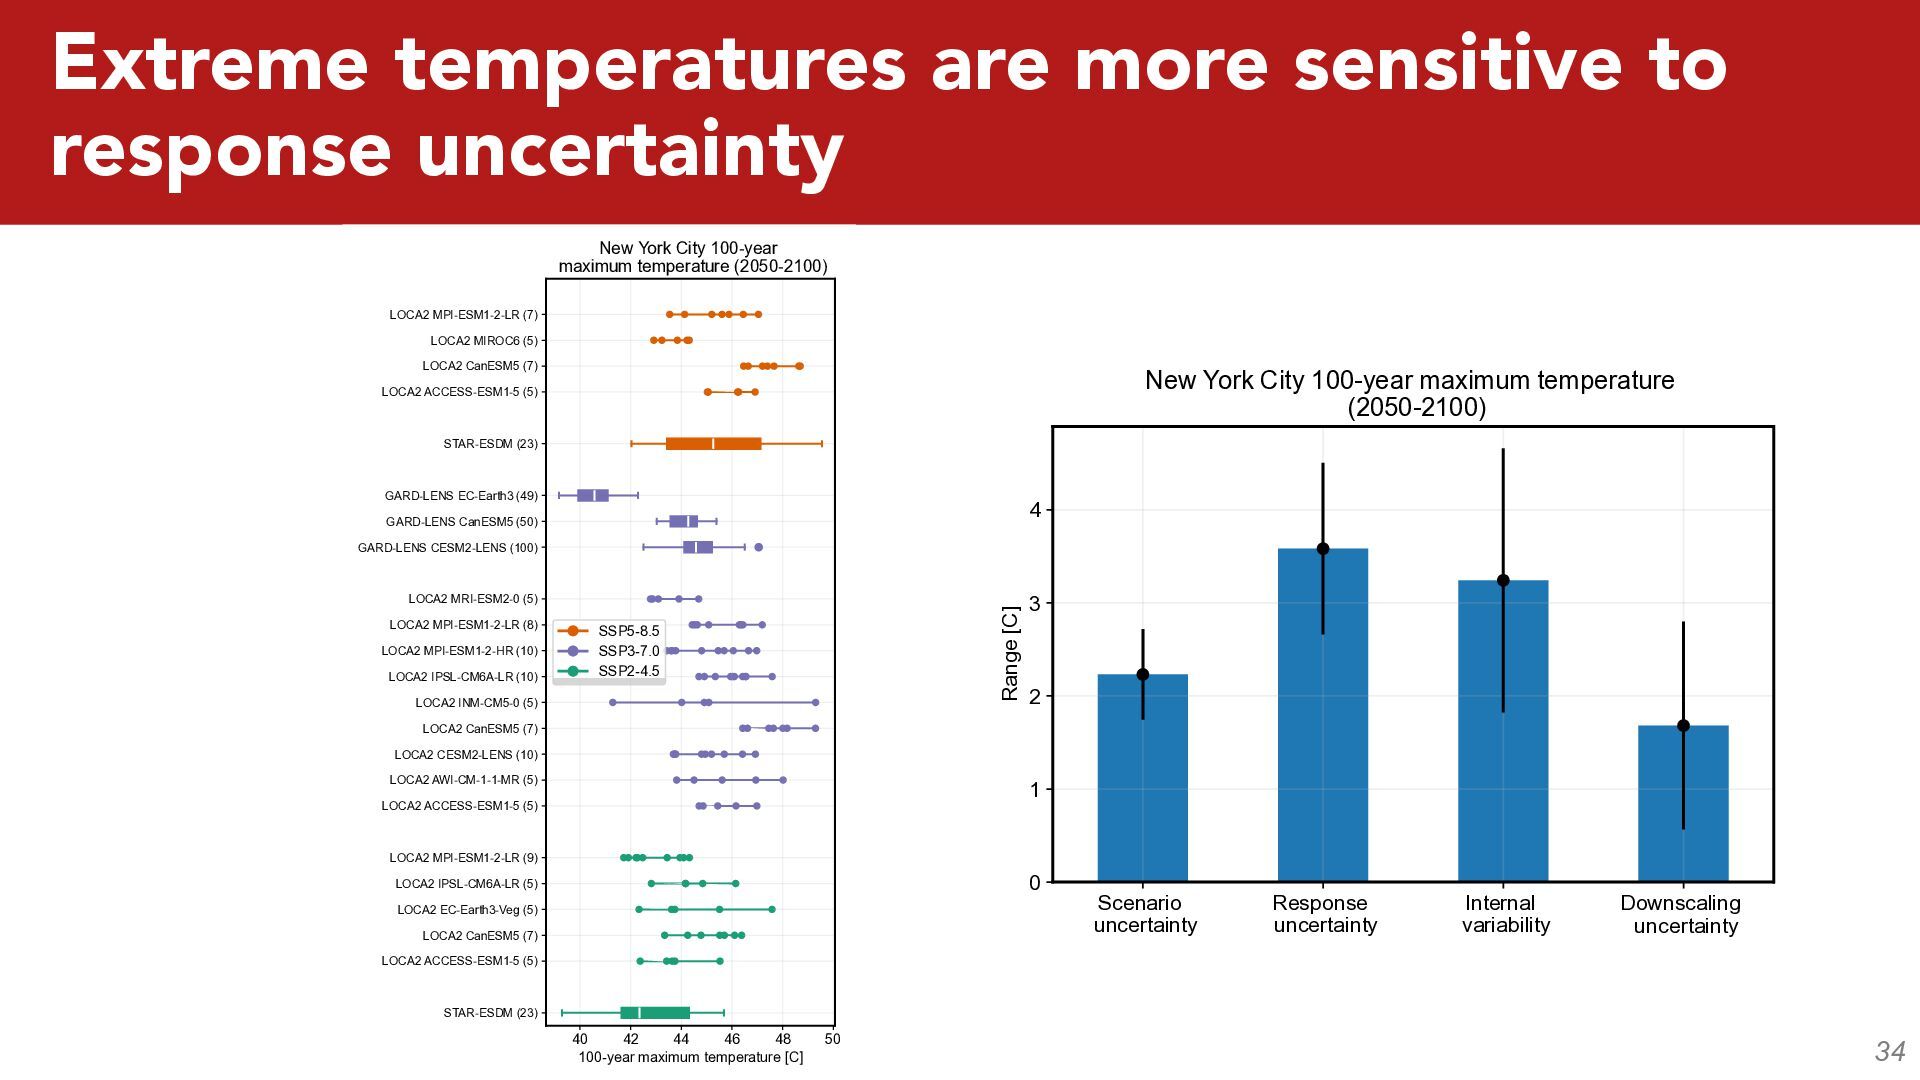
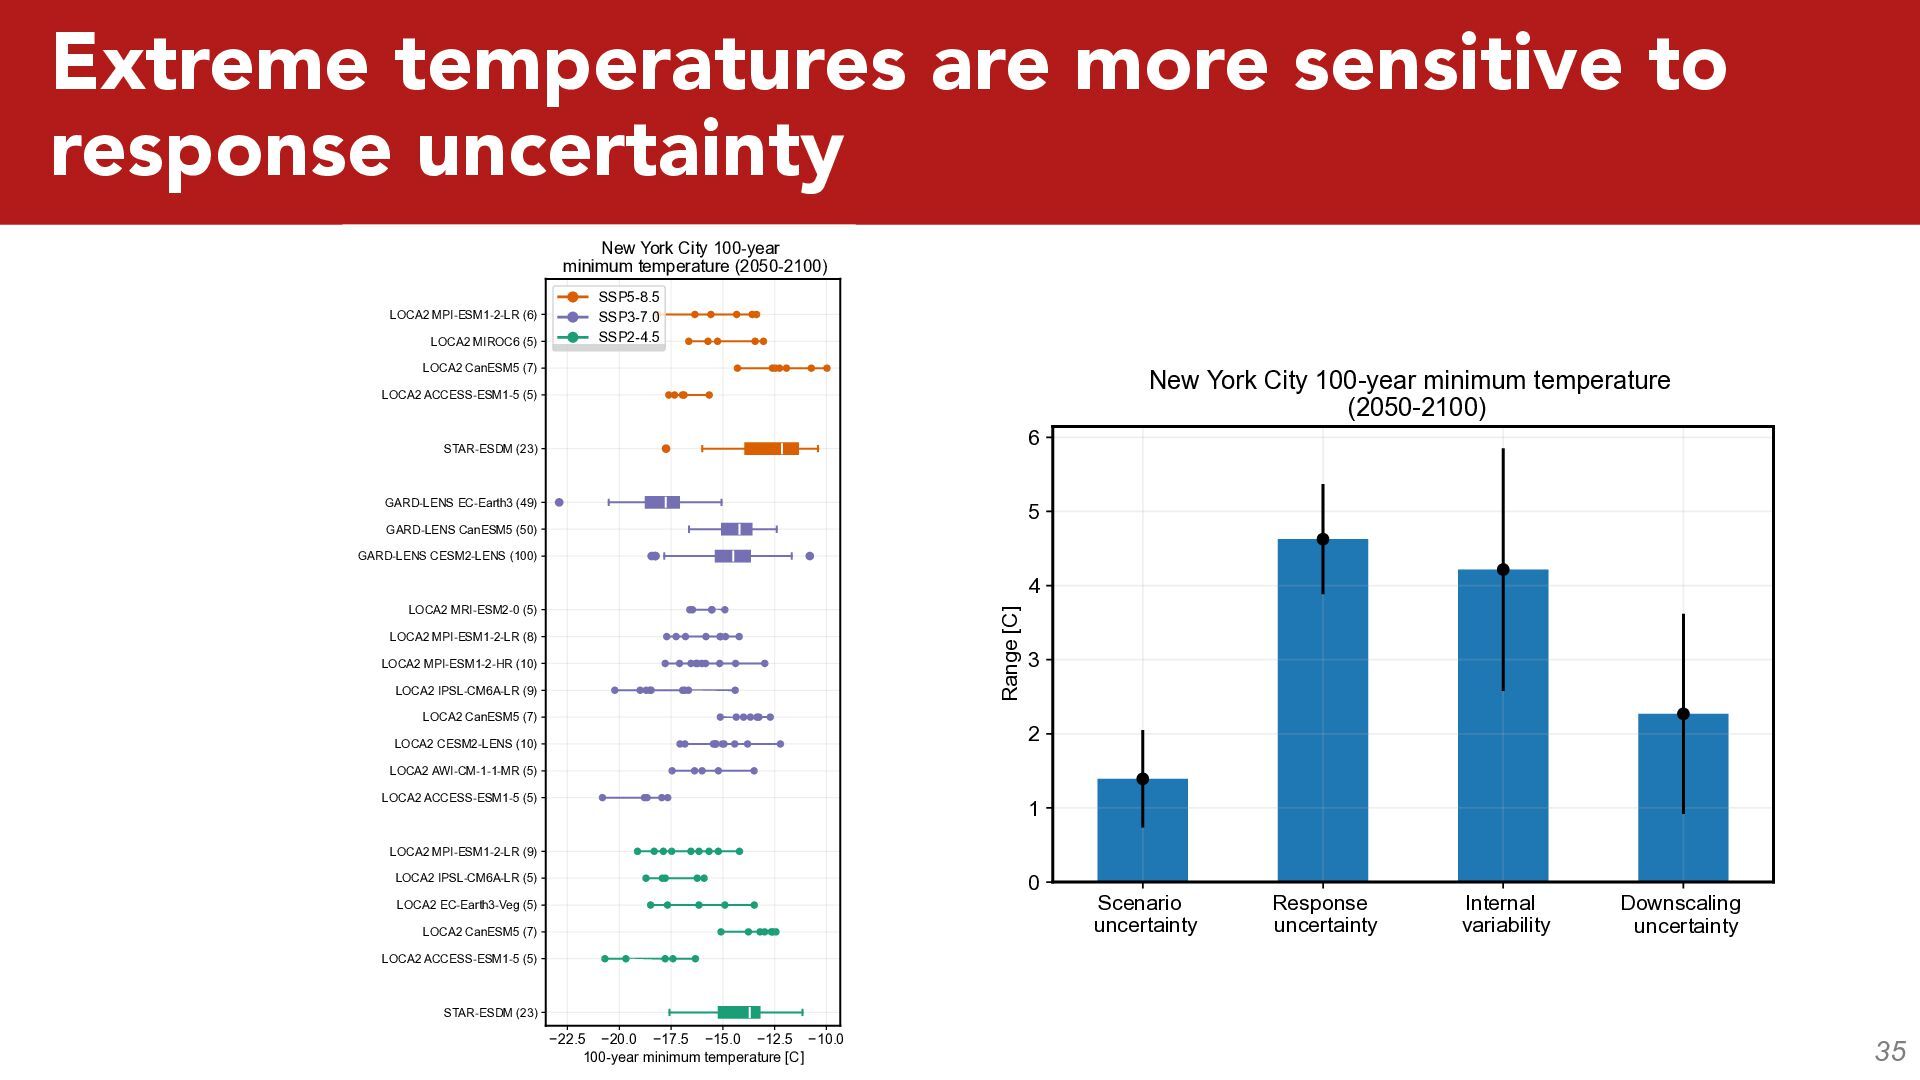
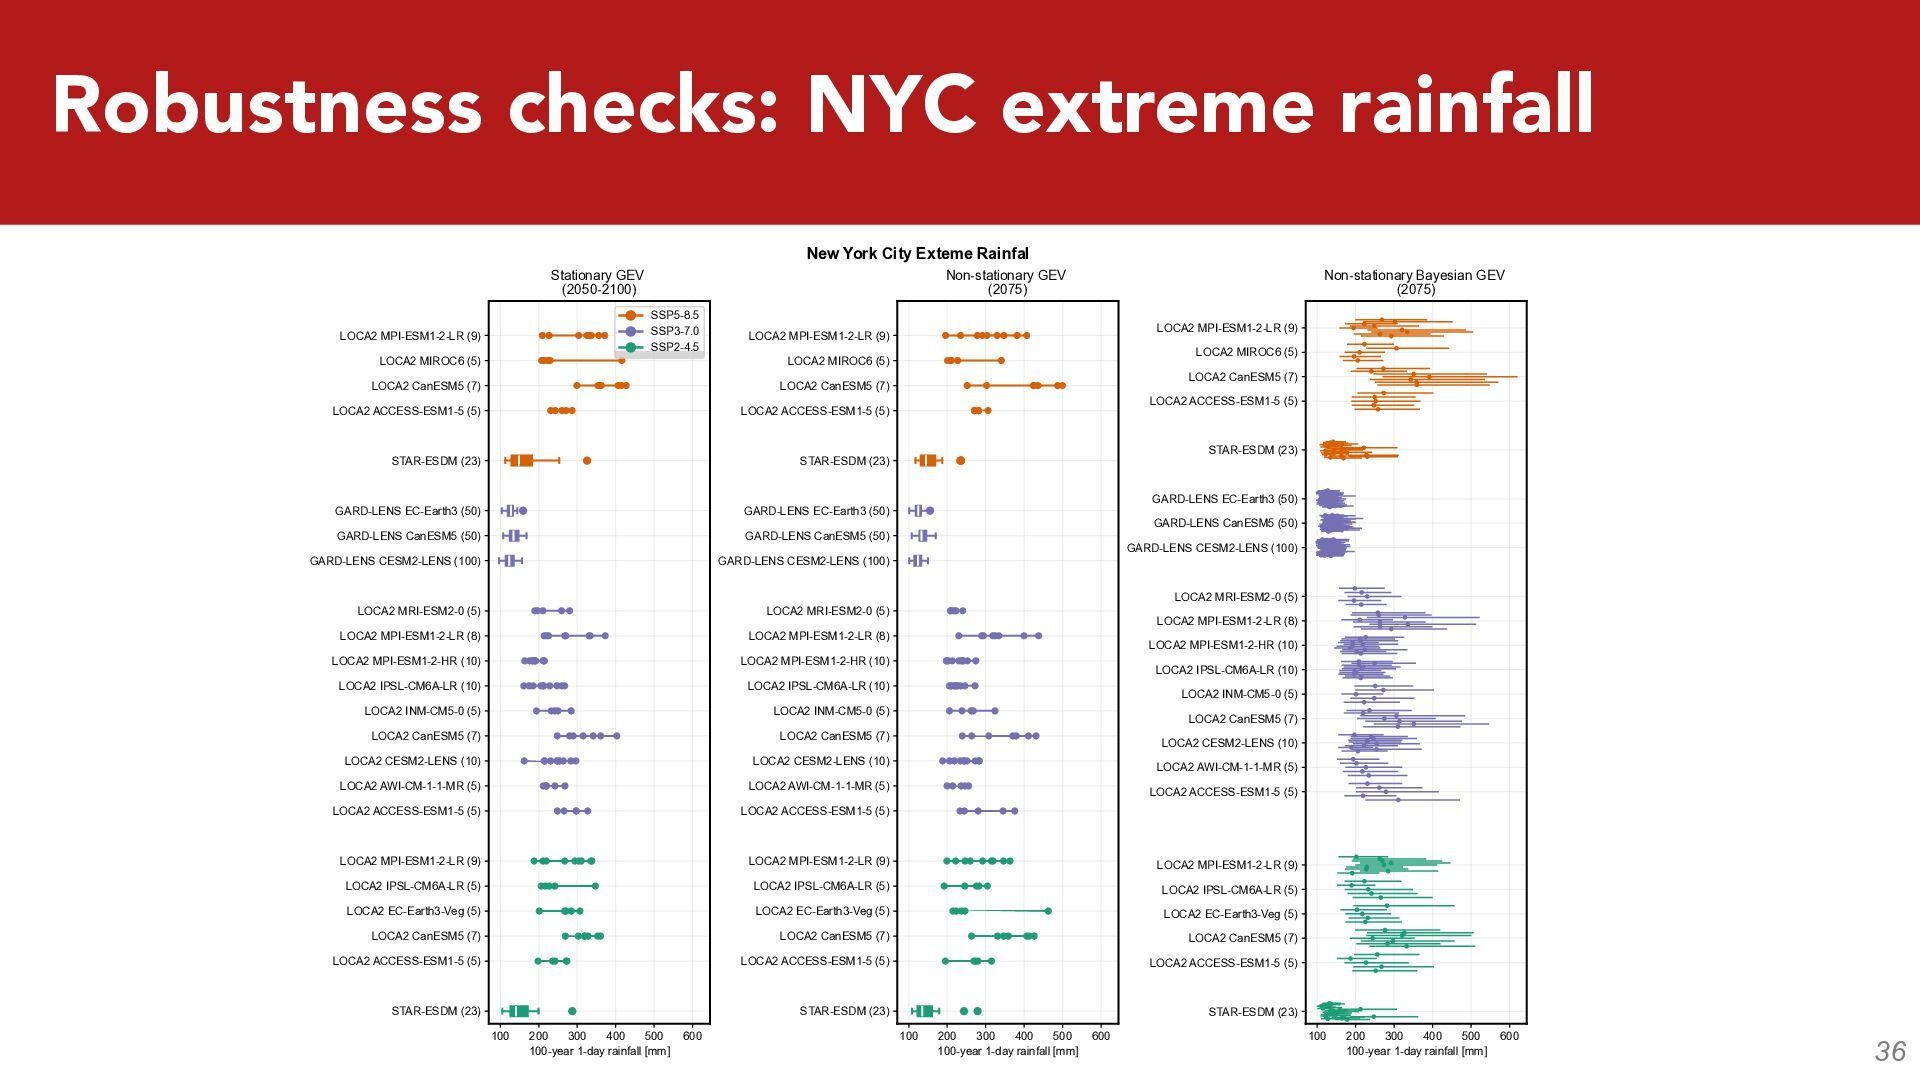
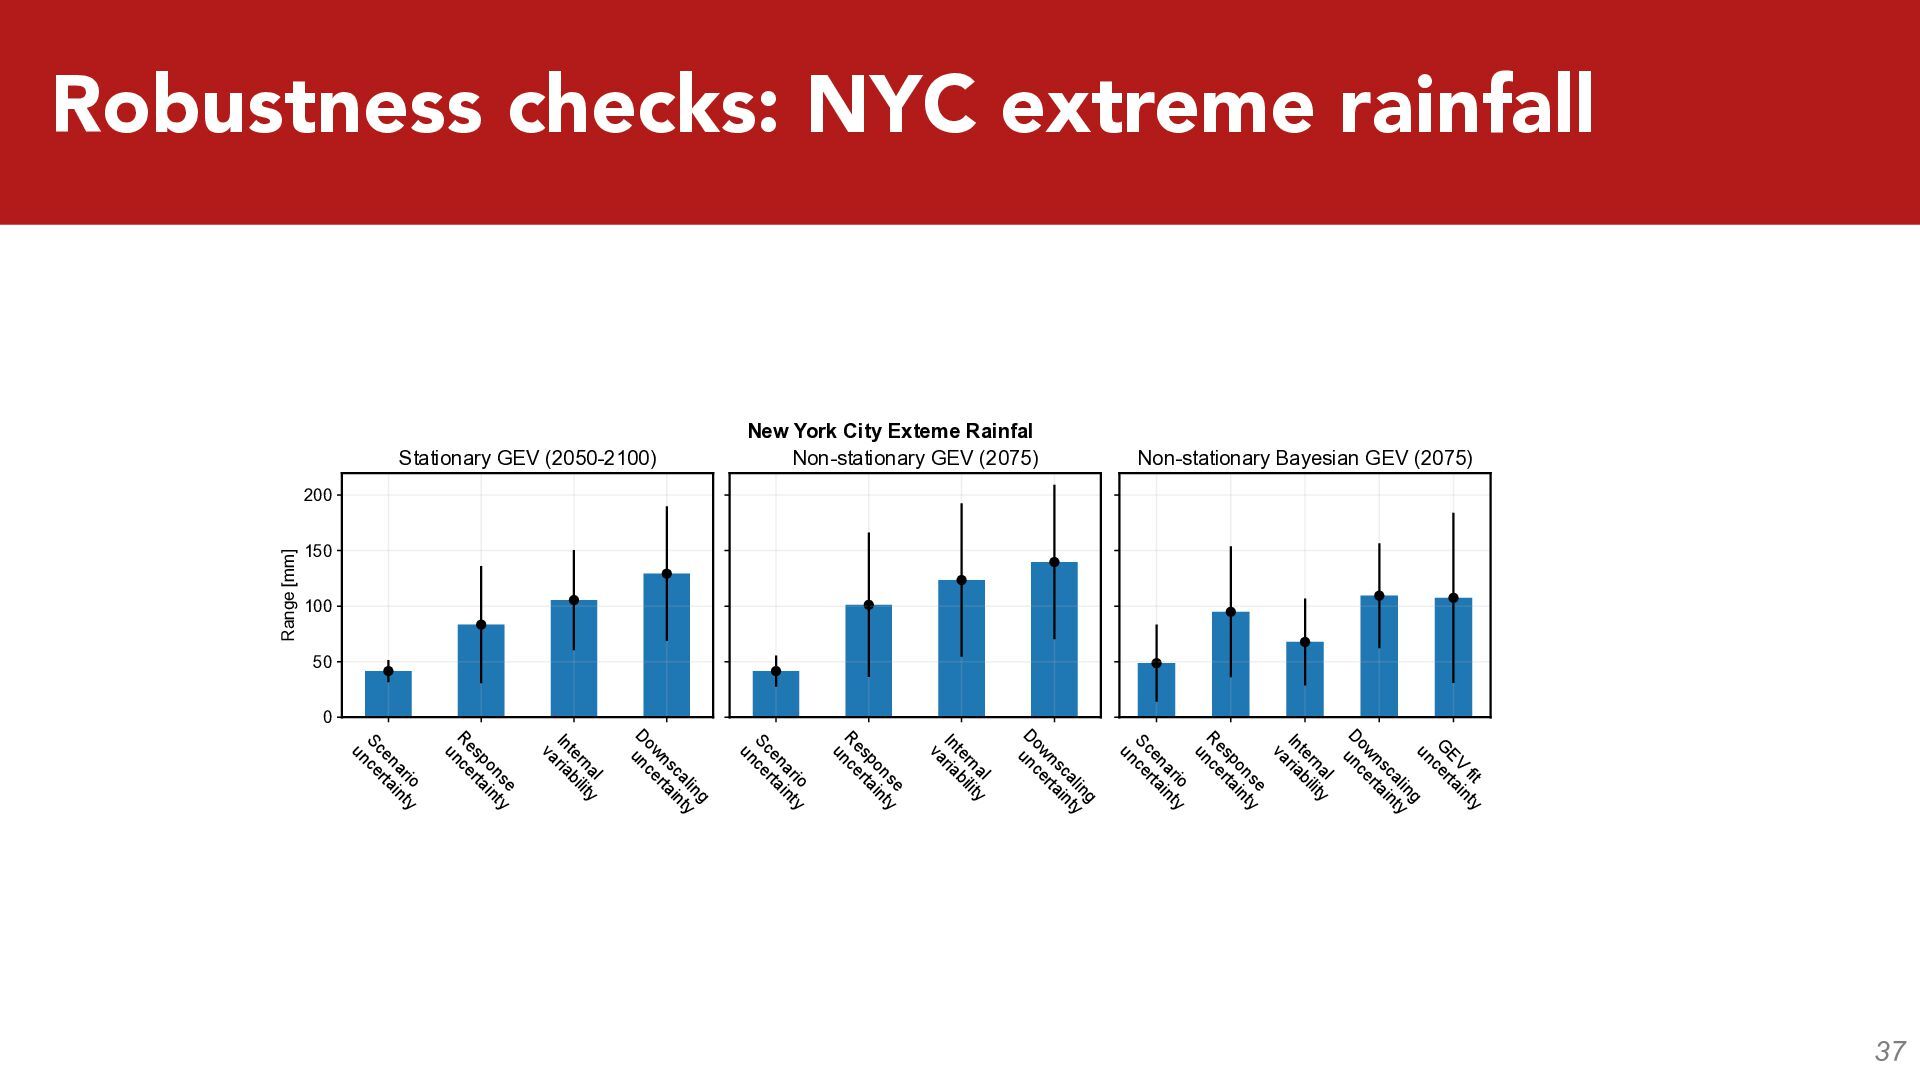
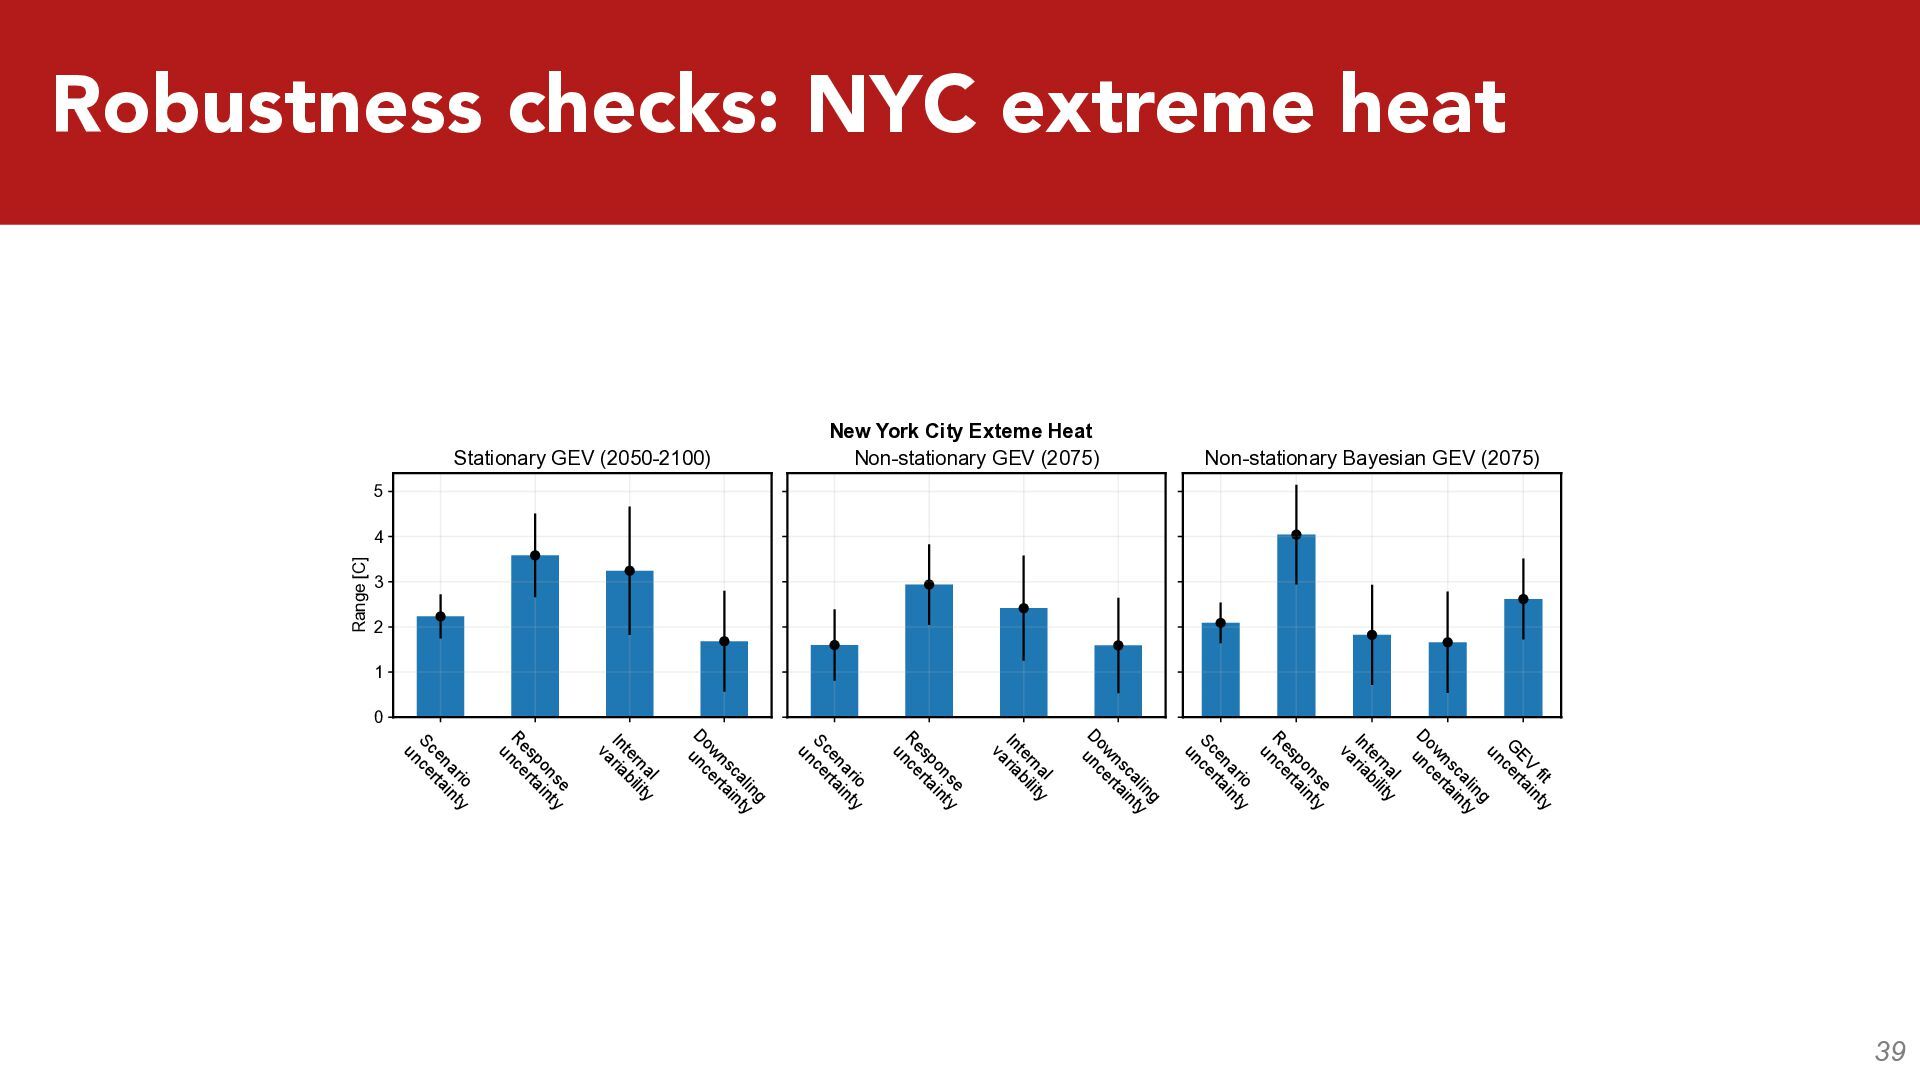
Internal variability drive large differences estimated return levels, particularly for extreme precipitation and extreme cold Ø Downscaling uncertainty can be important for precipitation, but generally diminishes when looking at long-term changes Ø Response uncertainty is generally more important for temperature metrics Robustness checks: o Does allowing for non-stationarity change these results? o How important is GEV fit uncertainty?
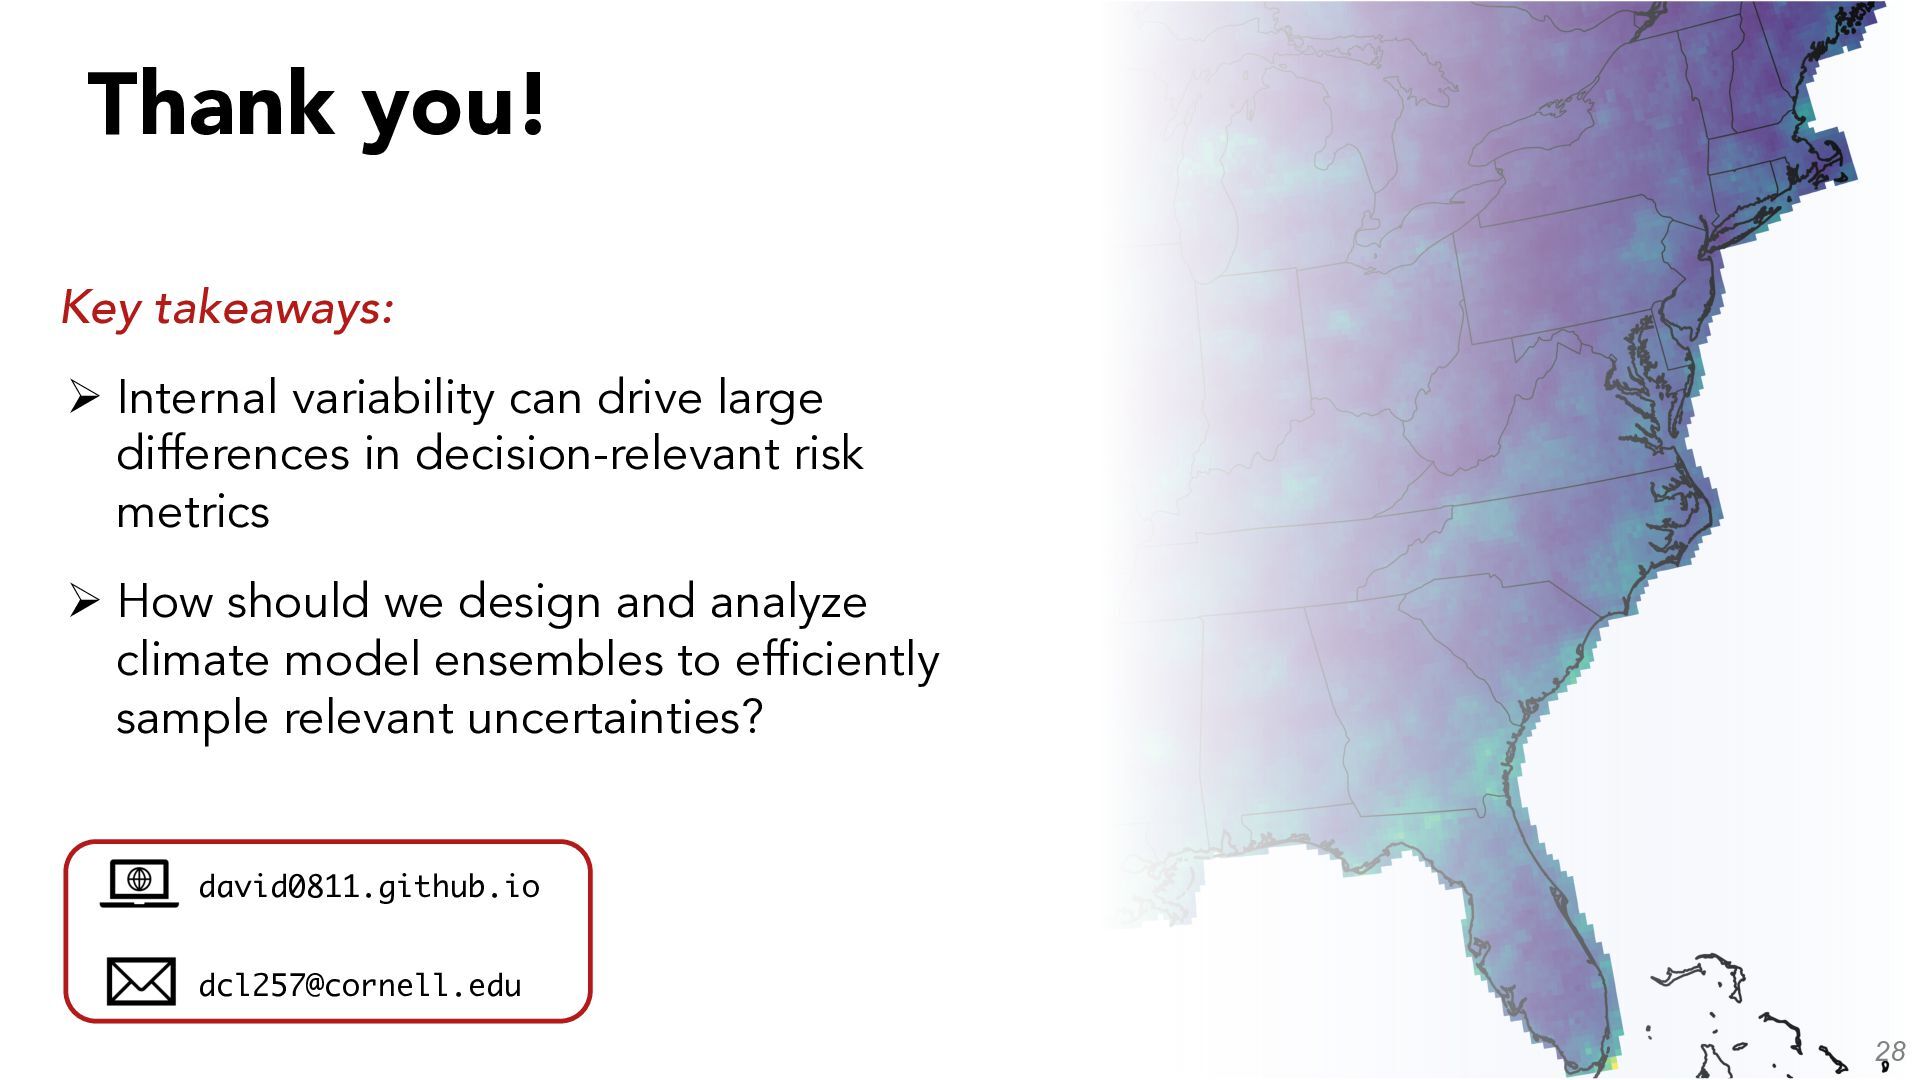
large differences in decision-relevant risk metrics Ø How should we design and analyze climate model ensembles to efficiently sample relevant uncertainties? david0811.github.io [email protected]
fit a GEV distribution to annual maxima to estimate return levels 2) Scale the GEV calculation across all outputs 3) Estimate the uncertainty associated with each source Scenario uncertainty: range across scenarios of the forced responses
fit a GEV distribution to annual maxima to estimate return levels 2) Scale the GEV calculation across all outputs 3) Estimate the uncertainty associated with each source Response uncertainty: range across forced responses within each scenario