Upgrade to Pro — share decks privately, control downloads, hide ads and more …

Alignak Monitoring general presentation

David Durieux
September 16, 2016

Alignak Monitoring general presentation

David Durieux

September 16, 2016
Tweet

Other Decks in Technology

Transcript

  1. INTRODUCTION Alignak is a complete monitoring solution. It will help

    you to easily implement the monitoring of your resources (servers, applications, network devices...). The reporting is too an important part of the solution and we especially worked on it to offer powerful views on webui.
  2. FEATURES Fail-over Load balancing REST API for con guration and

    reporting Database for con guration, history, reporting WebUI Nagios / Shinken compatible features Robust code (many [unit|integration|functional] tests) Software quality with pep8 + pylint conformity Native support of grafana, timeseries (graphite/carbon, in uxdb), logs and also standard monitoring features...
  3. ALIGNAK: THE MONITORING FRAMEWORK (2/2) Alignak is made of several

    parts that can be run on the same server or distributed: Arbiter: manages con guration and is an orchestra conductor Scheduler: schedules the checks to execute Poller: executes the checks Broker: gets event broks. As an example, populate the live state to the Backend Reactionner: executes actions scripts (noti cations, event handler...) Receiver: collects passive checks. As an example: NSCA
  4. HOW-TO CONFIGURATION 1/2 The steps: Add / update elements in

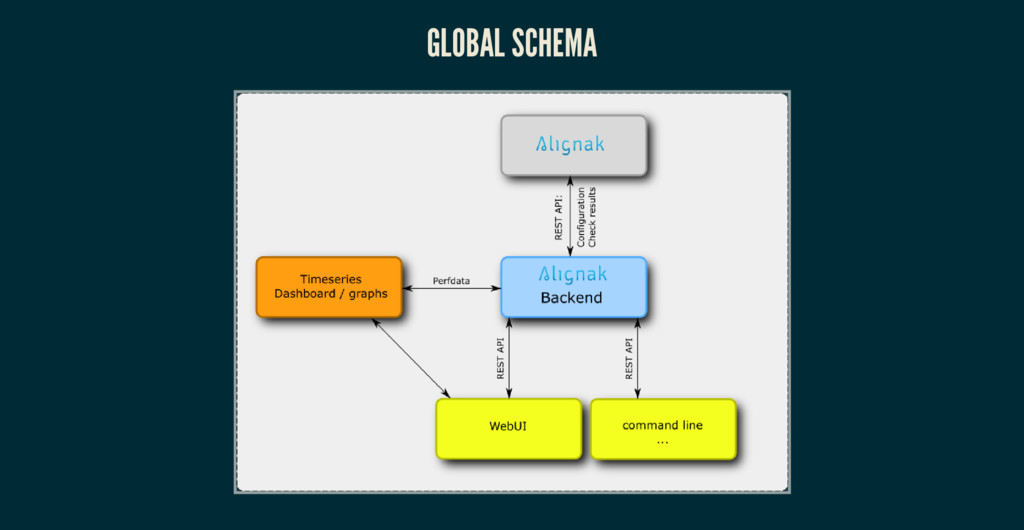
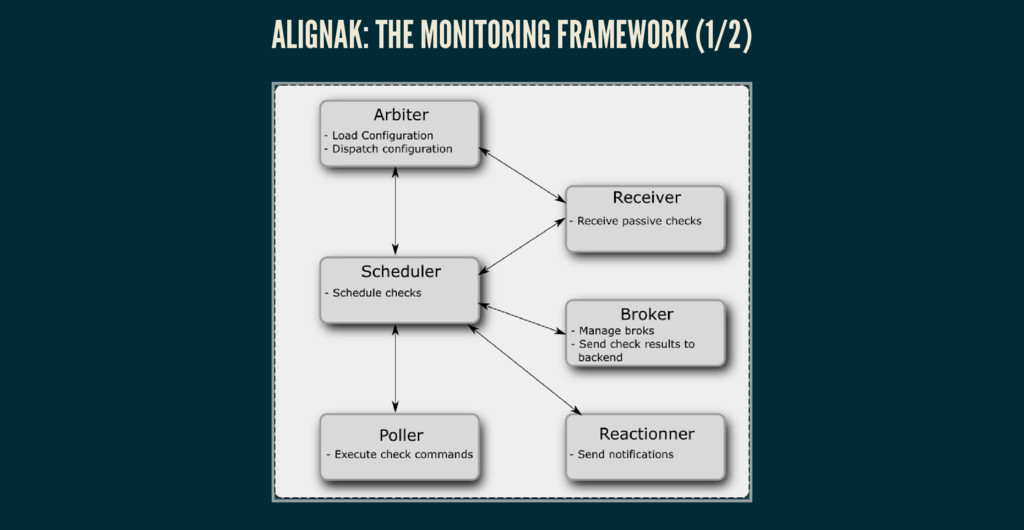
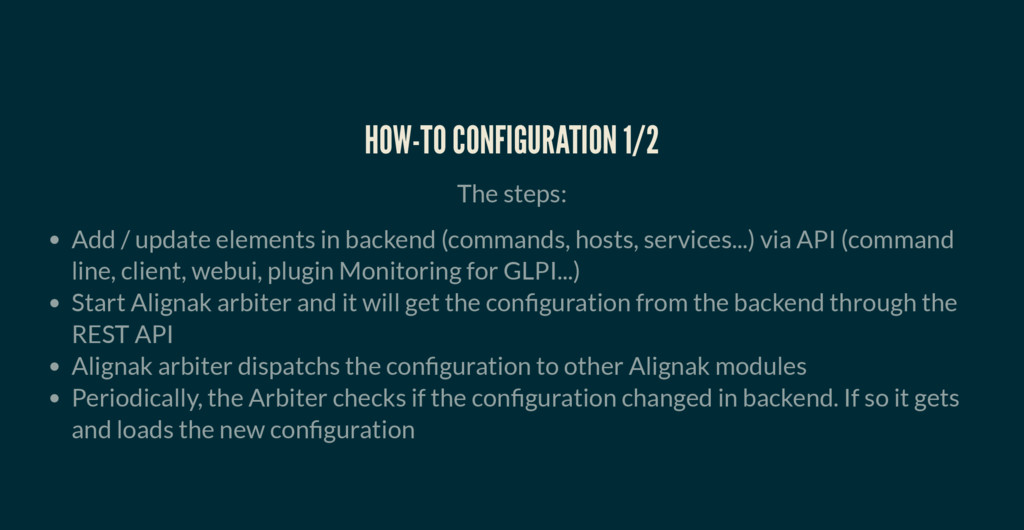
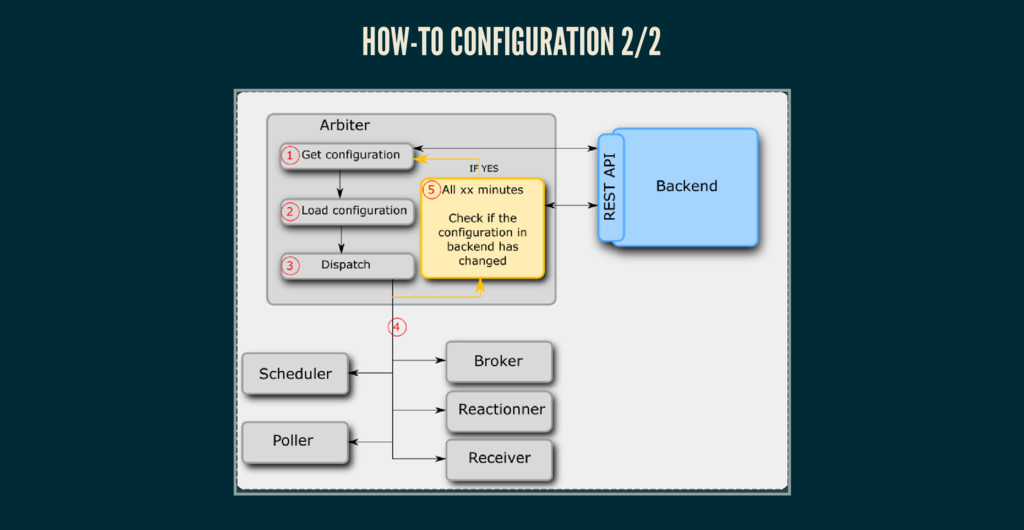
    backend (commands, hosts, services...) via API (command line, client, webui, plugin Monitoring for GLPI...) Start Alignak arbiter and it will get the con guration from the backend through the REST API Alignak arbiter dispatchs the con guration to other Alignak modules Periodically, the Arbiter checks if the con guration changed in backend. If so it gets and loads the new con guration
  5. BACKEND CLIENT We support different clients / libraries to dialog

    with the Backend: Python 2.7 / 3.x client: PHP library: https://github.com/Alignak-monitoring-contrib/alignak- backend-client https://github.com/Alignak-monitoring-contrib/alignak-backend-php- client For information, the python client is used by the Alignak Arbiter, the Broker modules and the WebUI. Of course, any other low-level client may be used: curl, postman, ...
  6. WEBUI In the WebUI, we can: Widget used to compose

    your dashboard Worldmap used to display on map works your hosts and state Minemap See all elements (hosts, services, commands, timeperiods...) See log table Manage acknowledge, downtime and recheck Graph of each check and more...
  7. WEBUI - GRAPHS (1/2) The Alignak backend: Creates dashboards and

    graphs for each command (host / service) in Grafana Stores the id of the graph in host / service endpoint The webui: Gets and displays the graphs from Grafana
  8. MIGRATE FROM ANOTHER MONITORING SYSTEM If you already have Nagios

    or Shinken con guration les, you can: Start Alignak with your con guration les (without using the Alignak Backend) Import your data into the Alignak Backend thanks to an importation script
  9. DOCUMENTATION We try to have a best complete documentation. Perhaps

    not really complete (you can help us!) but want it simple and understandable.