Upgrade to Pro — share decks privately, control downloads, hide ads and more …

Challenges of building clinical biomarkers from M/EEG: multimodal modelling with missing data and robust regression on power spectra

Challenges of building clinical biomarkers from M/EEG: multimodal modelling with missing data and robust regression on power spectra

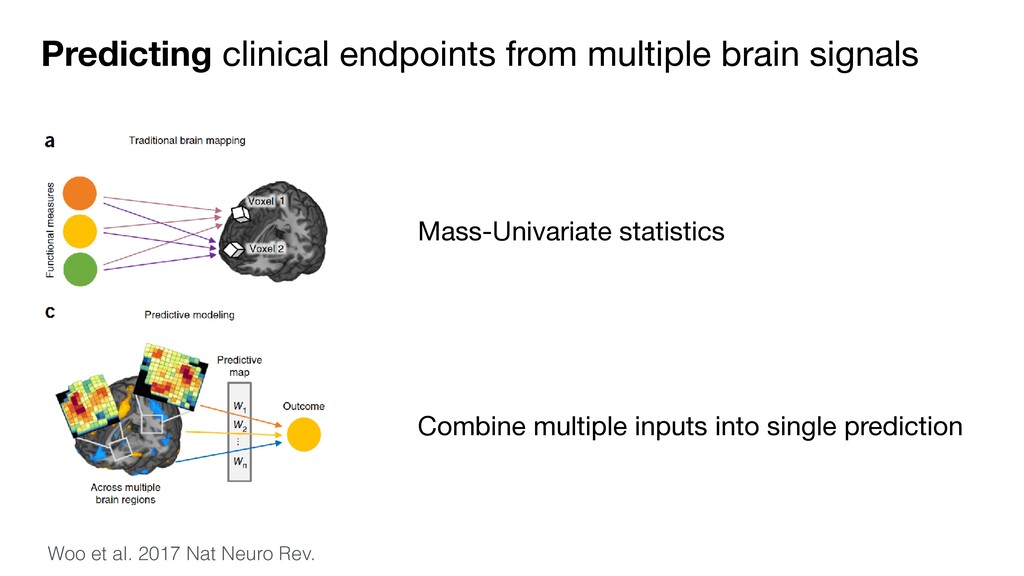
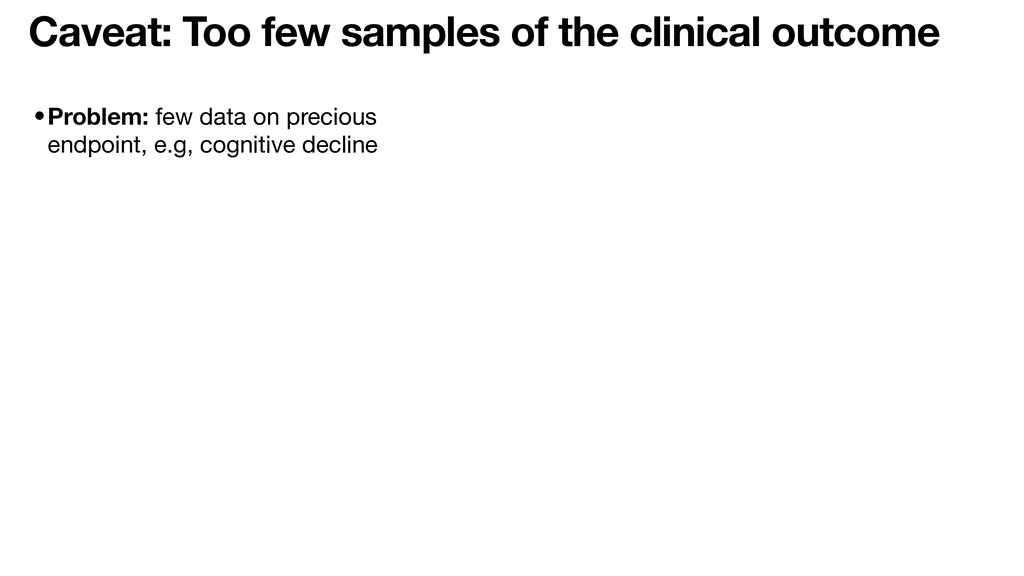
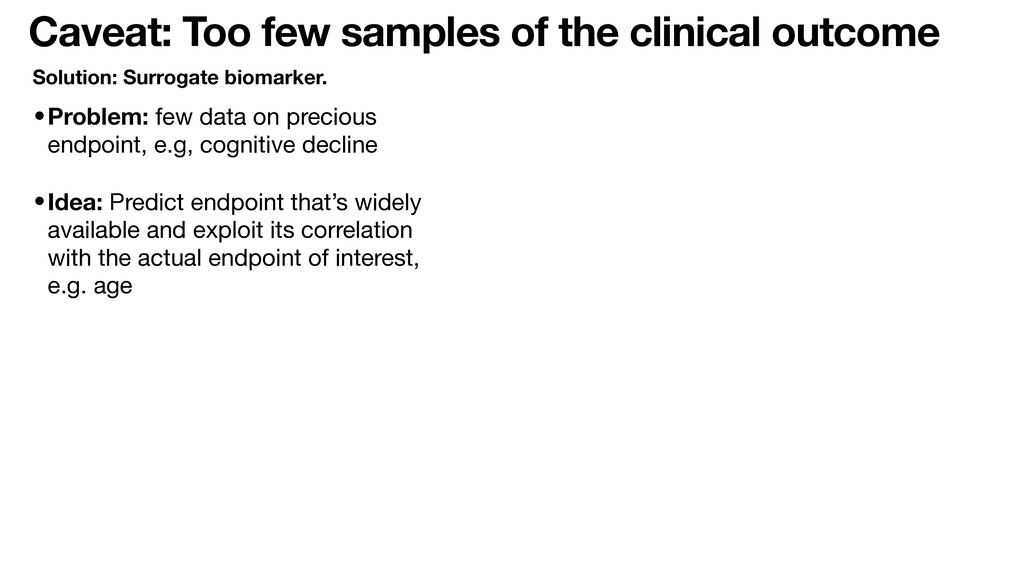
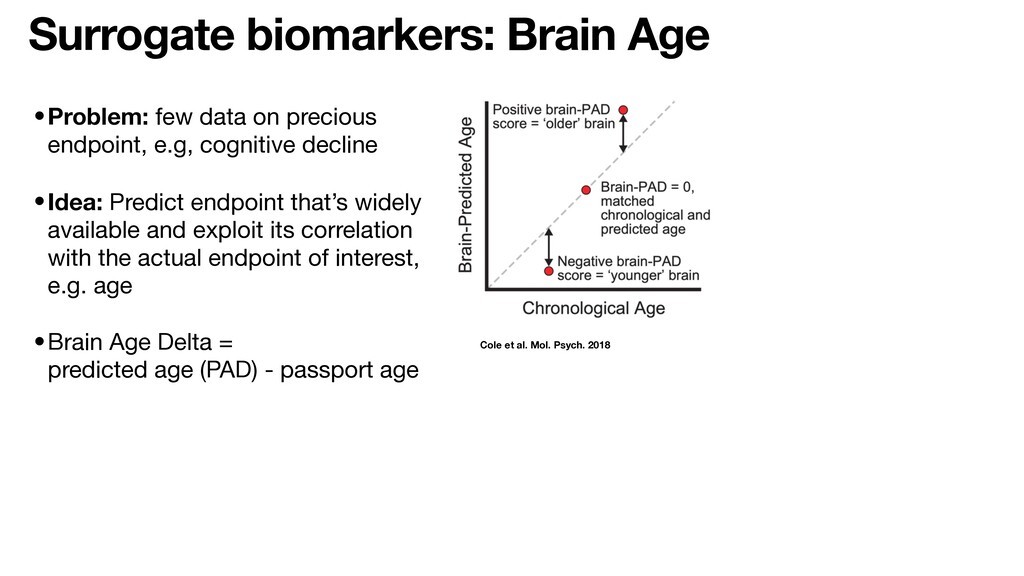
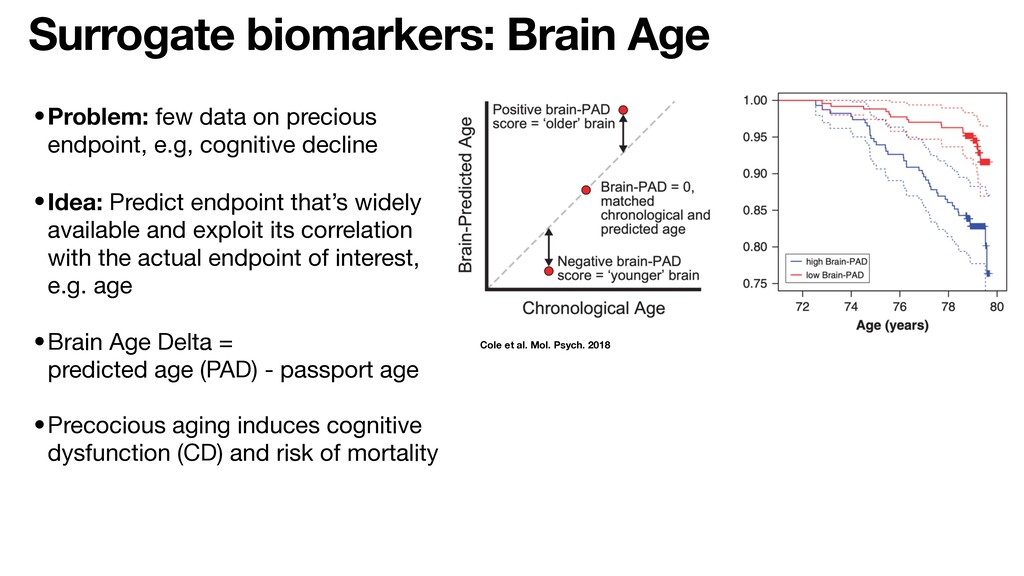
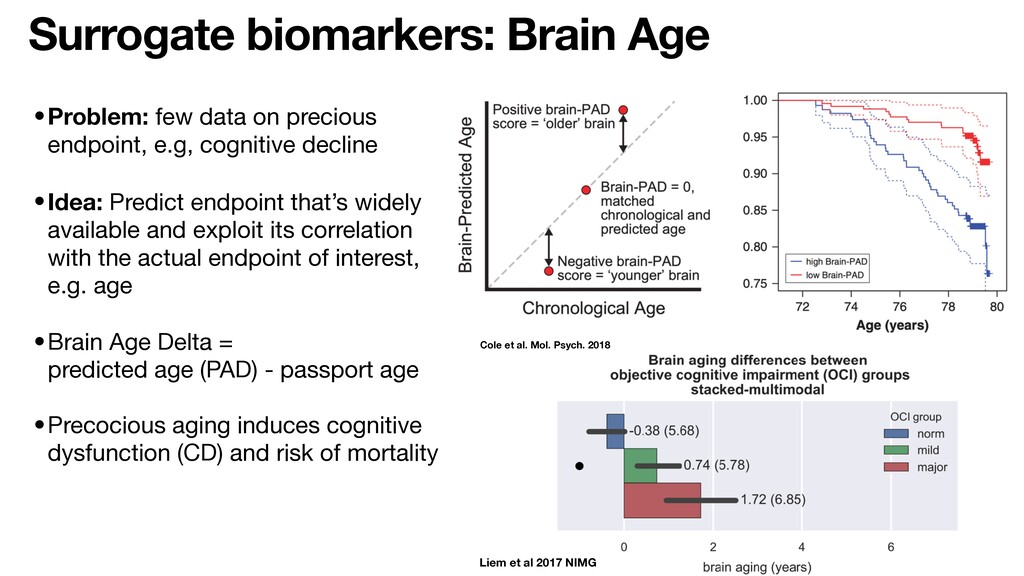
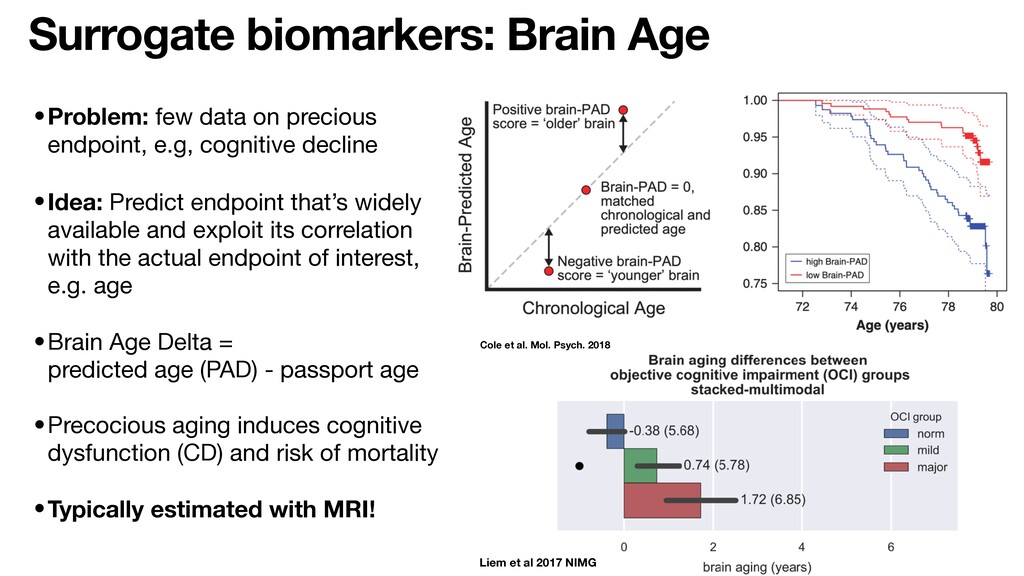
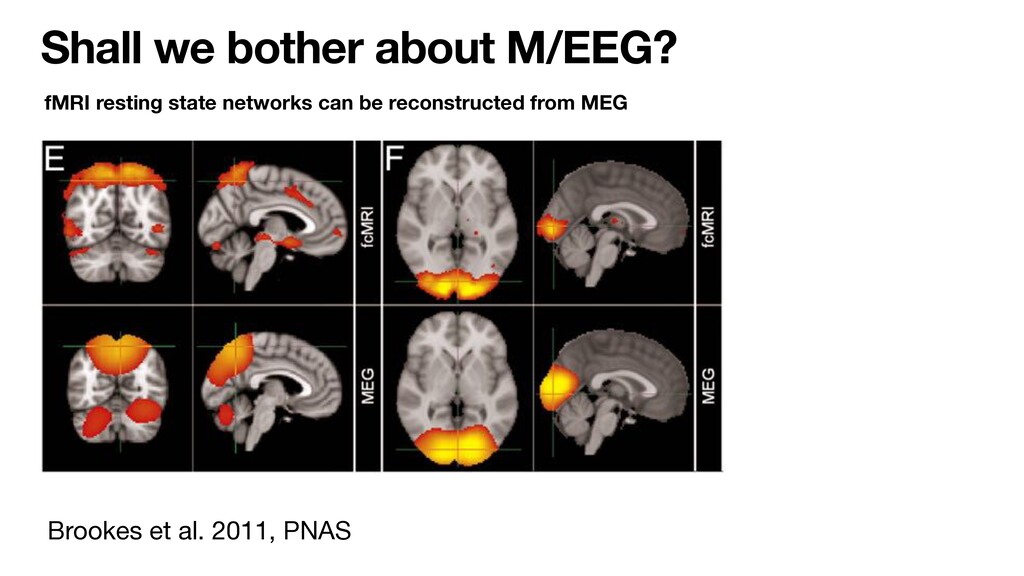
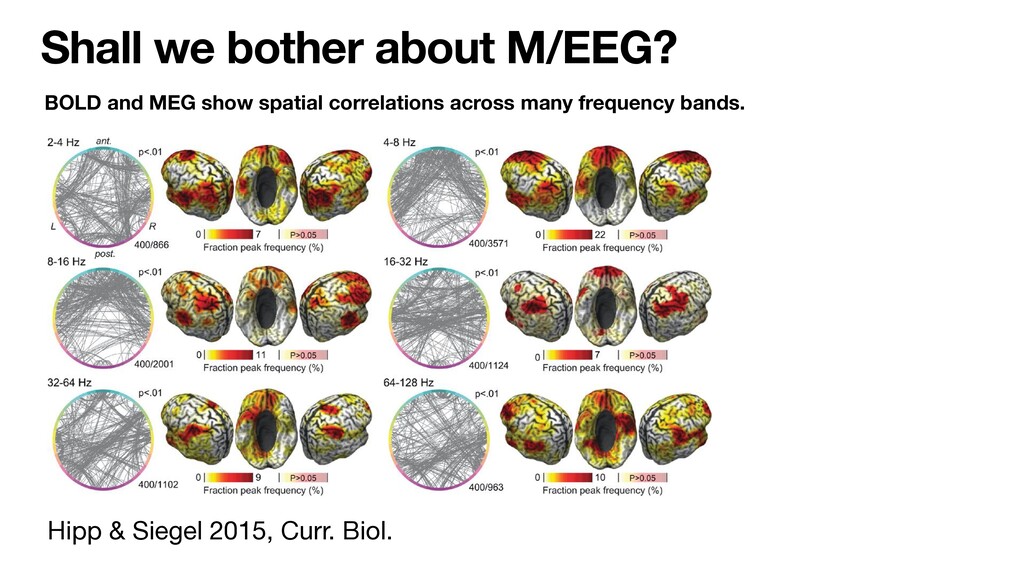
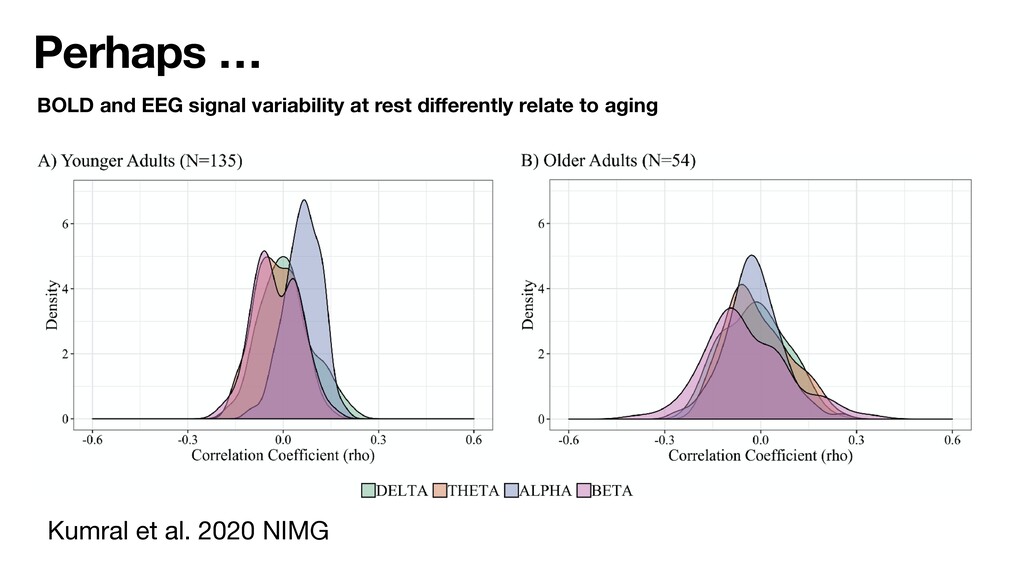
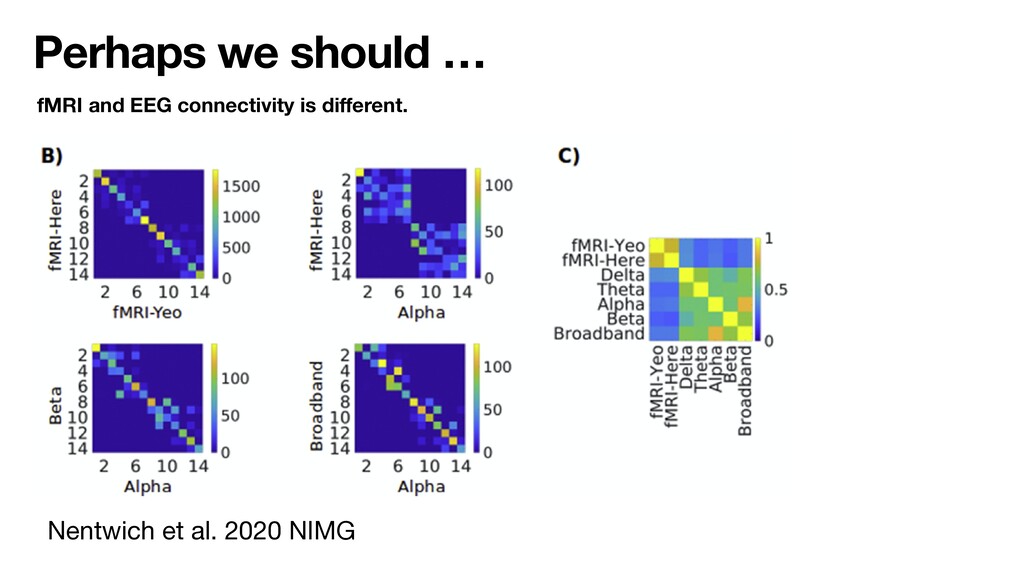
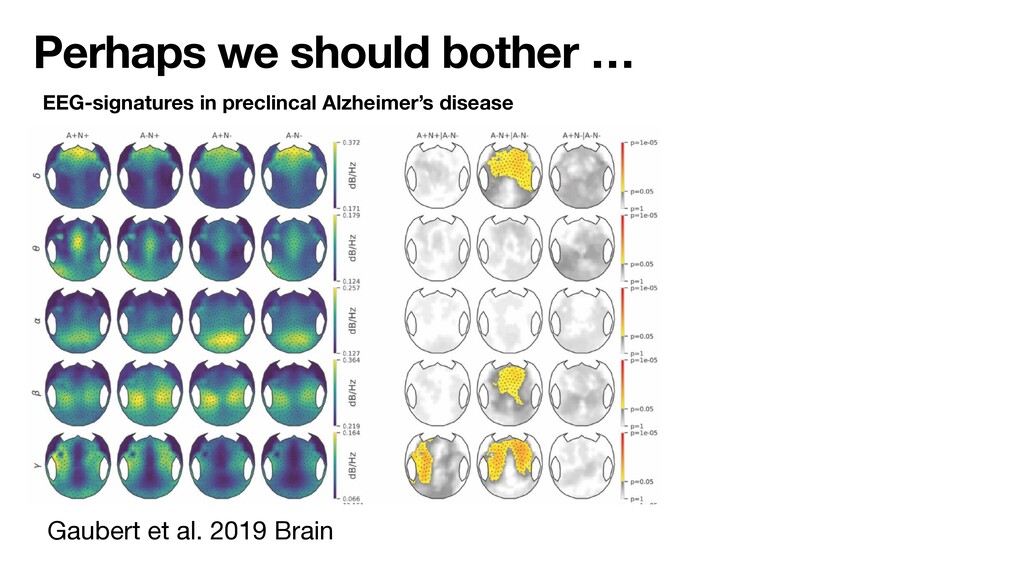
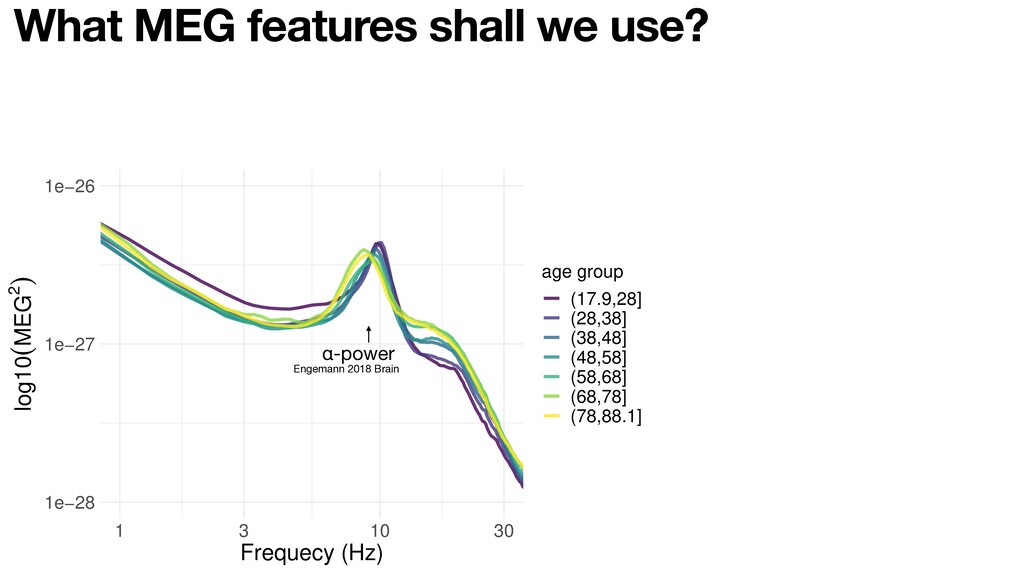
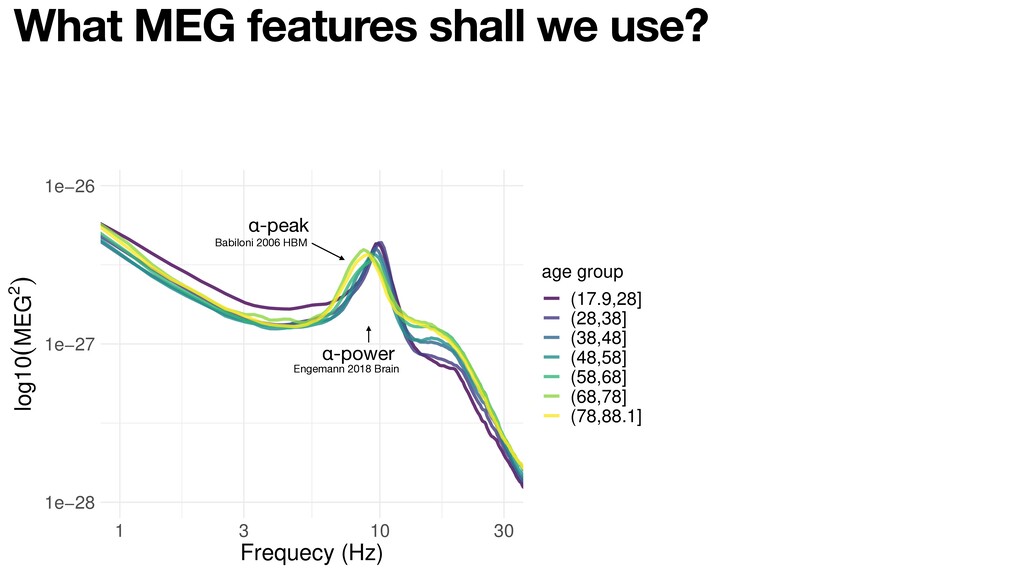
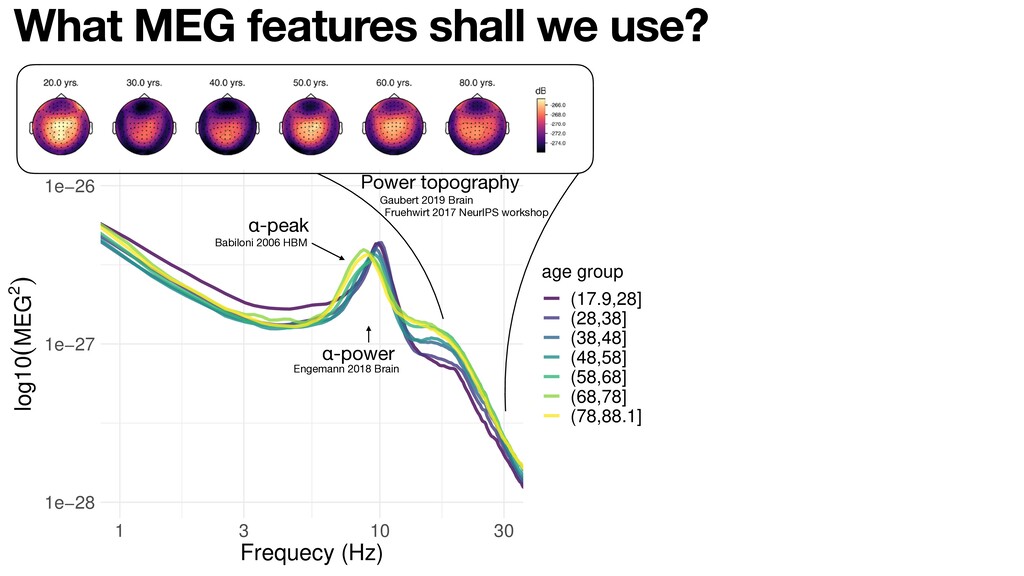
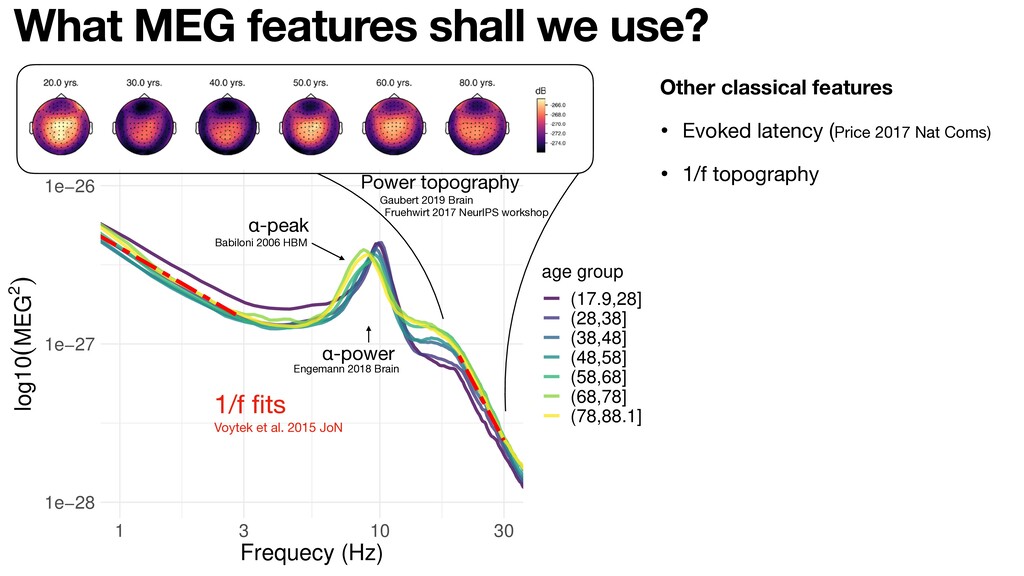
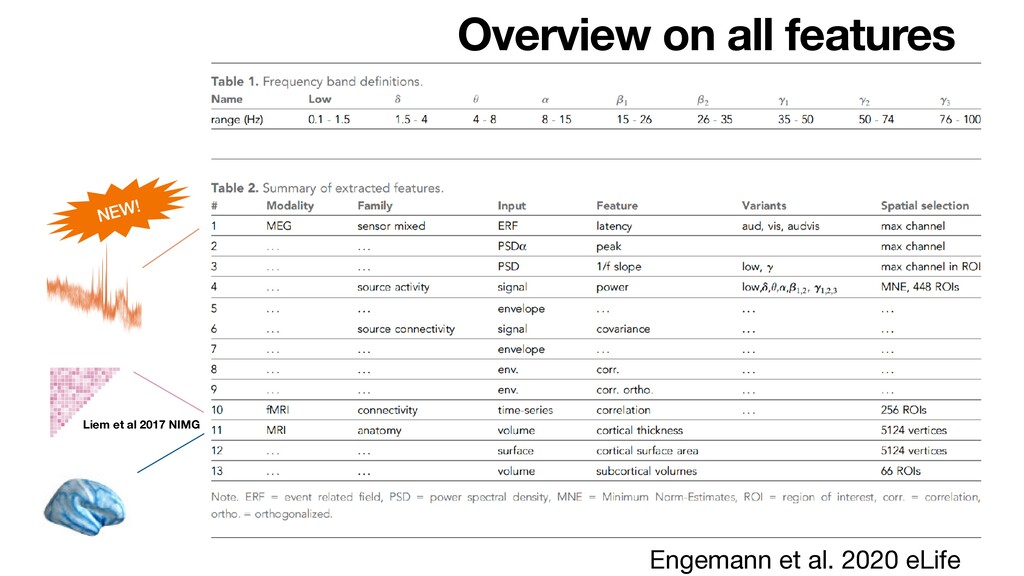
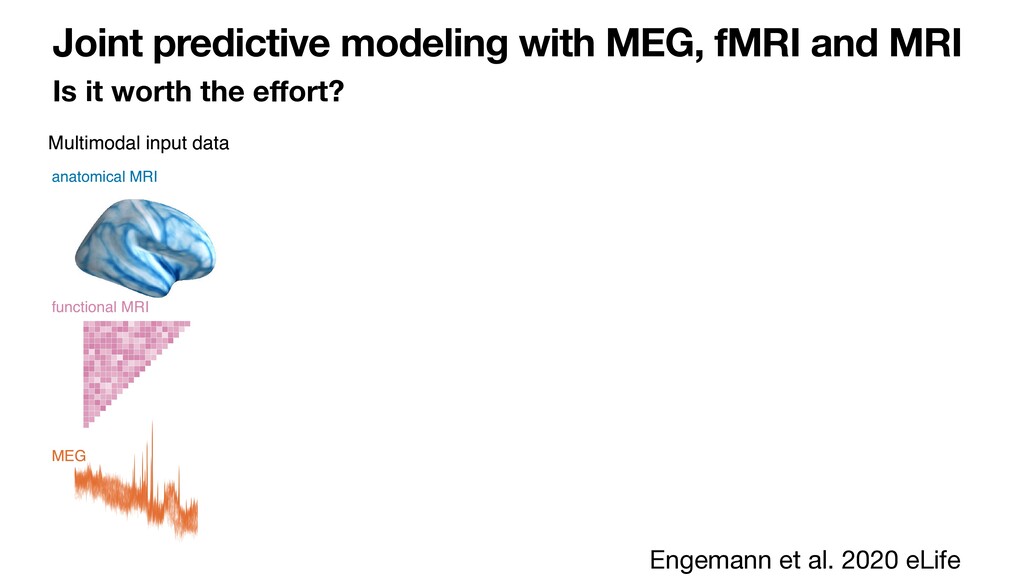
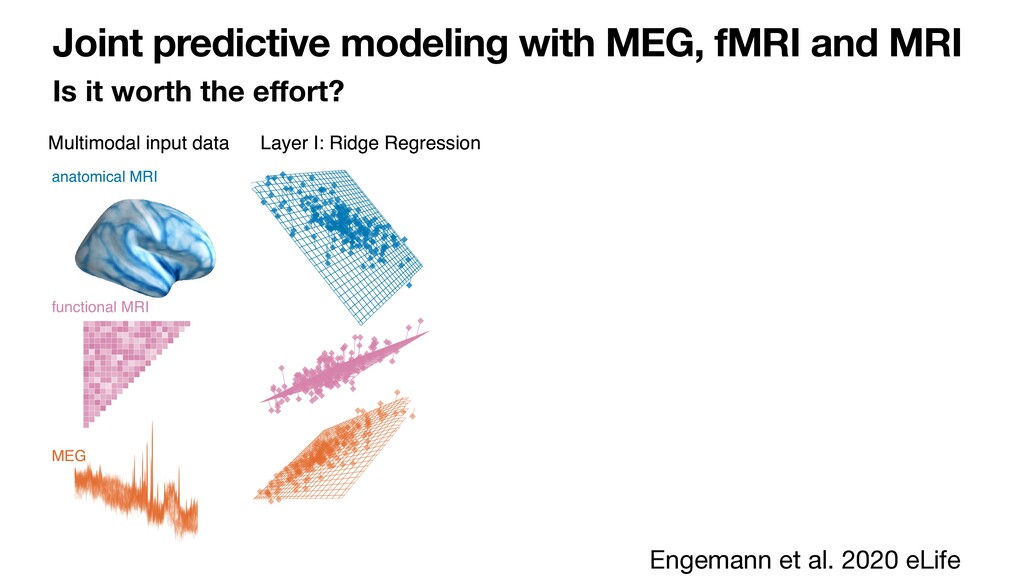
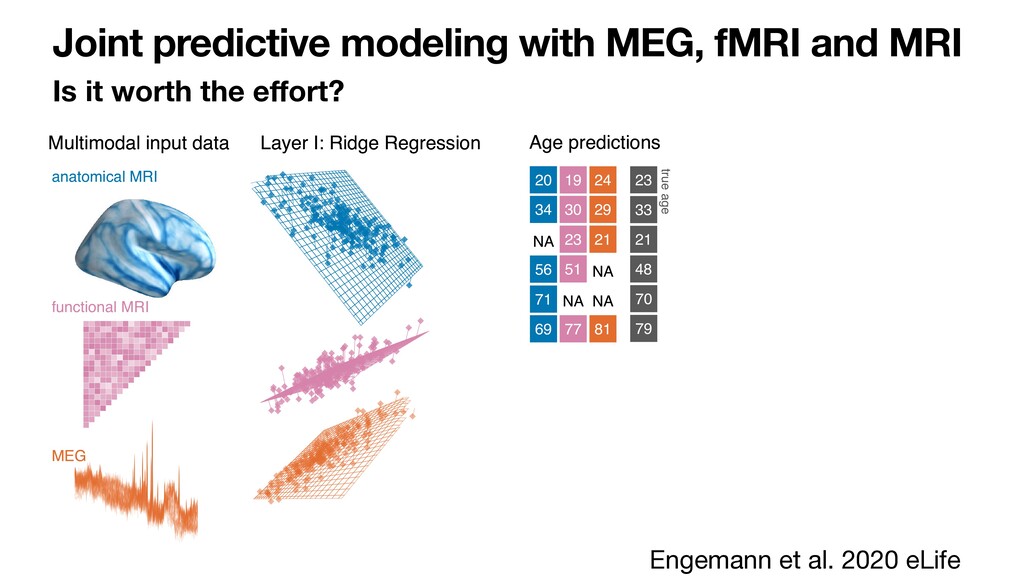
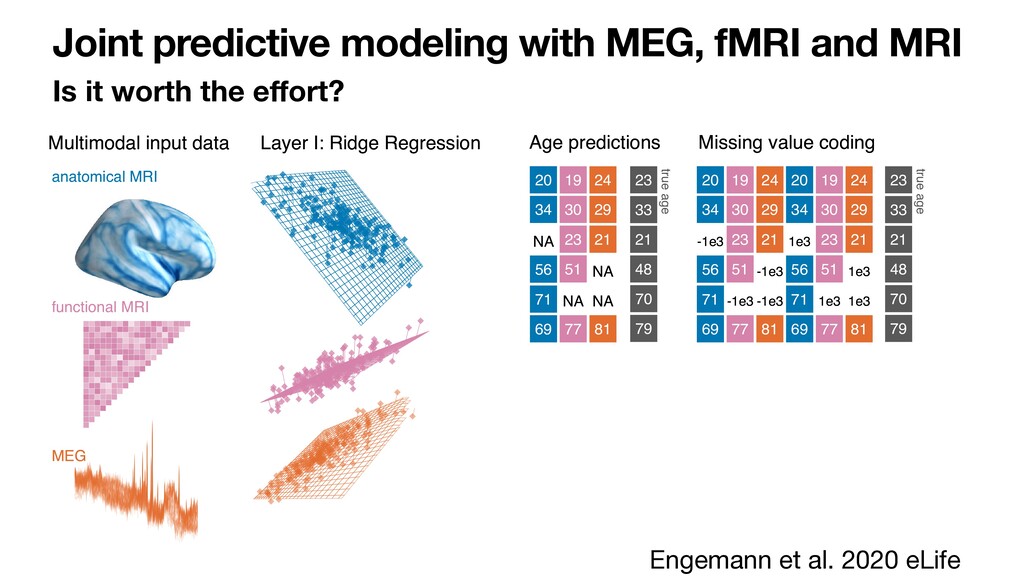
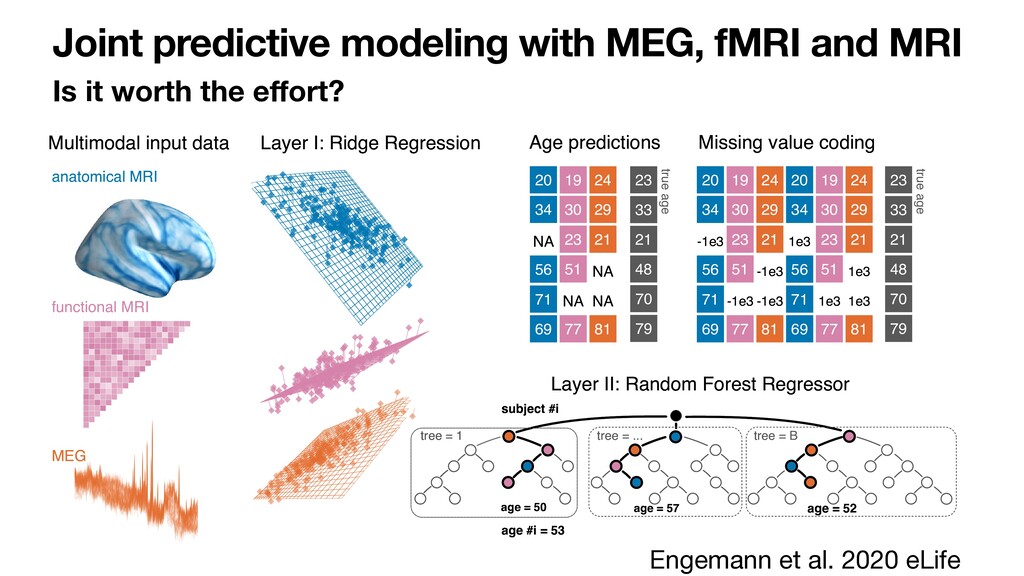
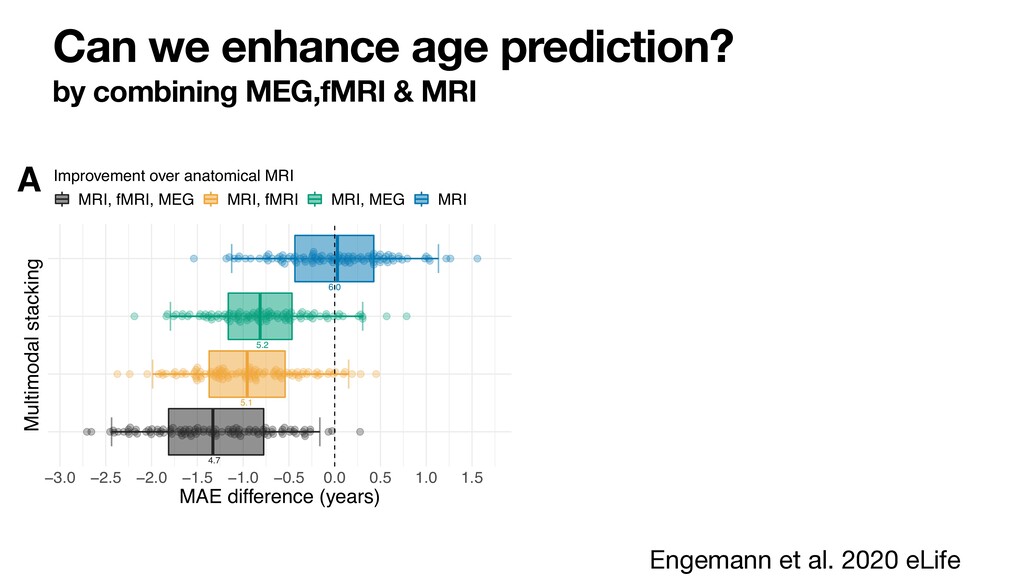
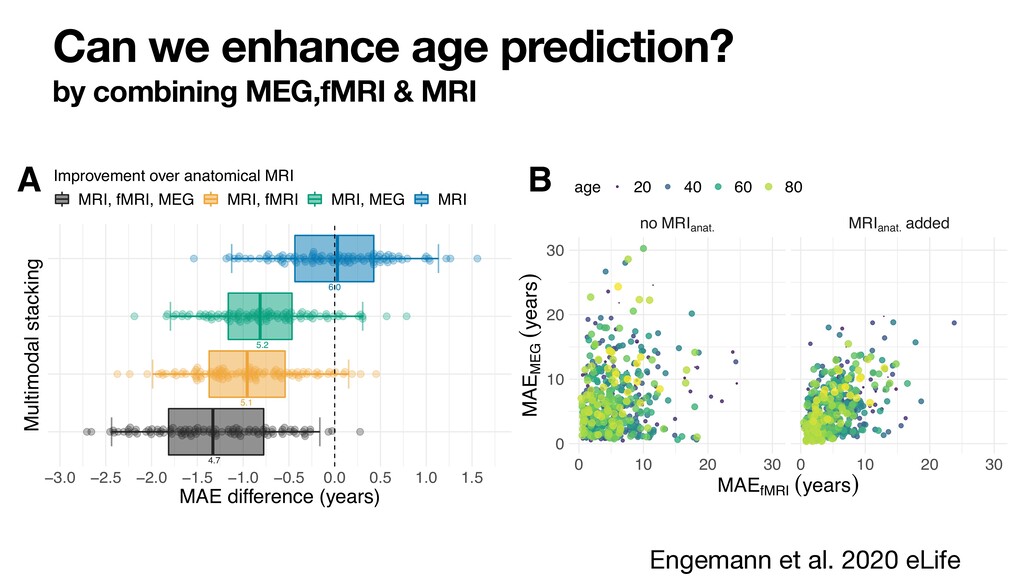
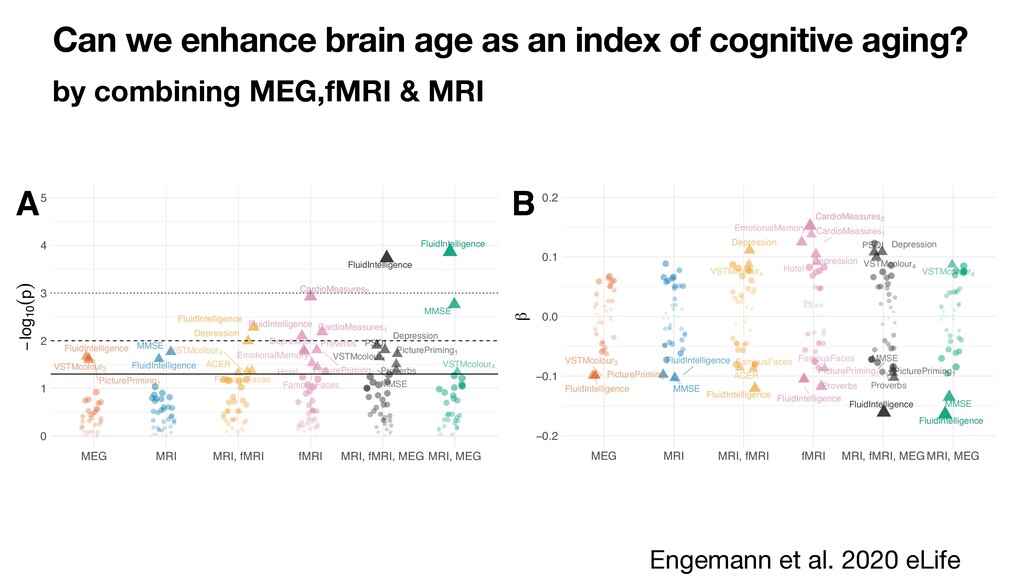
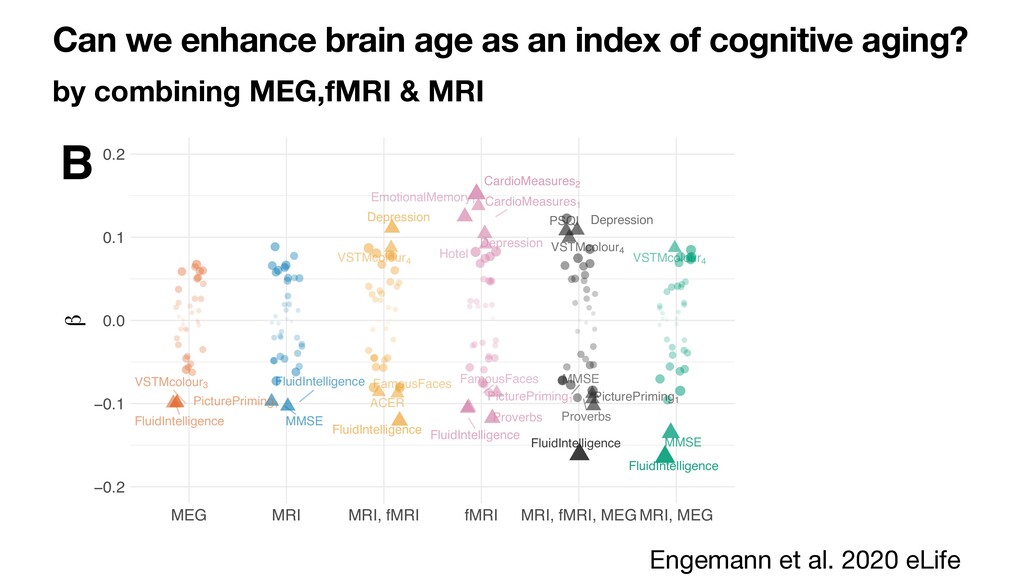
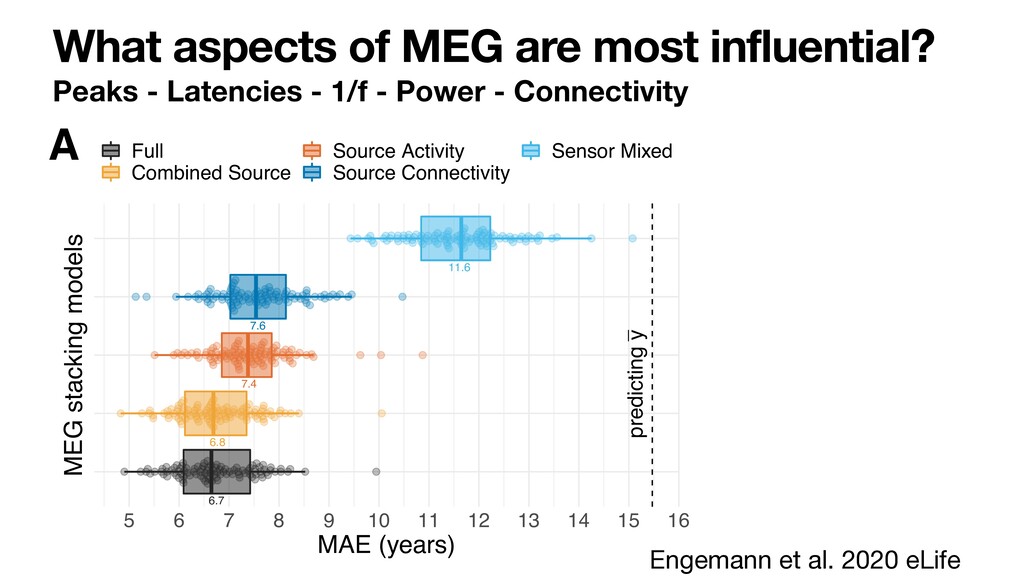
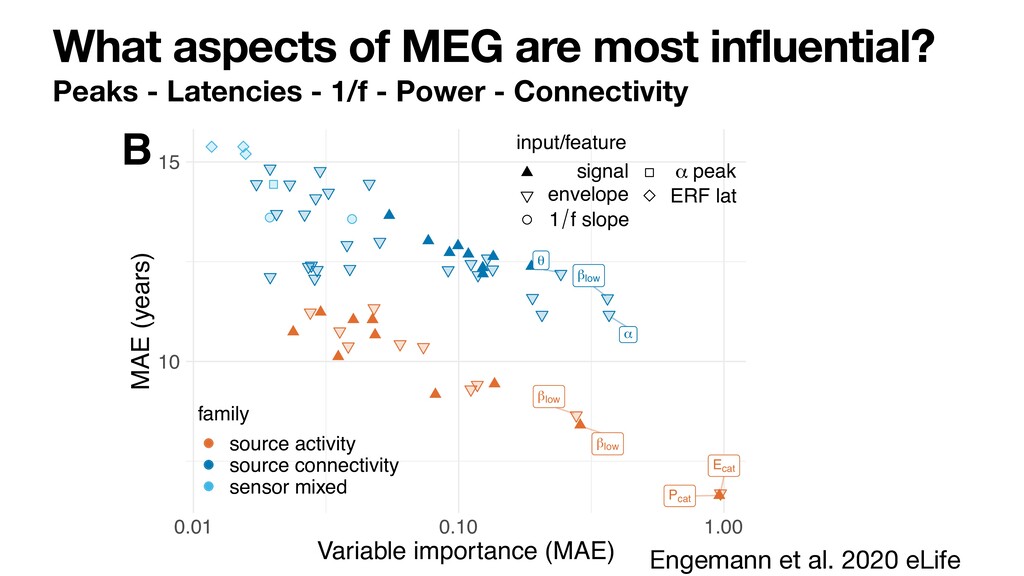
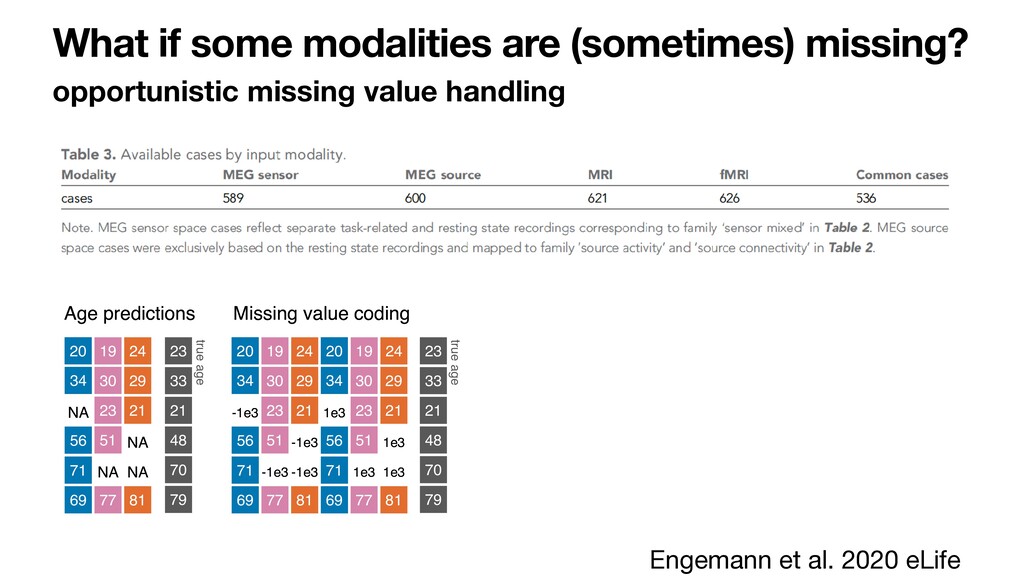
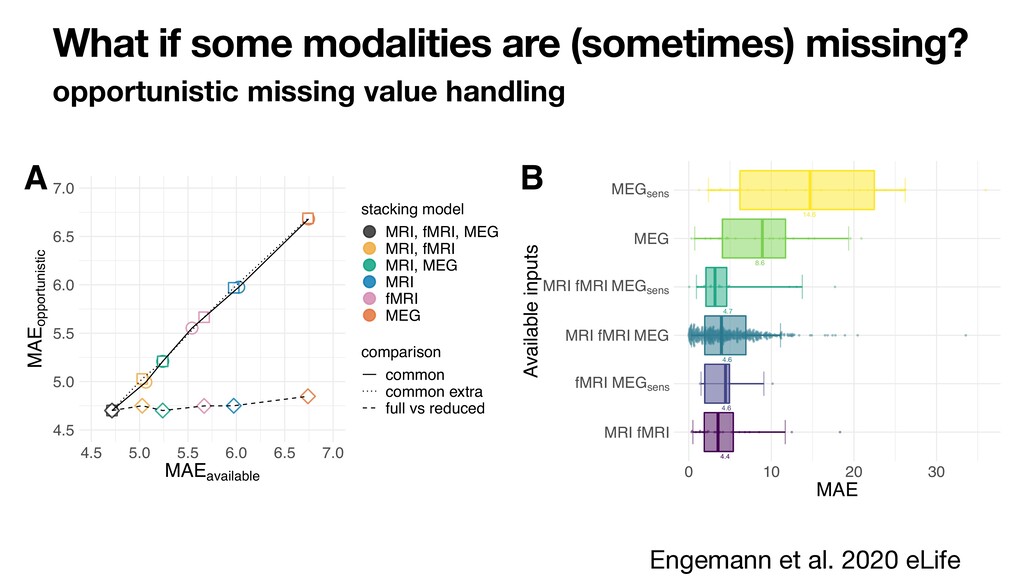
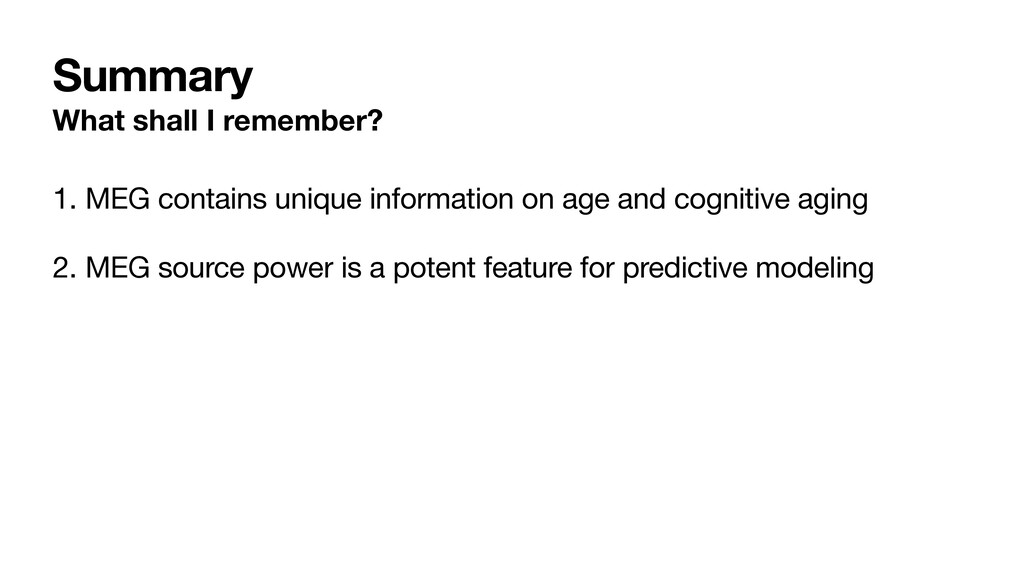
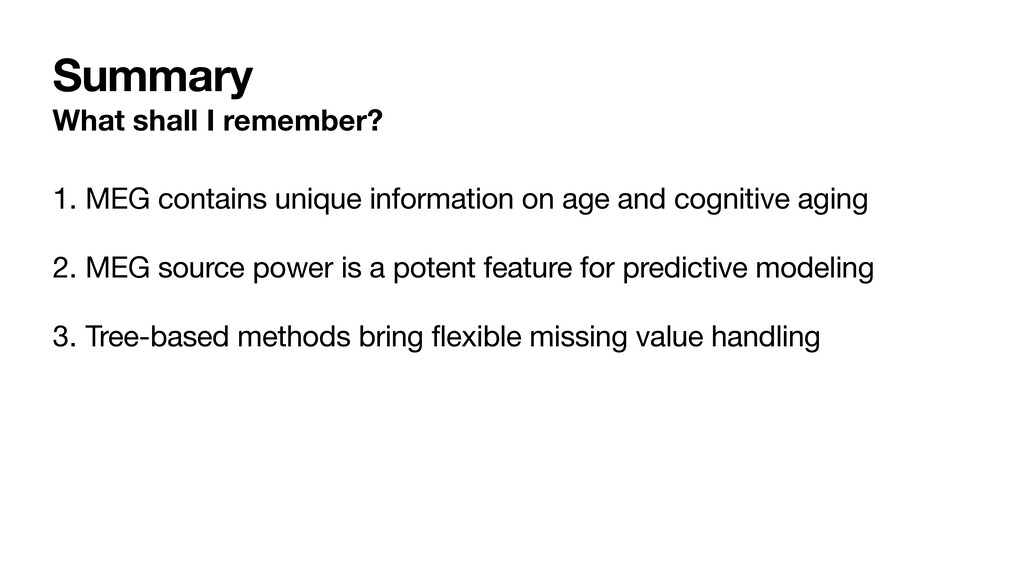
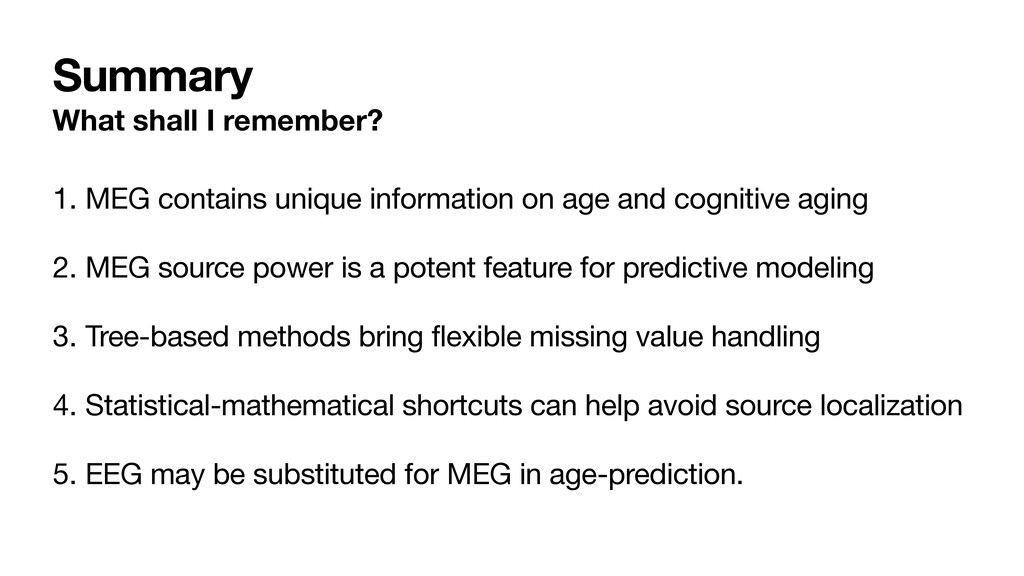
In clinical neuroscience, success often depends on reading out multiple modalities, i.e., brain images and physiological signals. However, clinical reality often sets limits on data availability. Is combining multiple modalities for predictive modeling worth the extra effort when data is regularly incomplete? In [1], we proposed a multi-modal machine learning model with explicit support for handling missing modalities. Combining MRI, fMRI and magnetoencephalography on the Cam-CAN database not only significantly enhanced age prediction but also facilitated detection of age-related cognitive decline captured by the estimated brain age delta. In, particular, combining MEG with MRI yielded enhanced detection of changes in fluid intelligence, sleep quality and memory function, highlighting the complementarity of these distinct biomedical signals. Strikingly, the added value of MEG was best explained by relatively simple features, i.e., the spatial distribution of fast brain rhythms in the beta/alpha range. These results potentially open the door to clinical translation via EEG-technology that is widely available in the hospital setting.
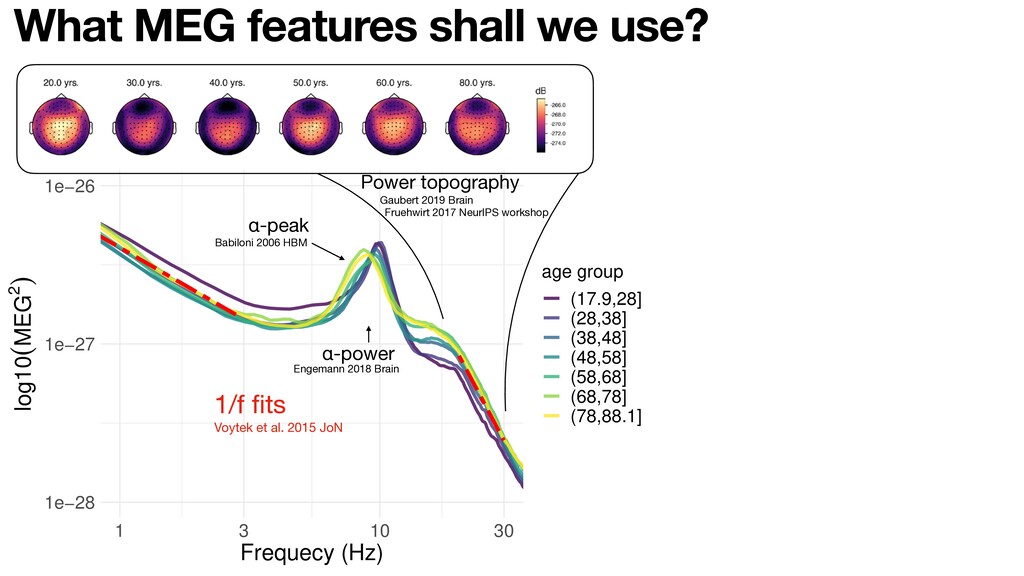
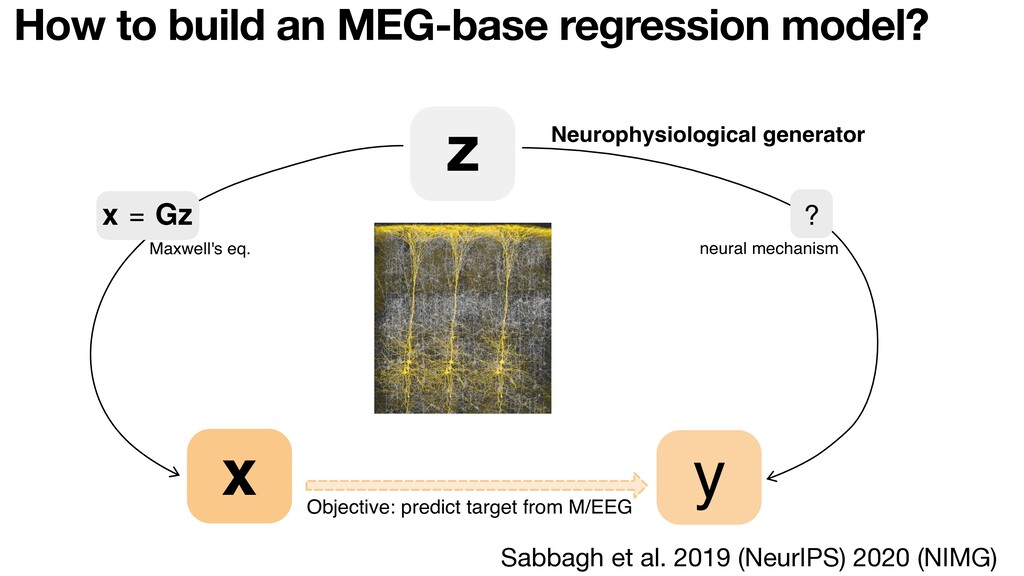
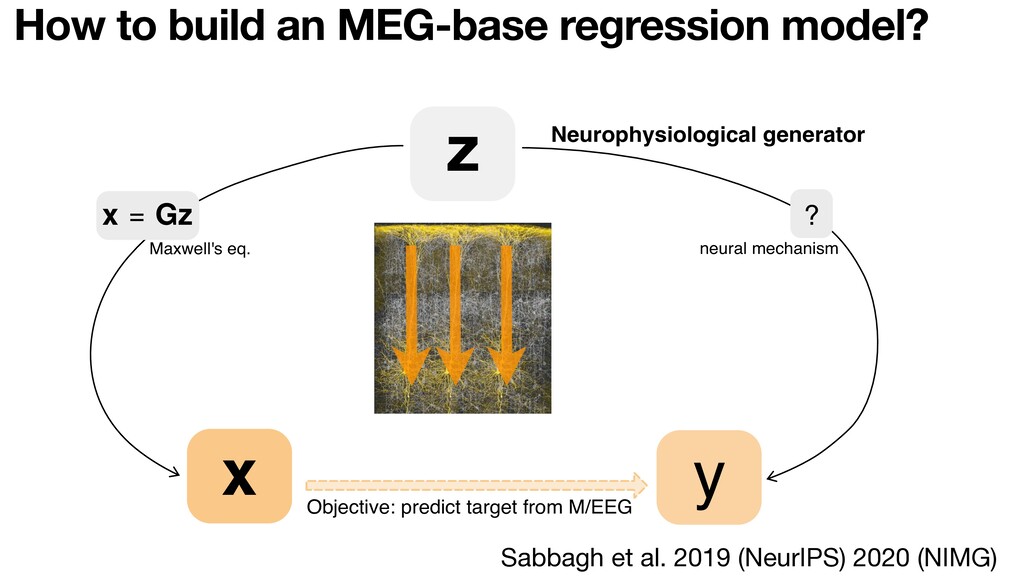
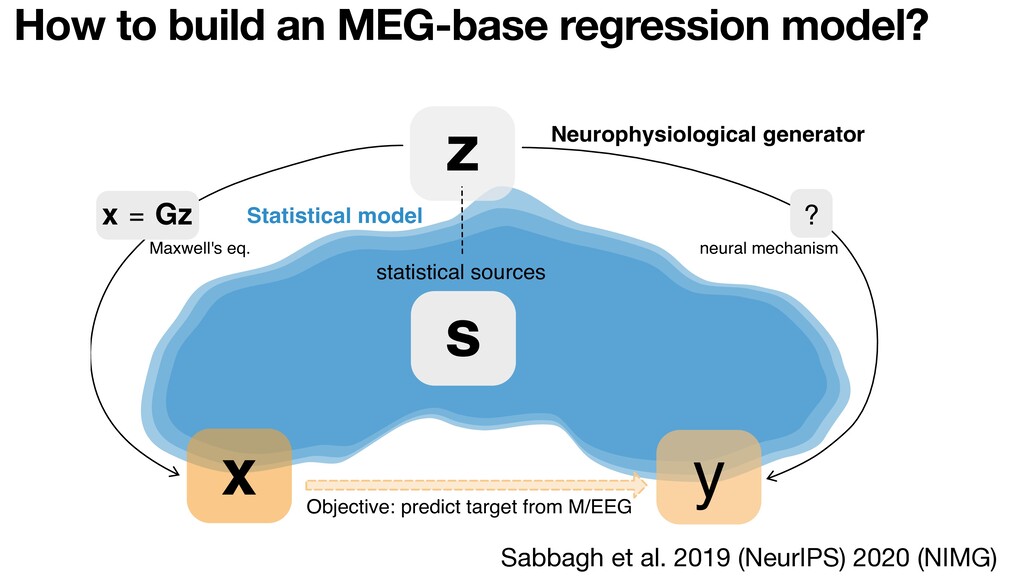
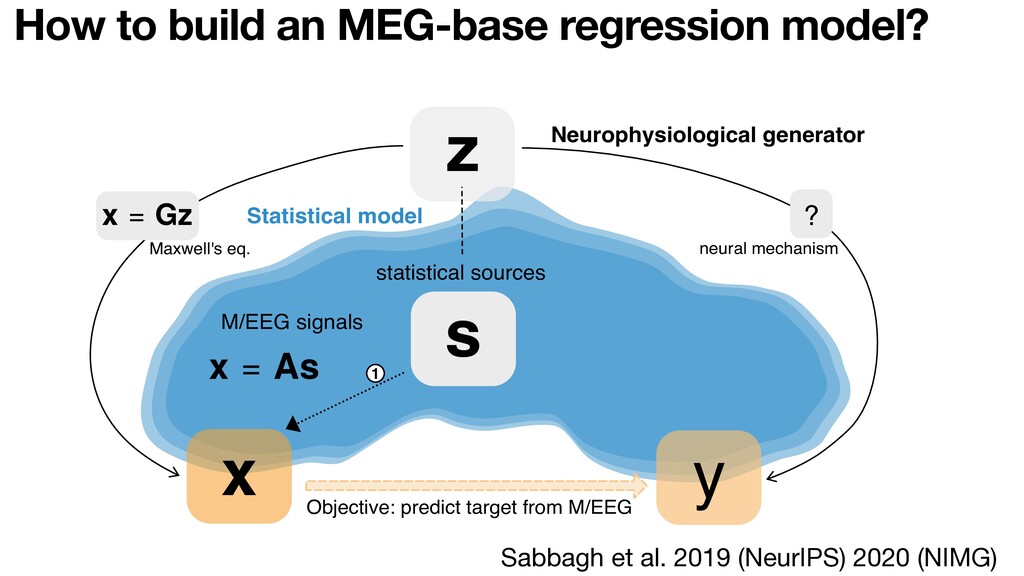
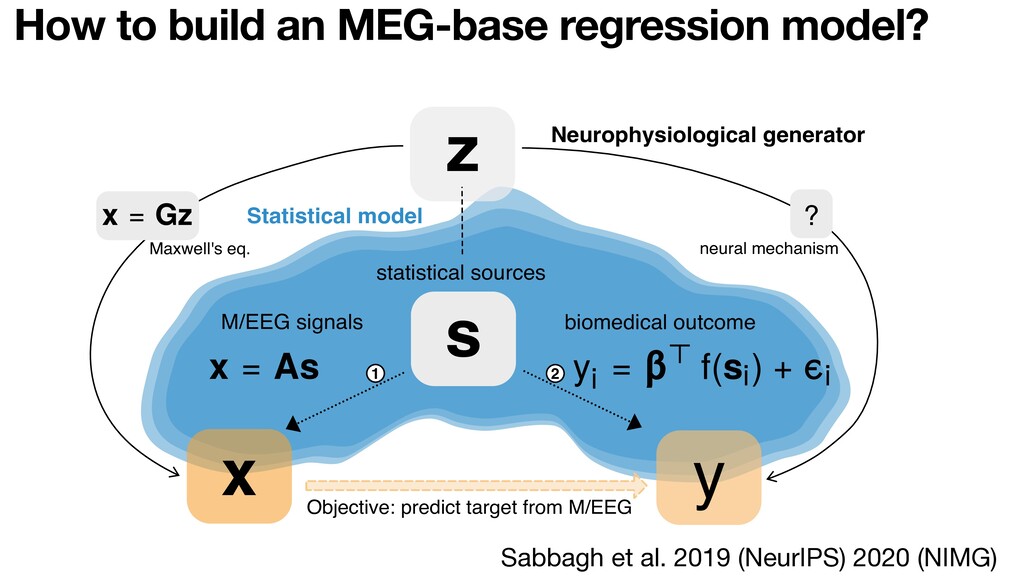
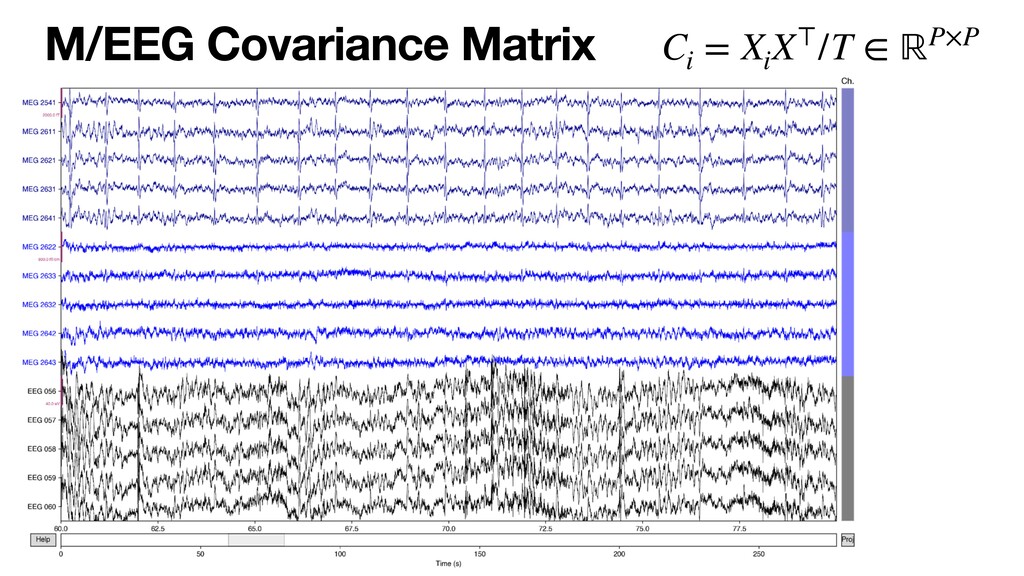
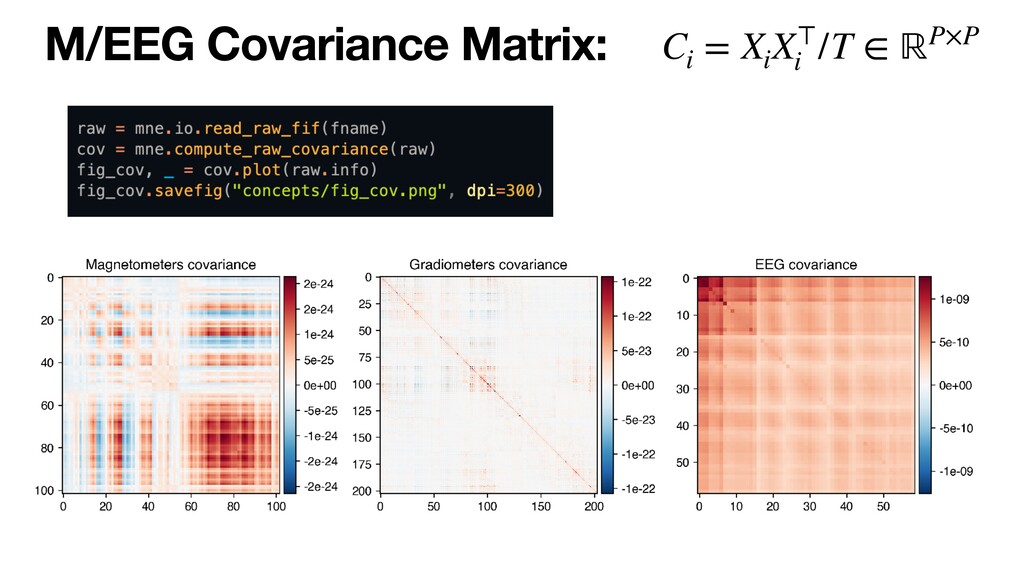
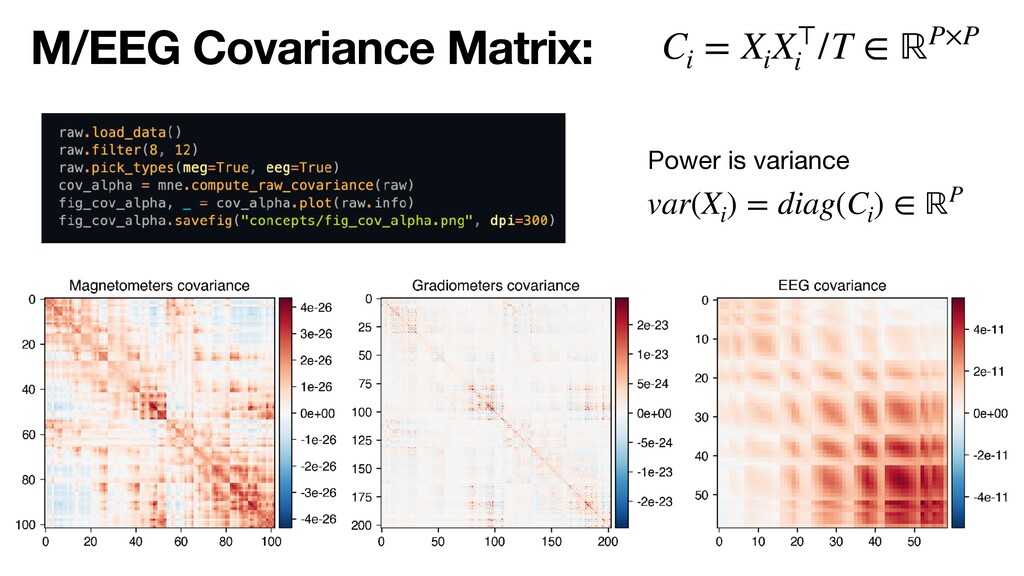
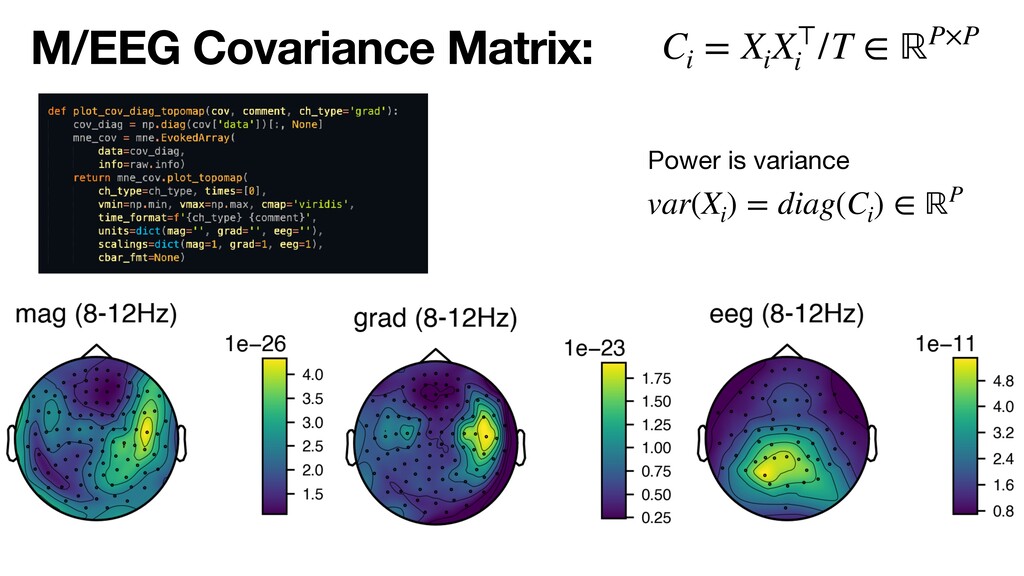
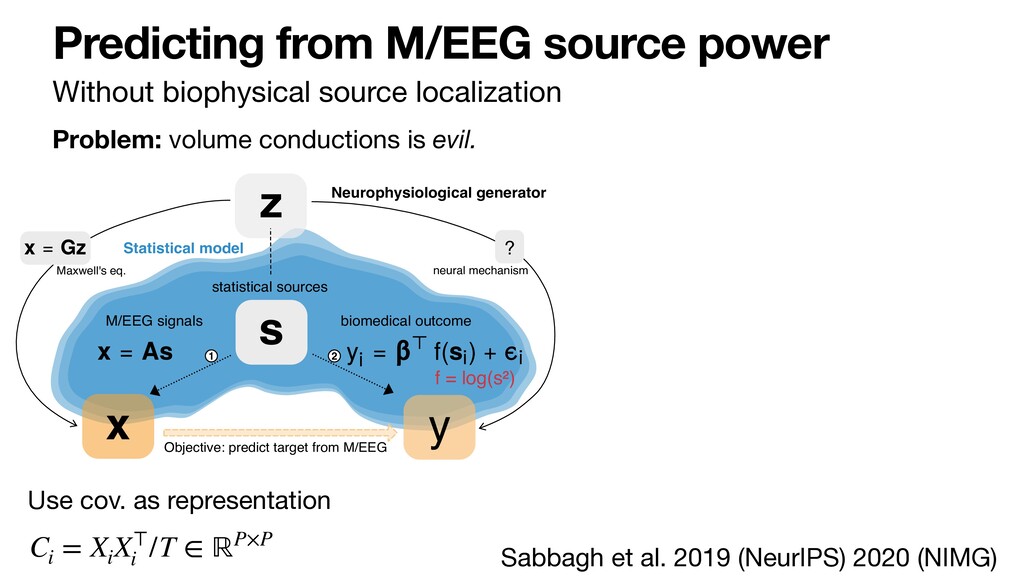
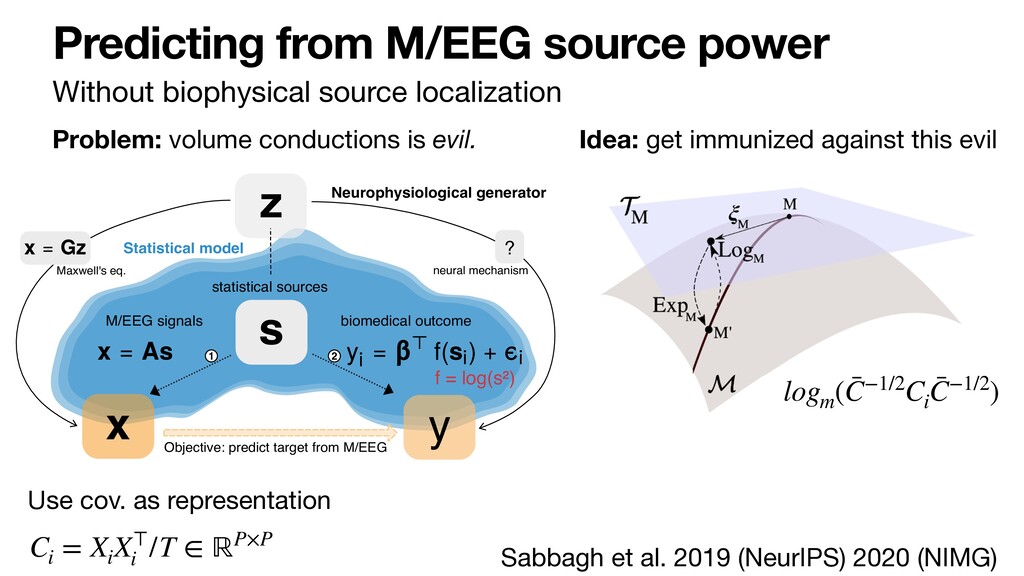
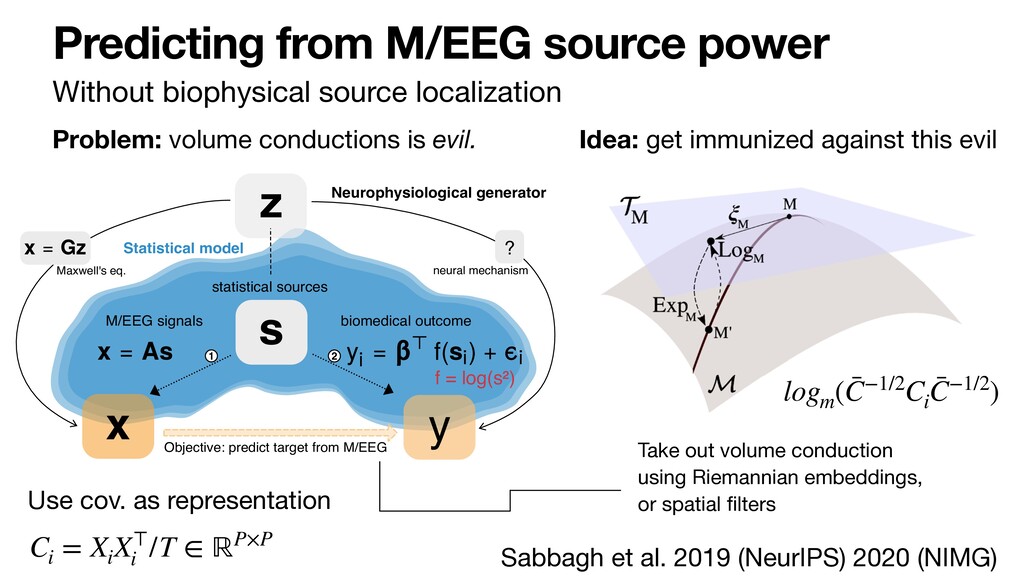
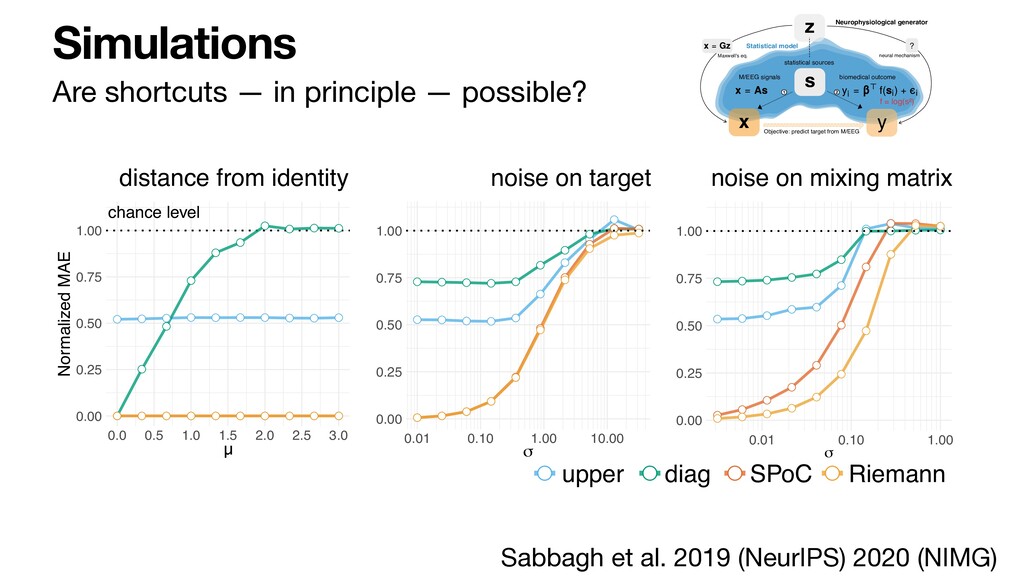
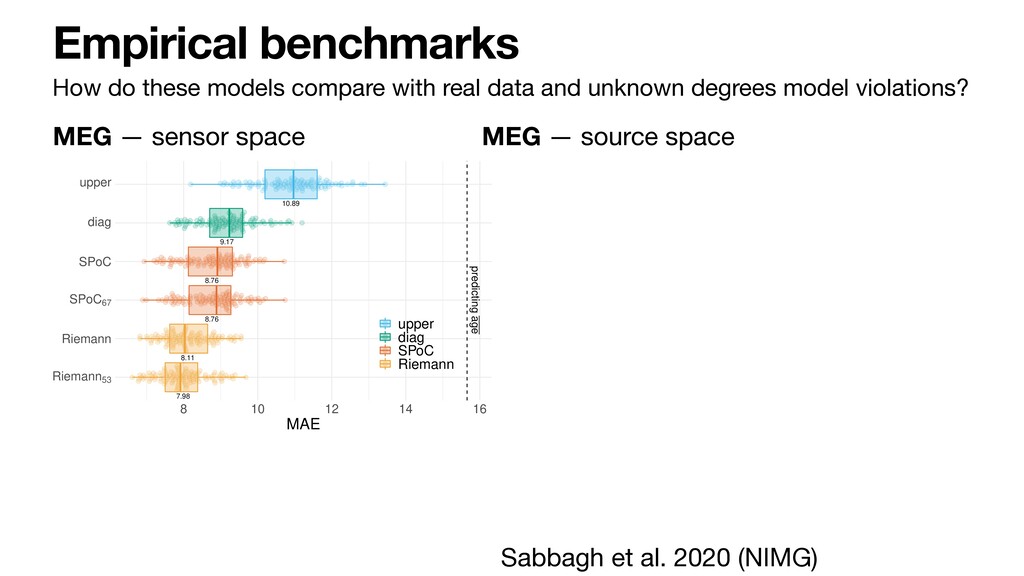
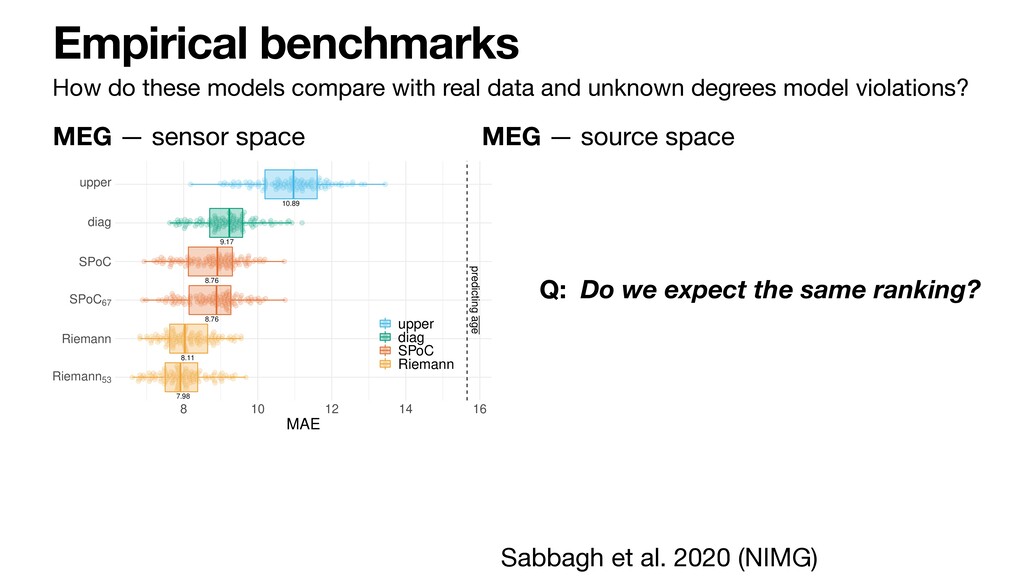
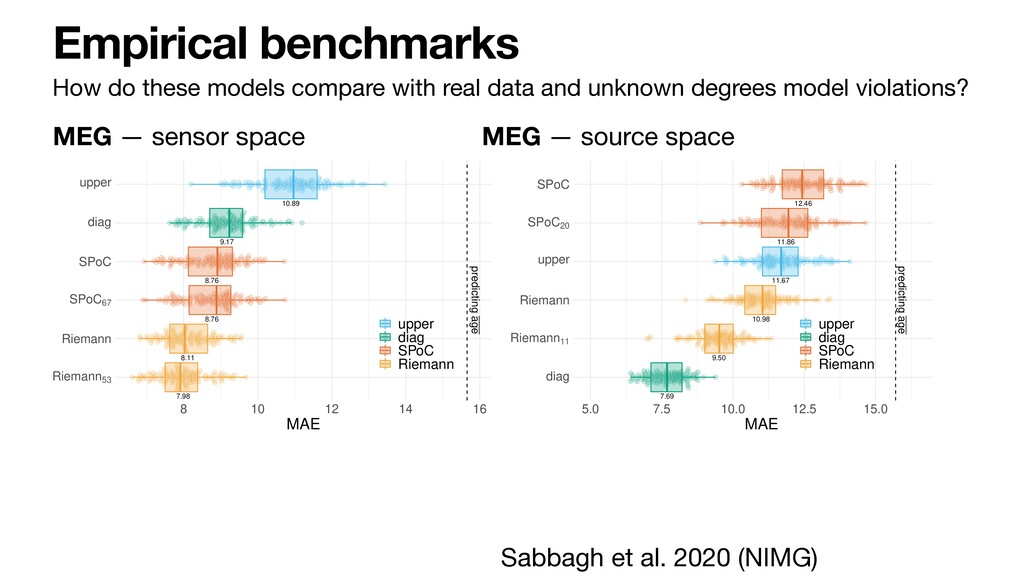
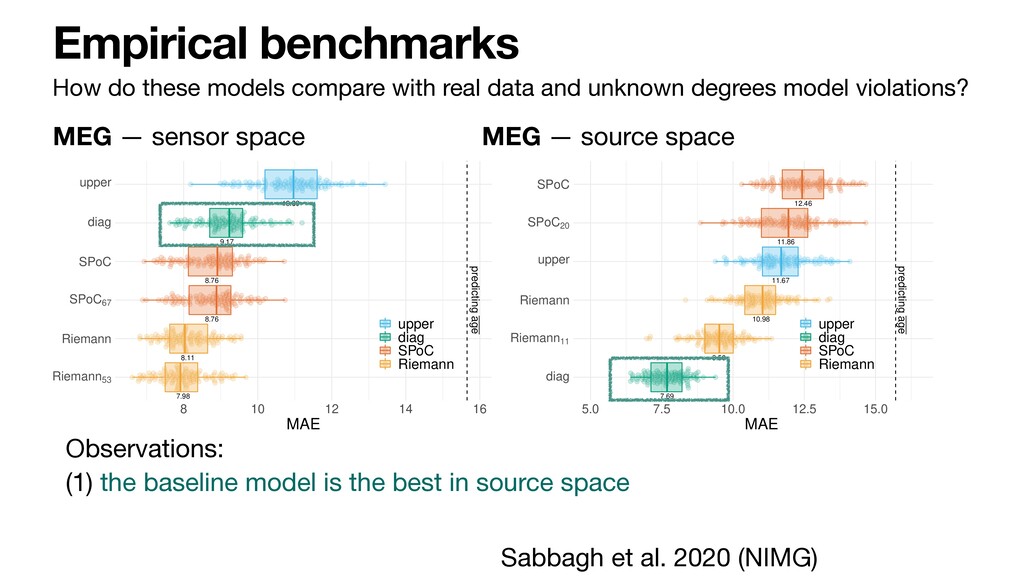
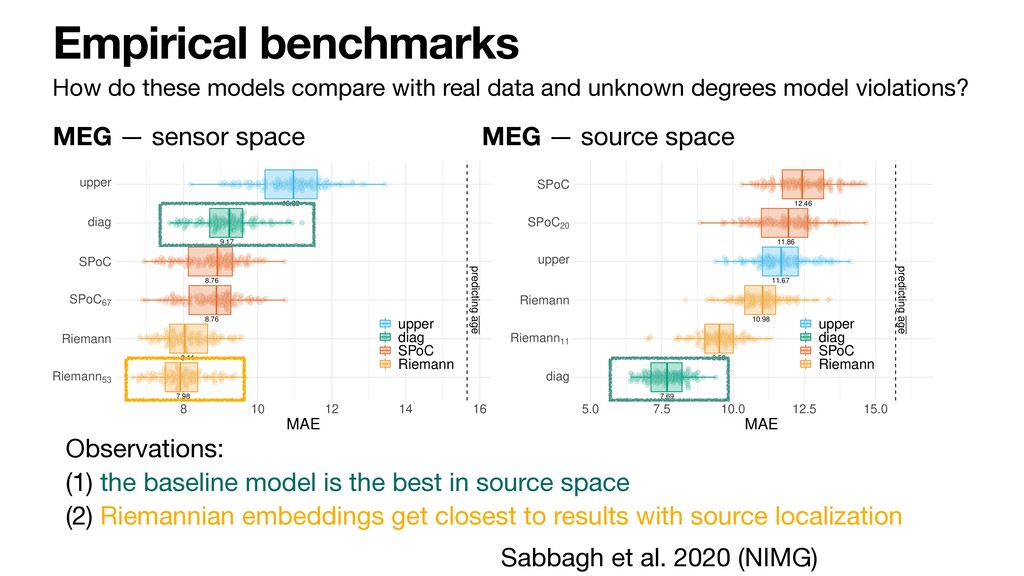
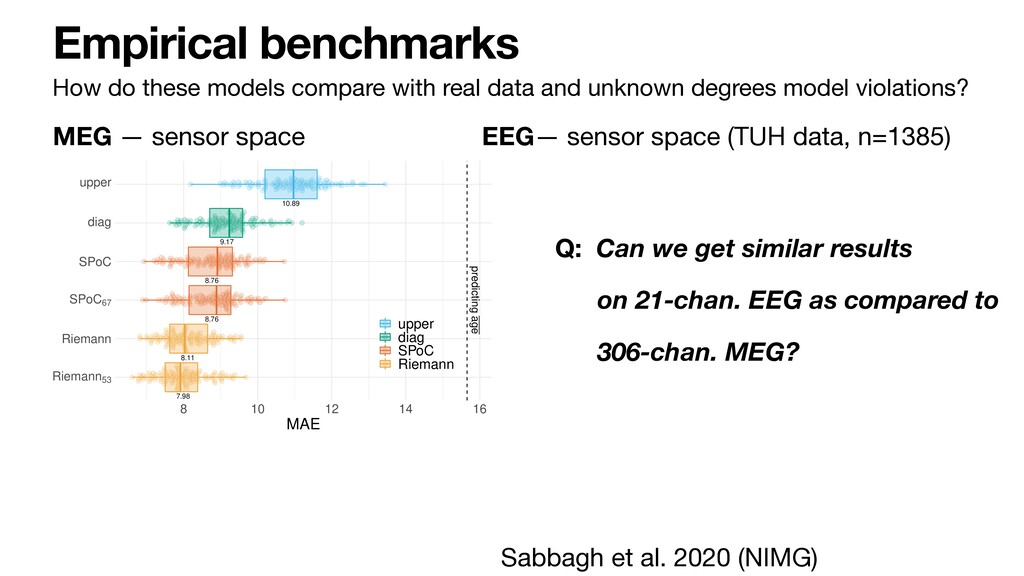
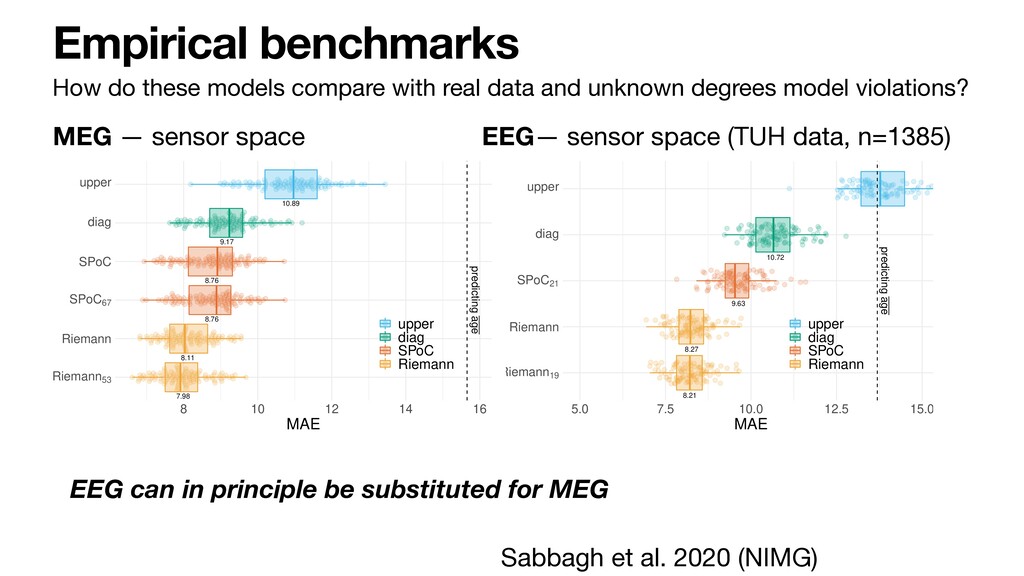
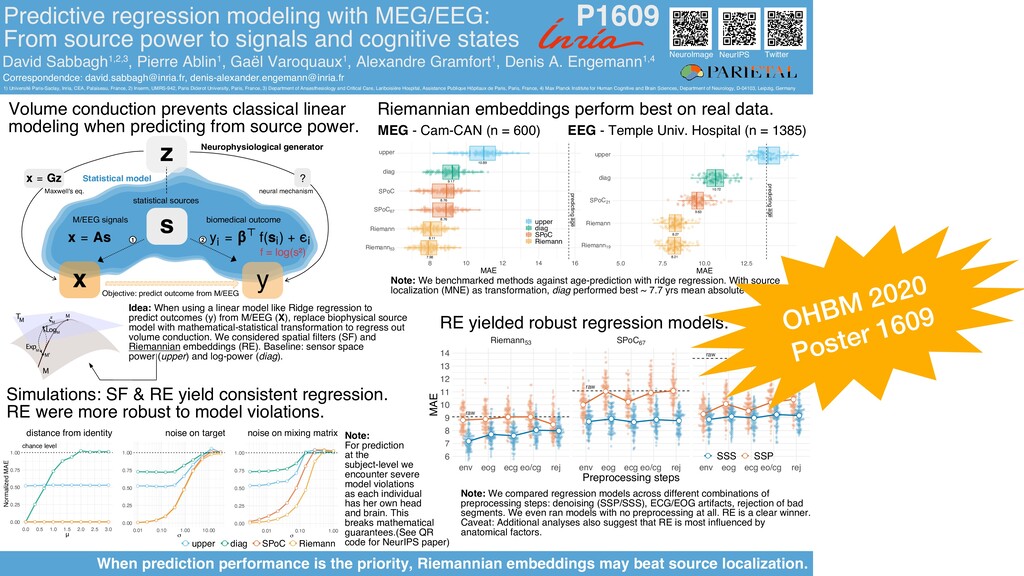
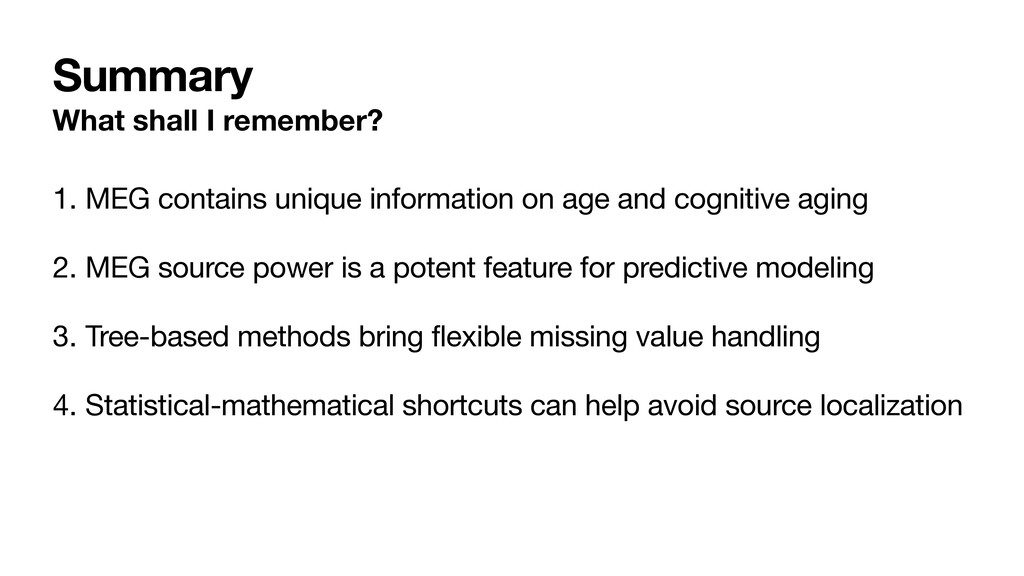
Unfortunately, MRI scans are not always available, closing the door to source modeling with individual anatomy. What then? Call linear models for rescue? While very effective for regressing biomedical outcomes on M/EEG signals, they fail systematically if the cortical generator of an observed behaviour is oscillatory. In that case, volume conduction induces distortions on extracranial signals mitigating the applicability of linear models. However, accurate modeling volume conduction depends on the availability of individual MRIs in the first place. In [2,3] we demonstrate through mathematical analysis, simulations and prediction of age from MEG (Cam-CAN) and EEG (Temple University Hospital) how to, nevertheless, construct predictive linear models in different data generating scenarios. We conclude that Riemannian geometry offers a practical alternative to source localization when predicting from power spectra, potentially enabling end-to-end learning without preprocessing.

References
--------------

[1] Engemann, DA., Kozynets, O., Sabbagh, D., Lemaitre, G., Varoquaux, G., Liem, F., & Gramfort, A. (2020). Combining magnetoencephalography with MRI enhances learning of surrogate-biomarkers. eLife. 9:e54055. 10.7554/eLife.54055
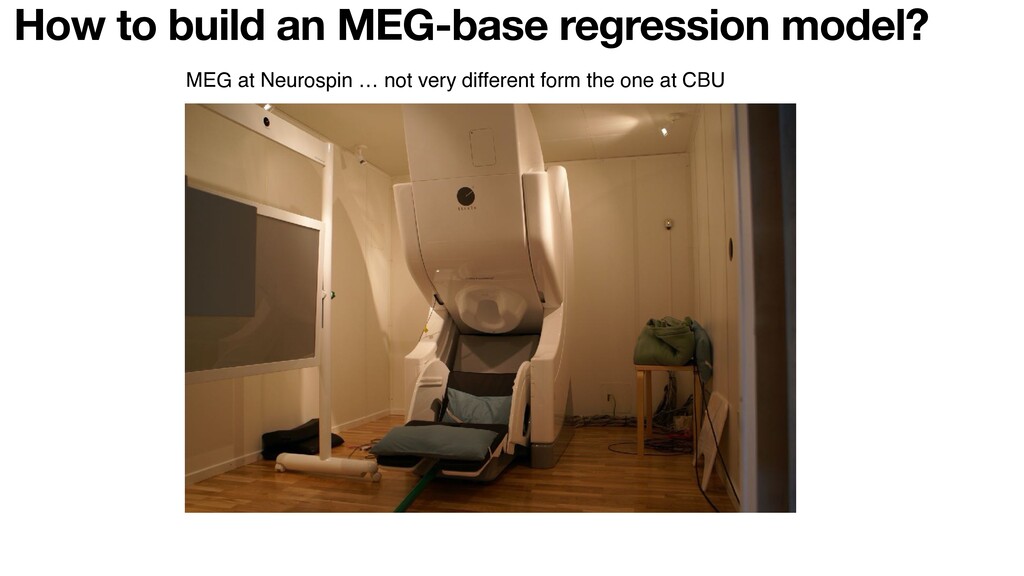
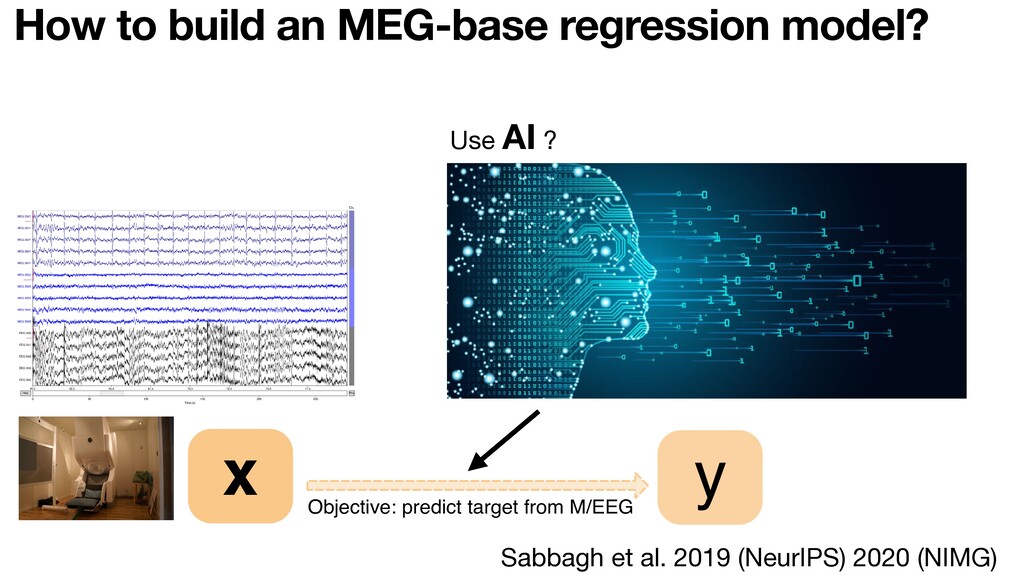
[2] Sabbagh, D., Ablin, P., Varoquaux, G., Gramfort, A., & Engemann, DA. (2019). Manifold-regression to predict from MEG/EEG brain signals without source modeling. In H. Wallach, H. Larochelle, A. Beygelzimer, F. Alché-Buc, E. Fox, & R. Garnett (Eds.), Advances in Neural Information Processing Systems 32 (pp. 7321–7332).
[3] Sabbagh, D., Ablin, P., Varoquaux, G., Gramfort, A., & Engemann, DA. (2020 ). Predictive regression modeling with MEG/EEG: from source power to signals and cognitive states. NeuroImage. https://doi.org/10.1016/j.neuroimage.2020.116893

Denis A. Engemann

June 22, 2020
Tweet

More Decks by Denis A. Engemann

Other Decks in Science

Transcript

  1. Denis A. Engemann, PhD 6/22/20 CBU Cambridge Challenges of building

    clinical biomarkers from M/EEG Multimodal modeling with missing data and robust regression on power spectra [email protected] www.denis-engemann.de github: @dengemann twitter: @dngman
  2. Woo et al. 2017 Nat Neuro Rev. Predicting clinical endpoints

    from multiple brain signals Mass-Univariate statistics Combine multiple inputs into single prediction
  3. Caveat: Prediction accuracy depend on sample size. Often in a

    bad way … Varoquaux 2017, Neuroimage
  4. Bzdok, Engemann et al. 2018 bioRxiv [https://github.com/banilo/inf_vs_pred_2018/] Caveat: inference is

    not prediction Significance does not imply that prediction will work!
  5. Caveat: generative mechanism often unknown Jonas & Kording 2017, PLOS

    Comp. Biol. Different imaging modality, Different generative mechanism …
  6. Caveat: Too few samples of the clinical outcome •Problem: few

    data on precious endpoint, e.g, cognitive decline •Brain Age Delta = predicted age (PAD) - passport age
 •Precocious aging induces cognitive dysfunction (CD) and risk of mortality
 •Typically estimated with MRI!
  7. Caveat: Too few samples of the clinical outcome •Problem: few

    data on precious endpoint, e.g, cognitive decline •Idea: Predict endpoint that’s widely available and exploit its correlation with the actual endpoint of interest, e.g. age •Brain Age Delta = predicted age (PAD) - passport age
 •Precocious aging induces cognitive dysfunction (CD) and risk of mortality
 •Typically estimated with MRI! Solution: Surrogate biomarker.
  8. Surrogate biomarkers: Brain Age Cole et al. Mol. Psych. 2018

    •Problem: few data on precious endpoint, e.g, cognitive decline •Idea: Predict endpoint that’s widely available and exploit its correlation with the actual endpoint of interest, e.g. age •Brain Age Delta = predicted age (PAD) - passport age
 •Precocious aging induces cognitive dysfunction (CD) and risk of mortality
 •Typically estimated with MRI!
  9. Surrogate biomarkers: Brain Age Cole et al. Mol. Psych. 2018

    •Problem: few data on precious endpoint, e.g, cognitive decline •Idea: Predict endpoint that’s widely available and exploit its correlation with the actual endpoint of interest, e.g. age •Brain Age Delta = predicted age (PAD) - passport age
 •Precocious aging induces cognitive dysfunction (CD) and risk of mortality
 •Typically estimated with MRI!
  10. Surrogate biomarkers: Brain Age •Problem: few data on precious endpoint,

    e.g, cognitive decline •Idea: Predict endpoint that’s widely available and exploit its correlation with the actual endpoint of interest, e.g. age •Brain Age Delta = predicted age (PAD) - passport age
 •Precocious aging induces cognitive dysfunction (CD) and risk of mortality
 Liem et al 2017 NIMG Cole et al. Mol. Psych. 2018
  11. Surrogate biomarkers: Brain Age •Problem: few data on precious endpoint,

    e.g, cognitive decline •Idea: Predict endpoint that’s widely available and exploit its correlation with the actual endpoint of interest, e.g. age •Brain Age Delta = predicted age (PAD) - passport age
 •Precocious aging induces cognitive dysfunction (CD) and risk of mortality
 •Typically estimated with MRI! Cole et al. Mol. Psych. 2018 Liem et al 2017 NIMG Liem et al 2017 NIMG
  12. Shall we bother about M/EEG? Brookes et al. 2011, PNAS

    fMRI resting state networks can be reconstructed from MEG
  13. Shall we bother about M/EEG? Hipp & Siegel 2015, Curr.

    Biol. BOLD and MEG show spatial correlations across many frequency bands.
  14. Perhaps … Kumral et al. 2020 NIMG BOLD and EEG

    signal variability at rest differently relate to aging
  15. Perhaps we should … Nentwich et al. 2020 NIMG fMRI

    and EEG connectivity is different.
  16. Perhaps we should bother … Gaubert et al. 2019 Brain

    EEG-signatures in preclincal Alzheimer’s disease
  17. Joint predictive modeling with MEG, fMRI and MRI Is it

    worth the effort? Multimodal input data anatomical MRI functional MRI MEG Layer I: Ridge Regression Age predictions Missing value coding Layer II: Random Forest Regressor tree = 1 tree = 1 subject #i age = 50 age #i = 53 age = 57 age = 5 tree = ... tree = B Multimodal input data anatomical MRI functional MRI MEG Layer I: Ridge Regression Age predictions Missing value coding Layer II: Random Forest Regressor tree = 1 tree = 1 subject #i age = 50 age #i = 53 age = 57 age = 5 tree = ... tree = B 2 1 2 21 A A A A 1 2 2 2 21 1 1 2 1 1e 1e 1e 1e 1 2 2 2 21 1 1 2 1 1e 1e 1e 1e 1 2 2 2 21 1 1 true age 2 21 true age 2 1 A A A A 1 2 2 2 21 1 1 2 1 1e 1e 1e 1e 1 2 2 2 21 1 1 2 1 1e 1e 1e 1e 1 2 2 2 21 1 1 Engemann et al. 2020 eLife
  18. MEG system at Neurospin … not very different form the

    one at CBU How to get M/EEG signals?
  19. 1e−28 1e−27 1e−26 1 3 10 30 Frequecy (Hz) log10(MEG2)

    age group (17.9,28] (28,38] (38,48] (48,58] (58,68] (68,78] (78,88.1] What MEG features shall we use?
  20. 1e−28 1e−27 1e−26 1 3 10 30 Frequecy (Hz) log10(MEG2)

    age group (17.9,28] (28,38] (38,48] (48,58] (58,68] (68,78] (78,88.1] α-power Engemann 2018 Brain What MEG features shall we use?
  21. 1e−28 1e−27 1e−26 1 3 10 30 Frequecy (Hz) log10(MEG2)

    age group (17.9,28] (28,38] (38,48] (48,58] (58,68] (68,78] (78,88.1] α-peak α-power Babiloni 2006 HBM Engemann 2018 Brain What MEG features shall we use?
  22. 1e−28 1e−27 1e−26 1 3 10 30 Frequecy (Hz) log10(MEG2)

    age group (17.9,28] (28,38] (38,48] (48,58] (58,68] (68,78] (78,88.1] α-peak Power topography Gaubert 2019 Brain Fruehwirt 2017 NeurIPS workshop α-power Babiloni 2006 HBM Engemann 2018 Brain What MEG features shall we use?
  23. 1e−28 1e−27 1e−26 1 3 10 30 Frequecy (Hz) log10(MEG2)

    age group (17.9,28] (28,38] (38,48] (48,58] (58,68] (68,78] (78,88.1] 1/f fits Voytek et al. 2015 JoN α-peak Power topography Gaubert 2019 Brain Fruehwirt 2017 NeurIPS workshop α-power Babiloni 2006 HBM Engemann 2018 Brain What MEG features shall we use?
  24. 1e−28 1e−27 1e−26 1 3 10 30 Frequecy (Hz) log10(MEG2)

    age group (17.9,28] (28,38] (38,48] (48,58] (58,68] (68,78] (78,88.1] 1/f fits Voytek et al. 2015 JoN α-peak Power topography Gaubert 2019 Brain Fruehwirt 2017 NeurIPS workshop α-power Babiloni 2006 HBM Engemann 2018 Brain Other classical features • Evoked latency (Price 2017 Nat Coms) • 1/f topography Enhancements • Source power (Sabbagh 2019 NeurIPS) • Power Envelope Correlations (Khan 2018 NIMG) • A few options: orthogonalization, covariance • Power envelope power … What MEG features shall we use?
  25. 1e−28 1e−27 1e−26 1 3 10 30 Frequecy (Hz) log10(MEG2)

    age group (17.9,28] (28,38] (38,48] (48,58] (58,68] (68,78] (78,88.1] 1/f fits Voytek et al. 2015 JoN α-peak Power topography Gaubert 2019 Brain Fruehwirt 2017 NeurIPS workshop α-power Babiloni 2006 HBM Engemann 2018 Brain Other classical features • Evoked latency (Price 2017 Nat Coms) • 1/f topography Enhancements: Source Analysis • Source power (Sabbagh 2019 NeurIPS) • Power Envelope Correlations (Khan 2018 NIMG) • A few options: orthogonalization, covariance • Power envelope power … What MEG features shall we use?
  26. How to build an MEG-base regression model? MEG at Neurospin

    … not very different form the one at CBU
  27. How to build an MEG-base regression model? Objective: predict target

    fro x Sabbagh et al. 2019 (NeurIPS) 2020 (NIMG)
  28. How to build an MEG-base regression model? Objective: predict target

    fro x Sabbagh et al. 2019 (NeurIPS) 2020 (NIMG) Use AI ?
  29. How to build an MEG-base regression model? Objective: predict target

    fro x Sabbagh et al. 2019 (NeurIPS) 2020 (NIMG) Use AI ? NOPE
  30. How to build an MEG-base regression model? z ? Objective:

    predict target from M/EEG Neurophysiological genera or Maxwell's eq. neural mechanism Sabbagh et al. 2019 (NeurIPS) 2020 (NIMG)
  31. How to build an MEG-base regression model? z ? Objective:

    predict target from M/EEG Neurophysiological genera or Maxwell's eq. neural mechanism Sabbagh et al. 2019 (NeurIPS) 2020 (NIMG)
  32. How to build an MEG-base regression model? z ? Objective:

    predict target from M/EEG Neurophysiological genera or Maxwell's eq. neural mechanism Sabbagh et al. 2019 (NeurIPS) 2020 (NIMG) Primary currents
  33. How to build an MEG-base regression model? z s ?

    Objective: predict target from M/EEG Neurophysiological genera or a is ical o el statistical sources Maxwell's eq. neural mechanism Sabbagh et al. 2019 (NeurIPS) 2020 (NIMG)
  34. How to build an MEG-base regression model? z s ?

    Objective: predict target from M/EEG Neurophysiological genera or a is ical o el statistical sources M/EEG signals Maxwell's eq. neural mechanism Sabbagh et al. 2019 (NeurIPS) 2020 (NIMG)
  35. How to build an MEG-base regression model? z s ?

    Objective: predict target from M/EEG Neurophysiological genera or a is ical o el biomedical outcome statistical sources M/EEG signals Maxwell's eq. neural mechanism Sabbagh et al. 2019 (NeurIPS) 2020 (NIMG)
  36. How to build an MEG-base regression model? z s ?

    Objective: predict target from M/EEG Neurophysiological genera or a is ical o el biomedical outcome statistical sources M/EEG signals Maxwell's eq. neural mechanism f log s Sabbagh et al. 2019 (NeurIPS) 2020 (NIMG)
  37. Joint predictive modeling with MEG, fMRI and MRI Is it

    worth the effort? Multimodal input data anatomical MRI functional MRI MEG Layer I: Ridge Regression Age predictions Missing value coding Layer II: Random Forest Regressor tree = 1 tree = 1 subject #i age = 50 age #i = 53 age = 57 age = 5 tree = ... tree = B Multimodal input data anatomical MRI functional MRI MEG Layer I: Ridge Regression Age predictions Missing value coding Layer II: Random Forest Regressor tree = 1 tree = 1 subject #i age = 50 age #i = 53 age = 57 age = 5 tree = ... tree = B 2 1 2 21 A A A A 1 2 2 2 21 1 1 2 1 1e 1e 1e 1e 1 2 2 2 21 1 1 2 1 1e 1e 1e 1e 1 2 2 2 21 1 1 true age 2 21 true age 2 1 A A A A 1 2 2 2 21 1 1 2 1 1e 1e 1e 1e 1 2 2 2 21 1 1 2 1 1e 1e 1e 1e 1 2 2 2 21 1 1 Engemann et al. 2020 eLife
  38. Joint predictive modeling with MEG, fMRI and MRI Is it

    worth the effort? Multimodal input data anatomical MRI functional MRI MEG Layer I: Ridge Regression Age predictions Missing value coding Layer II: Random Forest Regressor tree = 1 tree = 1 subject #i age = 50 age #i = 53 age = 57 age = 5 tree = ... tree = B Multimodal input data anatomical MRI functional MRI MEG Layer I: Ridge Regression Age predictions Missing value coding Layer II: Random Forest Regressor tree = 1 tree = 1 subject #i age = 50 age #i = 53 age = 57 age = 5 tree = ... tree = B 2 1 2 21 A A A A 1 2 2 2 21 1 1 2 1 1e 1e 1e 1e 1 2 2 2 21 1 1 2 1 1e 1e 1e 1e 1 2 2 2 21 1 1 true age 2 21 true age 2 1 A A A A 1 2 2 2 21 1 1 2 1 1e 1e 1e 1e 1 2 2 2 21 1 1 2 1 1e 1e 1e 1e 1 2 2 2 21 1 1 Engemann et al. 2020 eLife
  39. Joint predictive modeling with MEG, fMRI and MRI Is it

    worth the effort? Multimodal input data anatomical MRI functional MRI MEG Layer I: Ridge Regression Age predictions Missing value coding Layer II: Random Forest Regressor tree = 1 tree = 1 subject #i age = 50 age #i = 53 age = 57 age = 5 tree = ... tree = B Multimodal input data anatomical MRI functional MRI MEG Layer I: Ridge Regression Age predictions Missing value coding Layer II: Random Forest Regressor tree = 1 tree = 1 subject #i age = 50 age #i = 53 age = 57 age = 5 tree = ... tree = B 2 1 2 21 A A A A 1 2 2 2 21 1 1 2 1 1e 1e 1e 1e 1 2 2 2 21 1 1 2 1 1e 1e 1e 1e 1 2 2 2 21 1 1 true age 2 21 true age 2 1 A A A A 1 2 2 2 21 1 1 2 1 1e 1e 1e 1e 1 2 2 2 21 1 1 2 1 1e 1e 1e 1e 1 2 2 2 21 1 1 Engemann et al. 2020 eLife
  40. Joint predictive modeling with MEG, fMRI and MRI Is it

    worth the effort? Multimodal input data anatomical MRI functional MRI MEG Layer I: Ridge Regression Age predictions Missing value coding Layer II: Random Forest Regressor tree = 1 tree = 1 subject #i age = 50 age #i = 53 age = 57 age = 5 tree = ... tree = B Multimodal input data anatomical MRI functional MRI MEG Layer I: Ridge Regression Age predictions Missing value coding Layer II: Random Forest Regressor tree = 1 tree = 1 subject #i age = 50 age #i = 53 age = 57 age = 5 tree = ... tree = B 2 1 2 21 A A A A 1 2 2 2 21 1 1 2 1 1e 1e 1e 1e 1 2 2 2 21 1 1 2 1 1e 1e 1e 1e 1 2 2 2 21 1 1 true age 2 21 true age 2 1 A A A A 1 2 2 2 21 1 1 2 1 1e 1e 1e 1e 1 2 2 2 21 1 1 2 1 1e 1e 1e 1e 1 2 2 2 21 1 1 Engemann et al. 2020 eLife
  41. Joint predictive modeling with MEG, fMRI and MRI Is it

    worth the effort? Multimodal input data anatomical MRI functional MRI MEG Layer I: Ridge Regression Age predictions Missing value coding Layer II: Random Forest Regressor tree = 1 tree = 1 subject #i age = 50 age #i = 53 age = 57 age = 5 tree = ... tree = B Multimodal input data anatomical MRI functional MRI MEG Layer I: Ridge Regression Age predictions Missing value coding Layer II: Random Forest Regressor tree = 1 tree = 1 subject #i age = 50 age #i = 53 age = 57 age = 5 tree = ... tree = B 2 1 2 21 A A A A 1 2 2 2 21 1 1 2 1 1e 1e 1e 1e 1 2 2 2 21 1 1 2 1 1e 1e 1e 1e 1 2 2 2 21 1 1 true age 2 21 true age 2 1 A A A A 1 2 2 2 21 1 1 2 1 1e 1e 1e 1e 1 2 2 2 21 1 1 2 1 1e 1e 1e 1e 1 2 2 2 21 1 1 Engemann et al. 2020 eLife
  42. Can we enhance age prediction? by combining MEG,fMRI & MRI

    4.7 5.1 5.2 6.0 −3.0 −2.5 −2.0 −1.5 −1.0 −0.5 0.0 0.5 1.0 1.5 MAE difference (years) Multimodal stacking m ro ement o er anatomical M M fM ME M fM M ME M no M anat. M anat. added 0 10 20 30 0 10 20 30 0 10 20 30 MAEfM (years) MAEME (years) age 20 40 60 0 A B Engemann et al. 2020 eLife
  43. Can we enhance age prediction? by combining MEG,fMRI & MRI

    4.7 5.1 5.2 6.0 −3.0 −2.5 −2.0 −1.5 −1.0 −0.5 0.0 0.5 1.0 1.5 MAE difference (years) Multimodal stacking m ro ement o er anatomical M M fM ME M fM M ME M no M anat. M anat. added 0 10 20 30 0 10 20 30 0 10 20 30 MAEfM (years) MAEME (years) age 20 40 60 0 A B Engemann et al. 2020 eLife
  44. Can we enhance brain age as an index of cognitive

    aging? by combining MEG,fMRI & MRI FluidIntelligence Depression MMSE PicturePriming1 Proverbs PSQI VSTMcolour4 ACER FluidIntelligence FamousFaces Depression VSTMcolour4 FluidIntelligence MMSE VSTMcolour4 CardioMeasures1 CardioMeasures FluidIntelligence EmotionalMemor 1 FamousFaces Depression otel PicturePriming1 Proverbs FluidIntelligence PicturePriming1 VSTMcolour FluidIntelligence MMSE 1 4 ME MRI MRI MRI MRI MRI MRI ME MRI ME −log1 (p) FluidIntelligence Depression MMSE PicturePriming1 Proverbs PSQI VSTMcolour4 ACER FluidIntelligence FamousFaces Depression VSTMcolour4 FluidIntelligence MMSE VSTMcolour4 CardioMeasures1 CardioMeasures FluidIntelligence EmotionalMemor 1 FamousFaces Depression otel PicturePriming1 Proverbs FluidIntelligence PicturePriming1 VSTMcolour FluidIntelligence MMSE 1 1 ME MRI MRI MRI MRI MRI MRI ME MRI ME β A B Engemann et al. 2020 eLife
  45. Can we enhance brain age as an index of cognitive

    aging? by combining MEG,fMRI & MRI FluidIntelligence Depression MMSE PicturePriming1 Proverbs PSQI VSTMcolour4 ACER FluidIntelligence FamousFaces Depression VSTMcolour4 FluidIntelligence MMSE VSTMcolour4 CardioMeasures1 CardioMeasures FluidIntelligence EmotionalMemor 1 FamousFaces Depression otel PicturePriming1 Proverbs FluidIntelligence PicturePriming1 VSTMcolour FluidIntelligence MMSE 1 1 ME MRI MRI MRI MRI MRI MRI ME MRI ME β B Engemann et al. 2020 eLife
  46. What aspects of MEG are most influential? Peaks - Latencies

    - 1/f - Power - Connectivity Engemann et al. 2020 eLife 10 15 0.01 0.1 Variable impo MAE (years) family source activity source connectivity sensor mixed A B . . . . 11. predictin y 5 ME stac in models ull ombined ource ource Activity ource onnectivity ensor Mixed 10 11 1 1 1 15 1 MAE (years)
  47. What aspects of MEG are most influential? Peaks - Latencies

    - 1/f - Power - Connectivity Engemann et al. 2020 eLife α βlow βlow βlow Ecat Pcat 10 15 0.01 0.10 1.00 Variable importance (MAE) MAE (years) family source activity source connectivity sensor mixed input/feature si nal envelope 1 f slope α pea E lat B predictin y ensor Mixed 1 15 1
  48. What if some modalities are (sometimes) missing? opportunistic missing value

    handling Engemann et al. 2020 eLife on Age predictions Missing value coding Layer II: Random Forest Regressor on Age predictions Missing value coding Layer II: Random Forest Regressor 2 1 2 21 A A A A 1 2 2 2 21 1 1 2 1 1e 1e 1e 1e 1 2 2 2 21 1 1 2 1 1e 1e 1e 1e 1 2 2 2 21 1 1 true age 2 21 true age 2 1 A A A A 1 2 2 2 21 1 1 2 1 1e 1e 1e 1e 1 2 2 2 21 1 1 2 1 1e 1e 1e 1e 1 2 2 2 21 1 1
  49. What if some modalities are (sometimes) missing? opportunistic missing value

    handling 4.4 4.6 4.6 4.7 8.6 14.6 MRI fMRI fMRI MEGsens MRI fMRI MEG MRI fMRI MEGsens MEG MEGsens 0 10 20 30 MAE Available inputs 4.5 5.0 5.5 6.0 6.5 7.0 4.5 5.0 5.5 6.0 6.5 7.0 MAEavailable MAEopportunistic stackin o el MRI fMRI MEG MRI fMRI MRI MEG MRI fMRI MEG co parison co on co on e tra full vs re uce A B Engemann et al. 2020 eLife
  50. Interim-Summary 1. MEG contains unique information on age and cognitive

    aging 2. MEG source power is a potent feature for predictive modeling 3. Tree-based methods bring flexible missing value handling
  51. Interim-Summary 1. MEG contains unique information on age and cognitive

    aging 2. MEG source power is a potent feature for predictive modeling 3. Tree-based methods bring flexible missing value handling Limitations: Do I need MEG + Source Localization ? What we find in most hospitals looks a bit different …
  52. M/EEG Covariance Matrix: var(Xi ) = diag(Ci ) ∈ ℝP

    Power is variance Ci = Xi X⊤ i /T ∈ ℝP×P
  53. M/EEG Covariance Matrix: Power is variance var(Xi ) = diag(Ci

    ) ∈ ℝP Ci = Xi X⊤ i /T ∈ ℝP×P
  54. Predicting from M/EEG source power Without biophysical source localization z

    s ? Objective: predict target from M/EEG Neurophysiological genera or a is ical o el biomedical outcome statistical sources M/EEG signals Maxwell's eq. neural mechanism f log s Problem: volume conductions is evil. Sabbagh et al. 2019 (NeurIPS) 2020 (NIMG) Ci = Xi X⊤ i /T ∈ ℝP×P Use cov. as representation
  55. Predicting from M/EEG source power Without biophysical source localization z

    s ? Objective: predict target from M/EEG Neurophysiological genera or a is ical o el biomedical outcome statistical sources M/EEG signals Maxwell's eq. neural mechanism f log s Problem: volume conductions is evil. Idea: get immunized against this evil Sabbagh et al. 2019 (NeurIPS) 2020 (NIMG) Ci = Xi X⊤ i /T ∈ ℝP×P Use cov. as representation logm ( ¯ C−1/2Ci ¯ C−1/2)
  56. Predicting from M/EEG source power Without biophysical source localization z

    s ? Objective: predict target from M/EEG Neurophysiological genera or a is ical o el biomedical outcome statistical sources M/EEG signals Maxwell's eq. neural mechanism f log s Problem: volume conductions is evil. Idea: get immunized against this evil Sabbagh et al. 2019 (NeurIPS) 2020 (NIMG) Take out volume conduction using Riemannian embeddings, or spatial filters Ci = Xi X⊤ i /T ∈ ℝP×P Use cov. as representation logm ( ¯ C−1/2Ci ¯ C−1/2)
  57. Simulations Are shortcuts — in principle — possible? Sabbagh et

    al. 2019 (NeurIPS) 2020 (NIMG) distance from identity chance level 0.00 0.25 0.50 0.75 1.00 0.0 0.5 1.0 1.5 2.0 2.5 3.0 µ Normalized MAE noise on target 0.00 0.25 0.50 0.75 1.00 0.01 0.10 1.00 10.00 σ 0.00 0.25 0.50 0.75 1.00 upper diag S o iemann noise on mi ing matri 0.01 0.10 1.00 σ z s ? Objective: predict target from M/EEG Neurophysiological genera or a is ical o el biomedical outcome statistical sources M/EEG signals Maxwell's eq. neural mechanism f log s
  58. Empirical benchmarks How do these models compare with real data

    and unknown degrees model violations? Sabbagh et al. 2020 (NIMG) 7.98 8.11 8.76 8.76 9.17 10.89 predicting age Riemann53 Riemann SPoC67 SPoC diag upper 8 10 12 14 16 MAE upper diag SPoC Riemann MEG — sensor space MEG — source space
  59. Empirical benchmarks How do these models compare with real data

    and unknown degrees model violations? Sabbagh et al. 2020 (NIMG) 7.98 8.11 8.76 8.76 9.17 10.89 predicting age Riemann53 Riemann SPoC67 SPoC diag upper 8 10 12 14 16 MAE upper diag SPoC Riemann MEG — sensor space MEG — source space Q: Do we expect the same ranking?
  60. Empirical benchmarks How do these models compare with real data

    and unknown degrees model violations? Sabbagh et al. 2020 (NIMG) 7.69 9.50 10.98 11.67 11.86 12.46 predicting age diag Riemann11 Riemann upper SPoC20 SPoC 5.0 7.5 10.0 12.5 15.0 17.5 MAE upper diag SPoC Riemann 7.98 8.11 8.76 8.76 9.17 10.89 predicting age Riemann53 Riemann SPoC67 SPoC diag upper 8 10 12 14 16 MAE upper diag SPoC Riemann MEG — sensor space MEG — source space
  61. Empirical benchmarks How do these models compare with real data

    and unknown degrees model violations? Sabbagh et al. 2020 (NIMG) 7.69 9.50 10.98 11.67 11.86 12.46 predicting age diag Riemann11 Riemann upper SPoC20 SPoC 5.0 7.5 10.0 12.5 15.0 17.5 MAE upper diag SPoC Riemann 7.98 8.11 8.76 8.76 9.17 10.89 predicting age Riemann53 Riemann SPoC67 SPoC diag upper 8 10 12 14 16 MAE upper diag SPoC Riemann MEG — sensor space MEG — source space Observations: (1) the baseline model is the best in source space
  62. Empirical benchmarks How do these models compare with real data

    and unknown degrees model violations? Sabbagh et al. 2020 (NIMG) 7.69 9.50 10.98 11.67 11.86 12.46 predicting age diag Riemann11 Riemann upper SPoC20 SPoC 5.0 7.5 10.0 12.5 15.0 17.5 MAE upper diag SPoC Riemann 7.98 8.11 8.76 8.76 9.17 10.89 predicting age Riemann53 Riemann SPoC67 SPoC diag upper 8 10 12 14 16 MAE upper diag SPoC Riemann MEG — sensor space MEG — source space Observations: (1) the baseline model is the best in source space (2) Riemannian embeddings get closest to results with source localization
  63. Empirical benchmarks How do these models compare with real data

    and unknown degrees model violations? Sabbagh et al. 2020 (NIMG) 7.98 8.11 8.76 8.76 9.17 10.89 predicting age Riemann53 Riemann SPoC67 SPoC diag upper 8 10 12 14 16 MAE upper diag SPoC Riemann MEG — sensor space EEG— sensor space (TUH data, n=1385) Q: Can we get similar results on 21-chan. EEG as compared to 306-chan. MEG?
  64. Empirical benchmarks How do these models compare with real data

    and unknown degrees model violations? Sabbagh et al. 2020 (NIMG) 8.21 8.27 9.63 10.72 predicting age Riemann19 Riemann SPoC21 diag upper 5.0 7.5 10.0 12.5 15.0 MAE upper diag SPoC Riemann 7.98 8.11 8.76 8.76 9.17 10.89 predicting age Riemann53 Riemann SPoC67 SPoC diag upper 8 10 12 14 16 MAE upper diag SPoC Riemann MEG — sensor space EEG— sensor space (TUH data, n=1385) EEG can in principle be substituted for MEG
  65. 1) Université Paris-Saclay, Inria, CEA, Palaiseau, France, 2) Inserm, UMRS-942,

    Paris Diderot University, Paris, France, 3) Department of Anaesthesiology and Critical Care, Lariboisière Hospital, Assistance Publique Hôpitaux de Paris, Paris, France, 4) Max Planck Institute for Human Cognitive and Brain Sciences, Department of Neurology, D-04103, Leipzig, Germany NeurIPS Twitter NeuroImage 8.21 8.27 9.63 10.72 predicting age Riemann19 Riemann SPoC21 diag upper 5.0 7.5 10.0 12.5 15.0 MAE 7.98 8.11 8.76 8.76 9.17 10.89 predicting age Riemann53 Riemann SPoC67 SPoC diag upper 8 10 12 14 16 MAE upper diag SPoC Riemann raw raw raw Riemann53 SPoC67 diag env eog ecg eo/cg rej env eog ecg eo/cg rej env eog ecg eo/cg rej 6 7 8 9 10 11 12 13 14 Preprocessing steps MAE SSS SSP David Sabbagh1,2,3, Pierre Ablin1, Gaël Varoquaux1, Alexandre Gramfort1, Denis A. Engemann1,4 Correspondendce: david.sabbagh inria.fr, denis-alexander.engemann inria.fr z s bjective: predict outcome from M/EEG Neurophysiological generator Statistical model biomedical outcome statistical sources M/EEG signals Maxwell s eq. neural mechanism 1 2 x y f log s ) MEG - Cam-CAN n 600) EEG - Temple Univ. Hospital n 1385) ξ M M T M M M' Log M Ex M Predictive regression modeling with MEG/EEG: From source power to signals and cognitive states P1609 When prediction performance is the priority iemannian em eddings may eat source localization Riemannian embeddings perform best on real data. Volume conduction prevents classical linear modeling when predicting from source power. Simulations: SF RE yield consistent regression. RE were more robust to model violations. RE yielded robust regression models. dea hen using a linear model like Ridge regression to predict outcomes y) from M/EEG ), replace biophysical source model with mathematical-statistical transformation to regress out volume conduction. e considered spatial lters SF) and Riemannian embeddings RE). Baseline: sensor space power upper) and log-power diag). Note For prediction at the subject-level we encounter severe model violations as each individual has her own head and brain. This breaks mathematical guarantees. See R code for NeurIPS paper) Note e benchmarked methods against age-prediction with ridge regression. ith source localization MNE) as transformation, diag performed best 7.7 yrs mean absolute error MAE) Note e compared regression models across different combinations of preprocessing steps: denoising SSP/SSS), ECG/E G artifacts, rejection of bad segments. e even ran models with no preprocessing at all. RE is a clear winner. Caveat: Additional analyses also suggest that RE is most in uenced by anatomical factors. distance from identity chance level 0.00 0.25 0.50 0.75 1.00 0.0 0.5 1.0 1.5 2.0 2.5 3.0 Normalized MAE noise on target 0.00 0.25 0.50 0.75 1.00 0.01 0.10 1.00 10.00 σ 0.00 0.25 0.50 0.75 1.00 upper diag SPoC Riemann noise on mixing matrix 0.01 0.10 1.00 σ OHBM 2020 Poster 1609
  66. Summary What shall I remember? 1. MEG contains unique information

    on age and cognitive aging 2. MEG source power is a potent feature for predictive modeling
  67. Summary What shall I remember? 1. MEG contains unique information

    on age and cognitive aging 2. MEG source power is a potent feature for predictive modeling 3. Tree-based methods bring flexible missing value handling
  68. Summary What shall I remember? 1. MEG contains unique information

    on age and cognitive aging 2. MEG source power is a potent feature for predictive modeling 3. Tree-based methods bring flexible missing value handling 4. Statistical-mathematical shortcuts can help avoid source localization
  69. Summary What shall I remember? 1. MEG contains unique information

    on age and cognitive aging 2. MEG source power is a potent feature for predictive modeling 3. Tree-based methods bring flexible missing value handling 4. Statistical-mathematical shortcuts can help avoid source localization 5. EEG may be substituted for MEG in age-prediction.
  70. Thank you! Oleh Kozynets Guillaume Lemaître David Sabbagh Pierre Ablin

    Franz Liem Gaël Varoquaux Alexandre Gramfort Contact [email protected] www.denis-engemann.de github: @dengemann twitter: @dngman