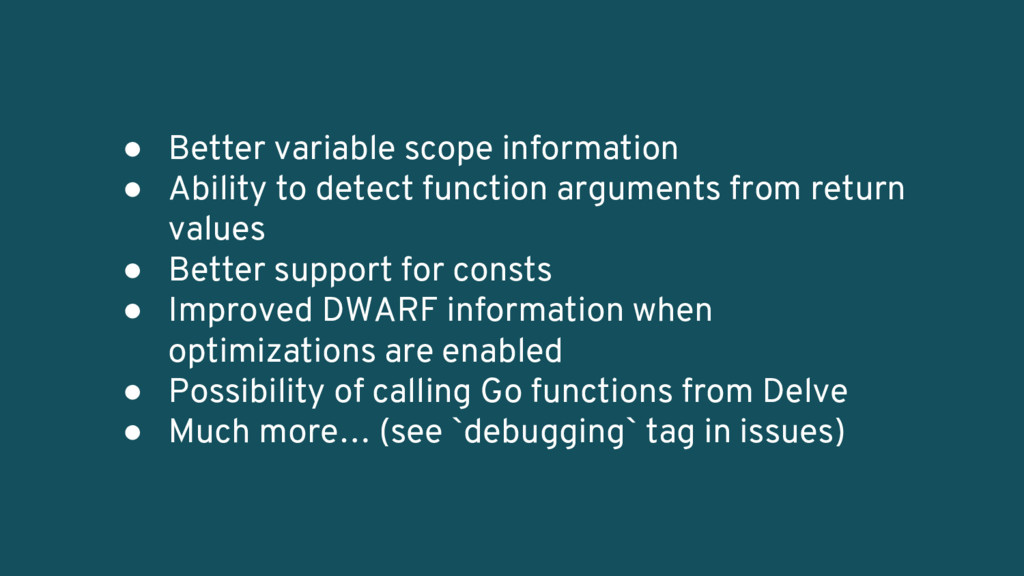
arguments from return values • Better support for consts • Improved DWARF information when optimizations are enabled • Possibility of calling Go functions from Delve • Much more… (see `debugging` tag in issues)
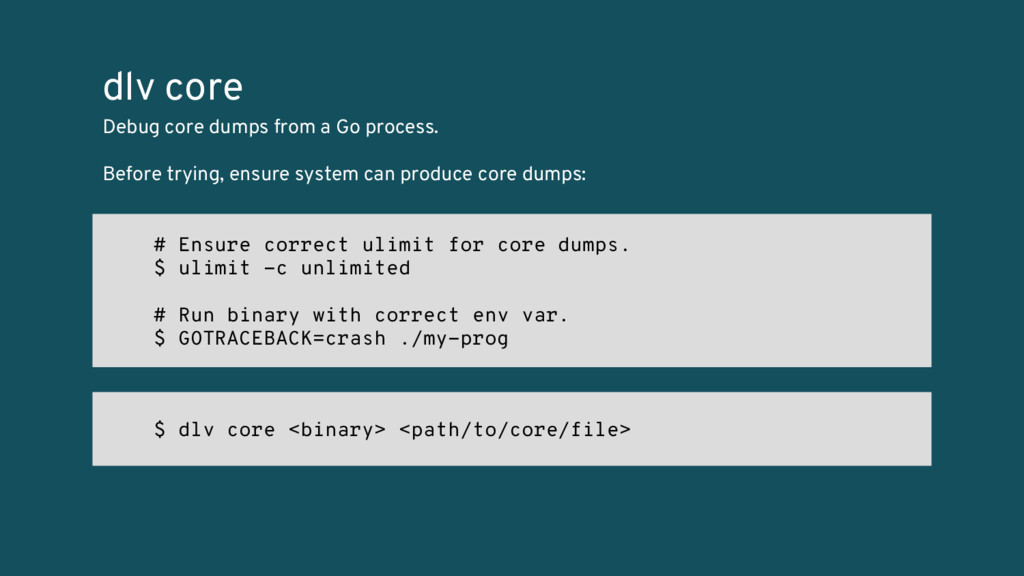
unlimited # Run binary with correct env var. $ GOTRACEBACK=crash ./my-prog dlv core Debug core dumps from a Go process. Before trying, ensure system can produce core dumps: $ dlv core <binary> <path/to/core/file>
![[And now for something completely different]](https://files.speakerdeck.com/presentations/e3802cd873cf458bade27946018a809a/slide_15.jpg)
![$ dlv trace <regexp> … [trace output] … dlv trace](https://files.speakerdeck.com/presentations/e3802cd873cf458bade27946018a809a/slide_24.jpg)