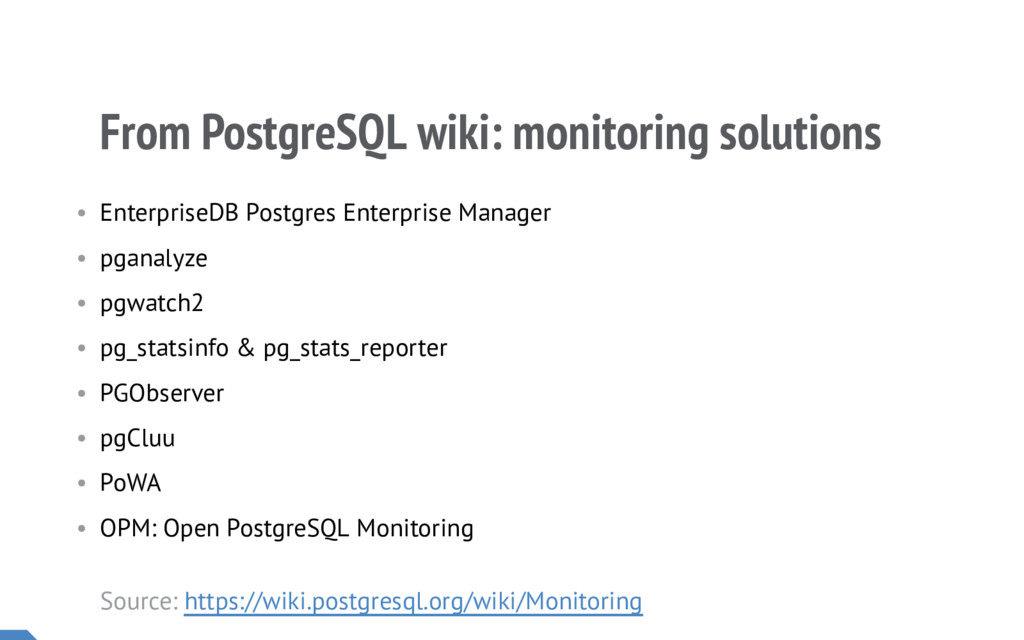
monitoring tools are not so awesome • Database developers are usually not good with UX (or developing frontend) We try to focus on premise open-source solutions.
monitoring tools are not so awesome • Database developers are usually not good with UX (or developing frontend) • (Too) Many monitoring tools are available We try to focus on premise open-source solutions.
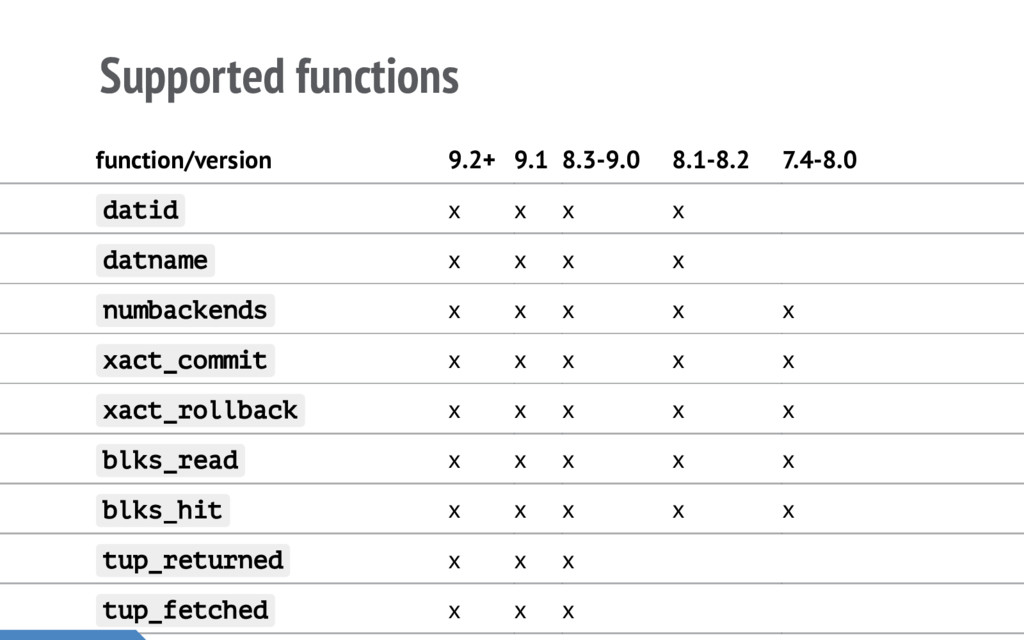
x x x datname x x x x numbackends x x x x x xact_commit x x x x x xact_rollback x x x x x blks_read x x x x x blks_hit x x x x x tup_returned x x x tup_fetched x x x
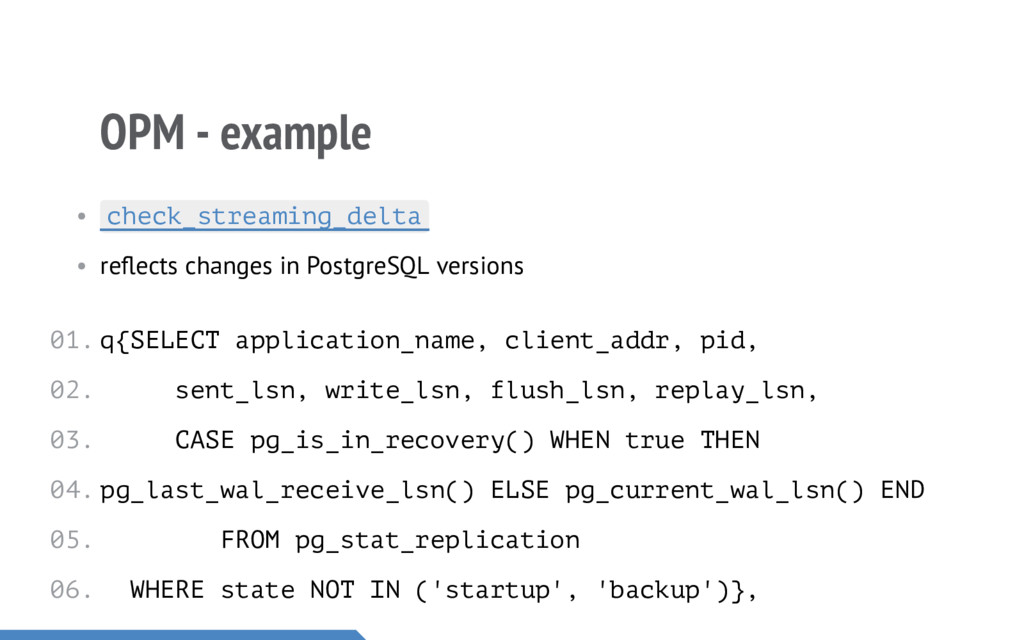
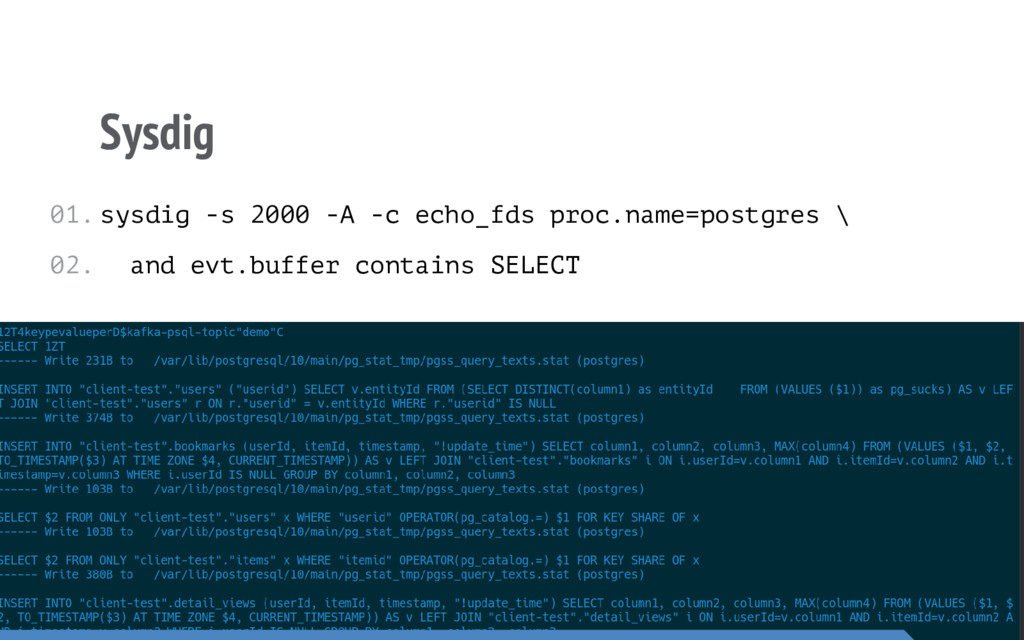
versions q{SELECT application_name, client_addr, pid, sent_lsn, write_lsn, flush_lsn, replay_lsn, CASE pg_is_in_recovery() WHEN true THEN pg_last_wal_receive_lsn() ELSE pg_current_wal_lsn() END FROM pg_stat_replication WHERE state NOT IN ('startup', 'backup')}, 01. 02. 03. 04. 05. 06.
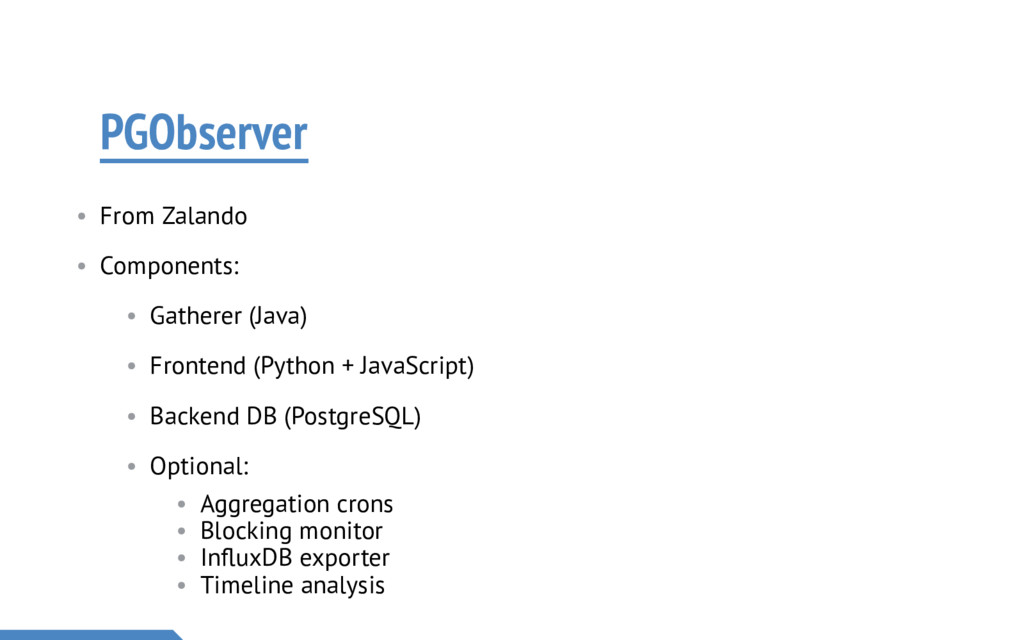
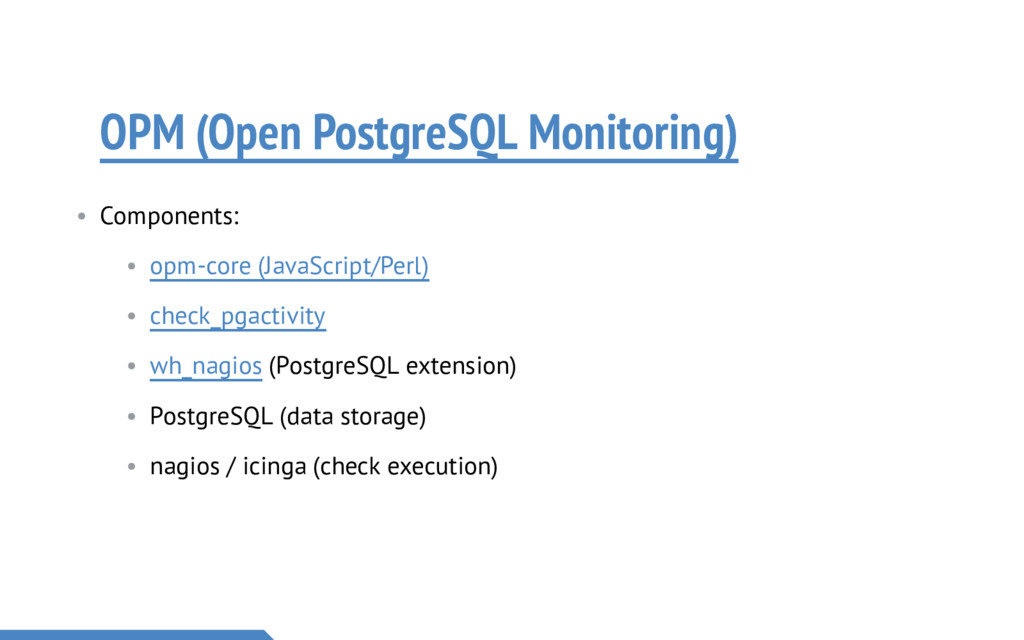
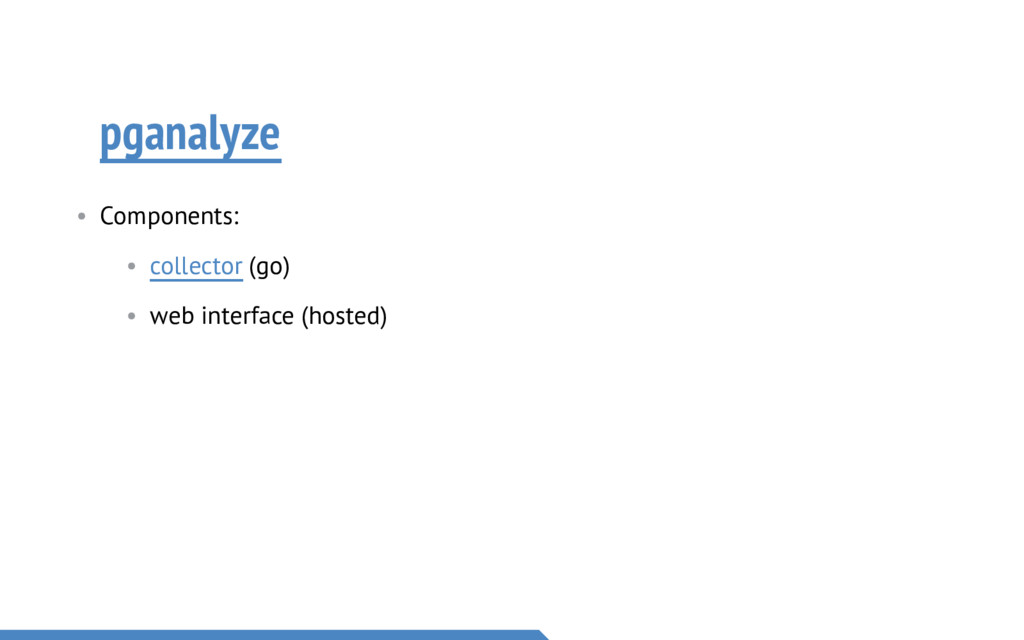
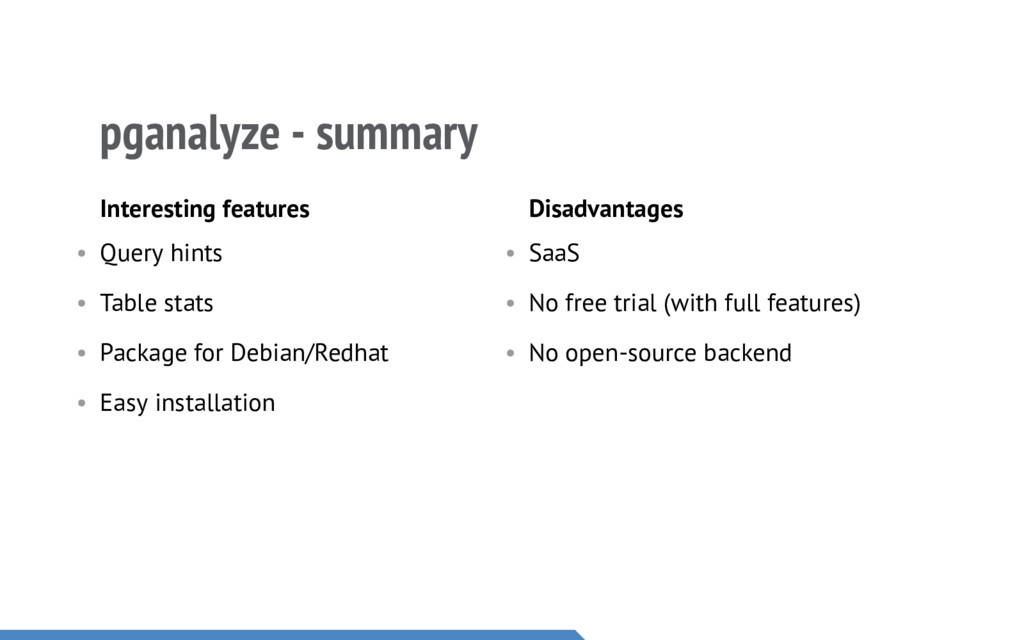
• powa-web (Python/JavaScript) • Optional: • pg_stat_statements - providing data about queries being executed • pg_qualstats - providing data about predicates, or where clauses • pg_stat_kcache - providing data about operating-system level cache • HypoPG - allowing you to create hypothetical indexes
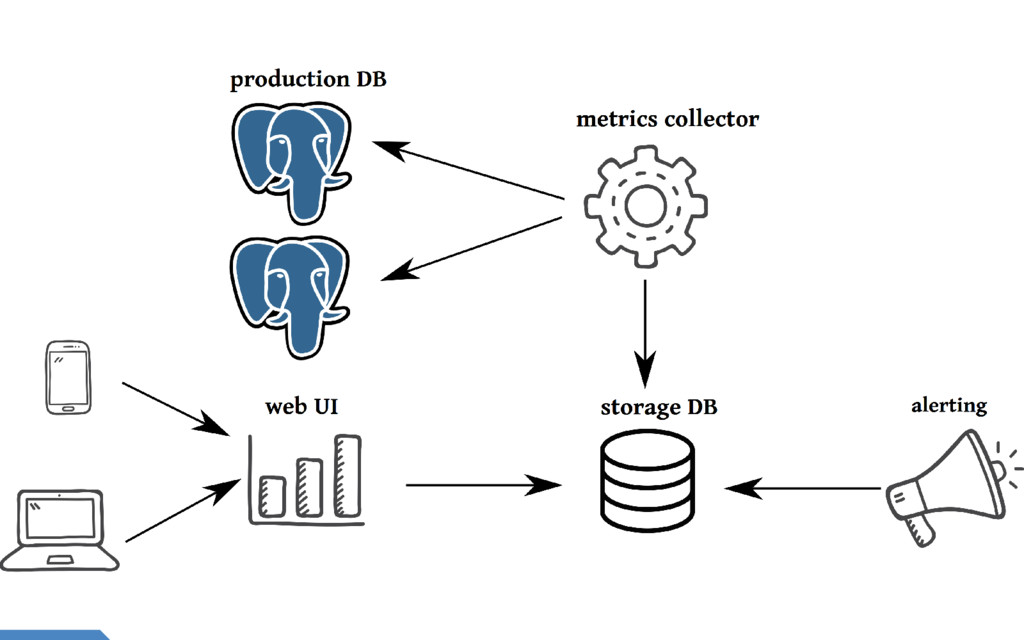
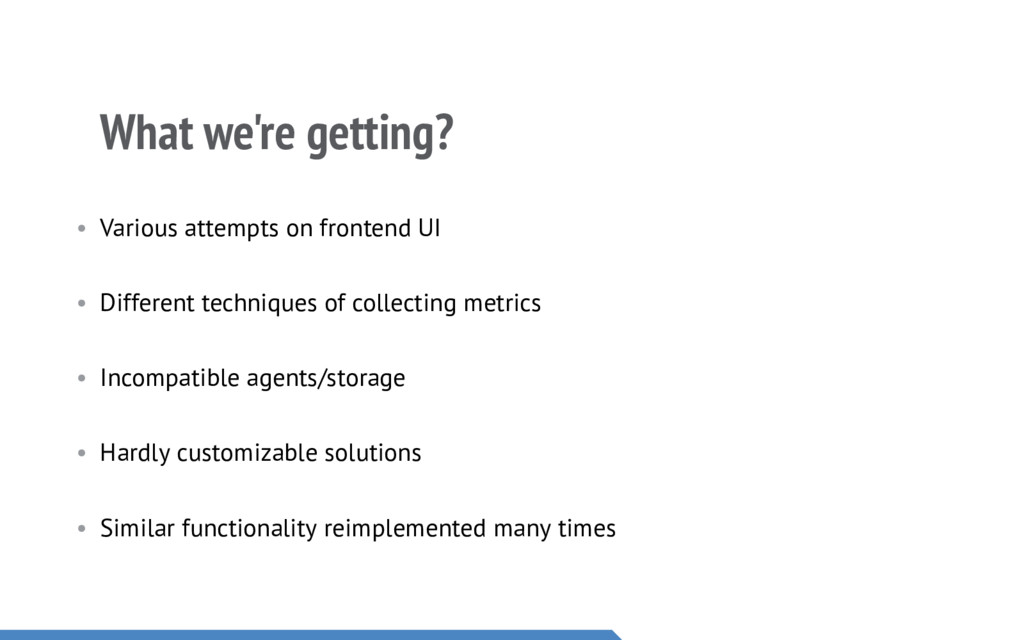
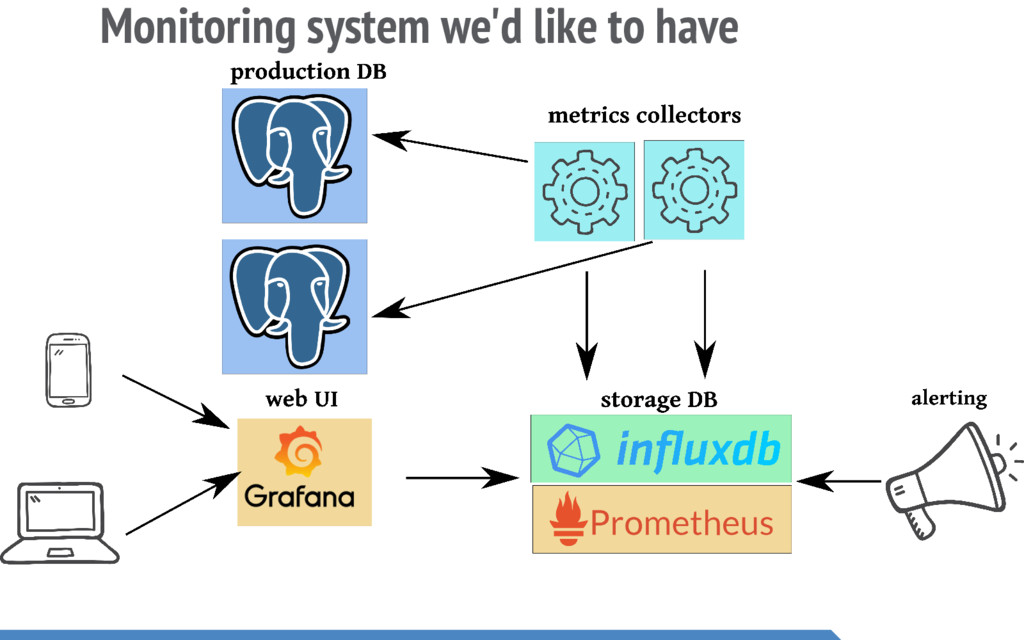
Different techniques of collecting metrics • Incompatible agents/storage • Hardly customizable solutions • Similar functionality reimplemented many times
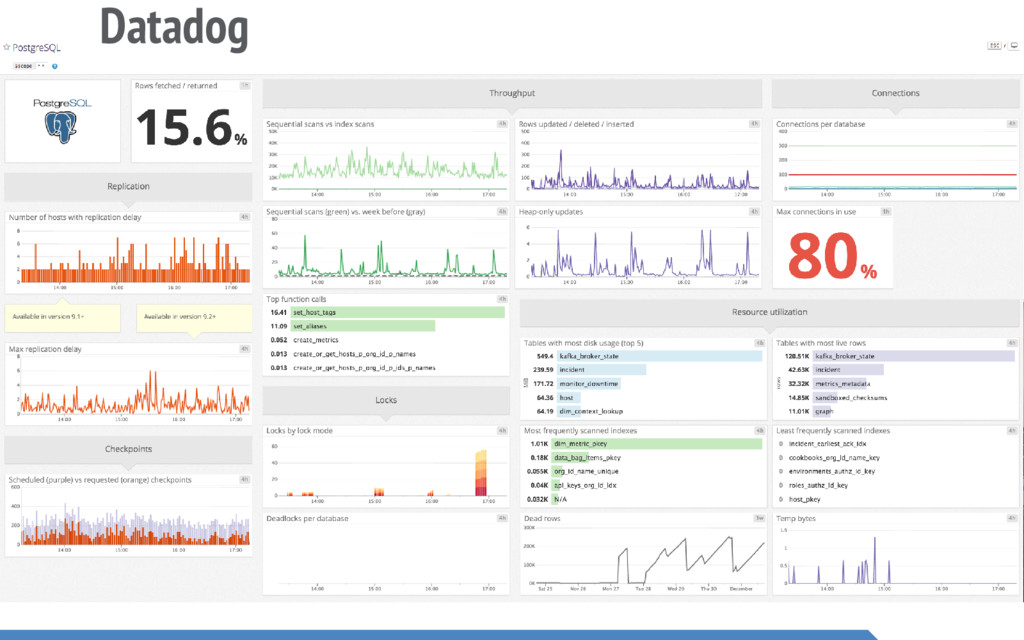
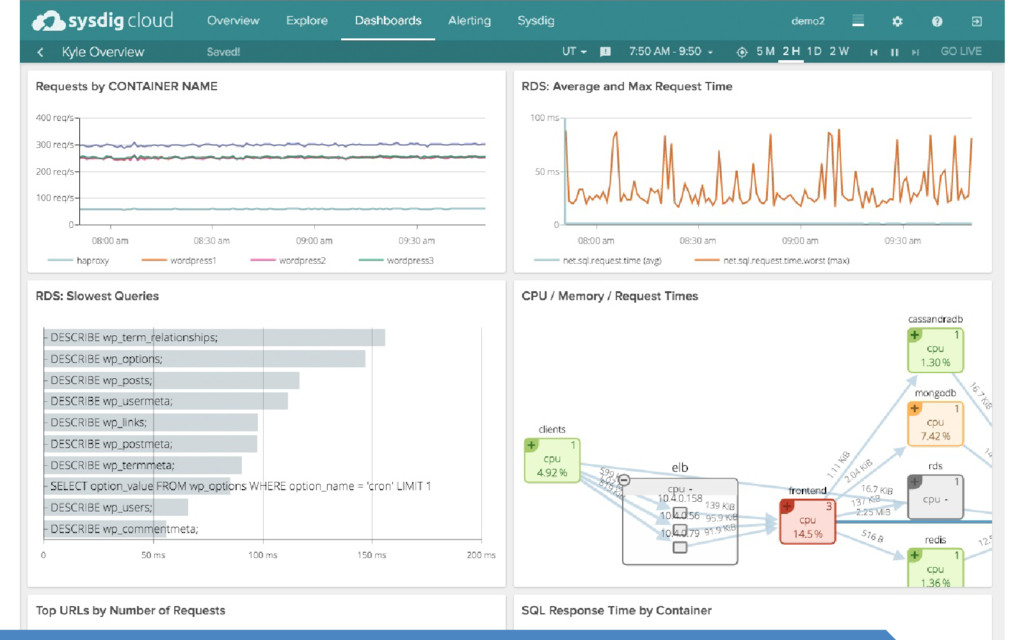
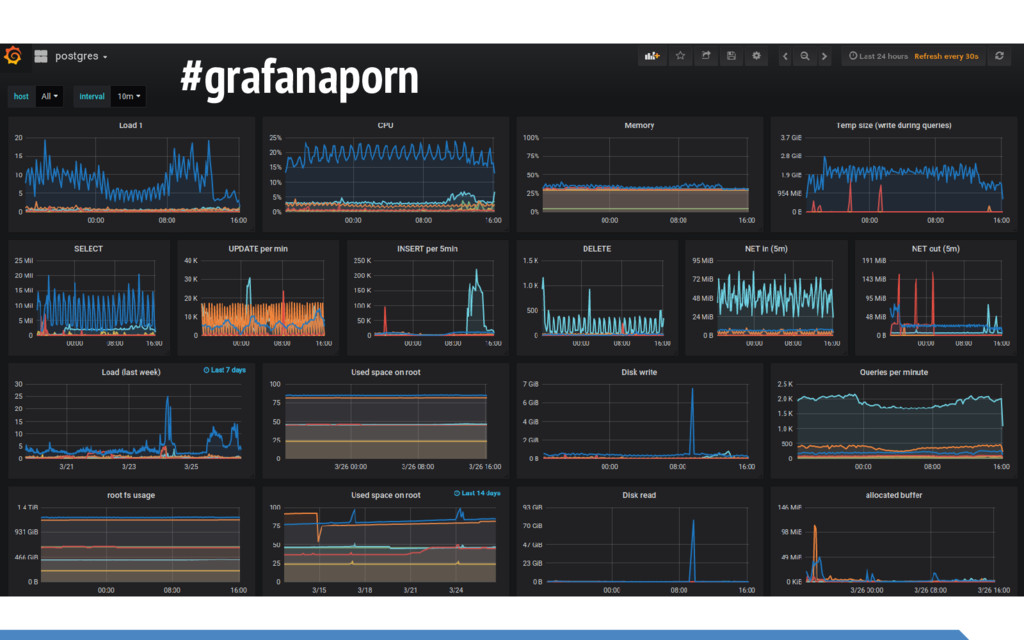
Open-source • Similar dashboards can be displayed in Grafana • Most problematic is storing high- cardinality data in timeseries DB Examples of SaaS solutions
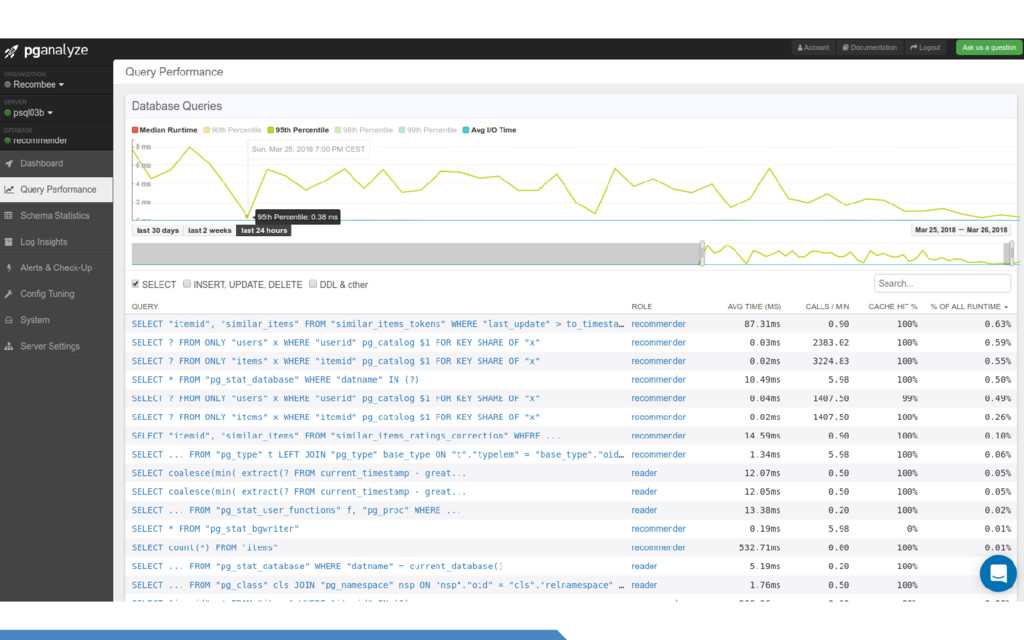
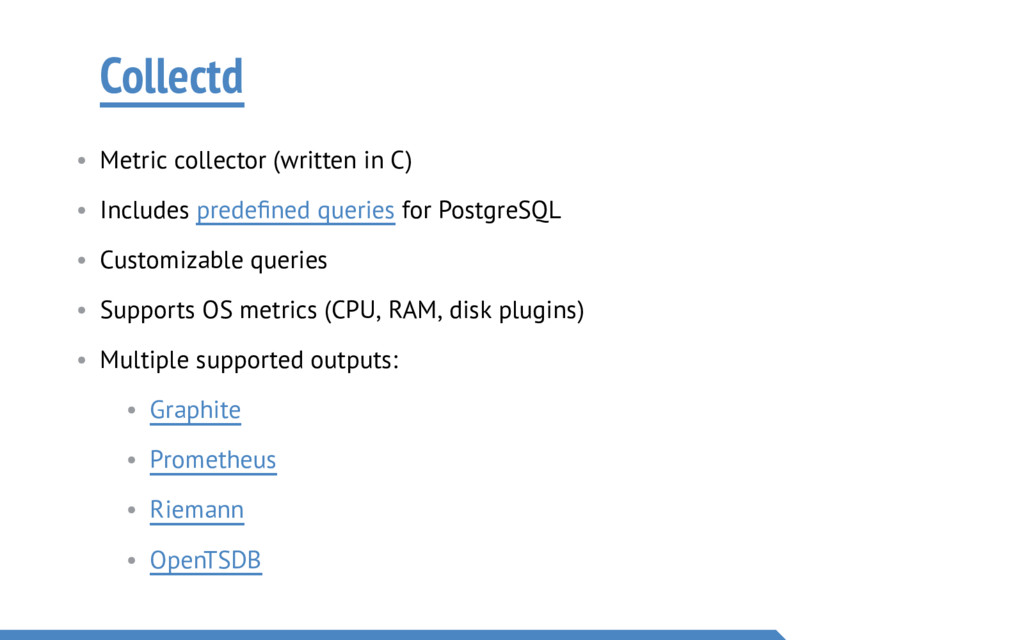
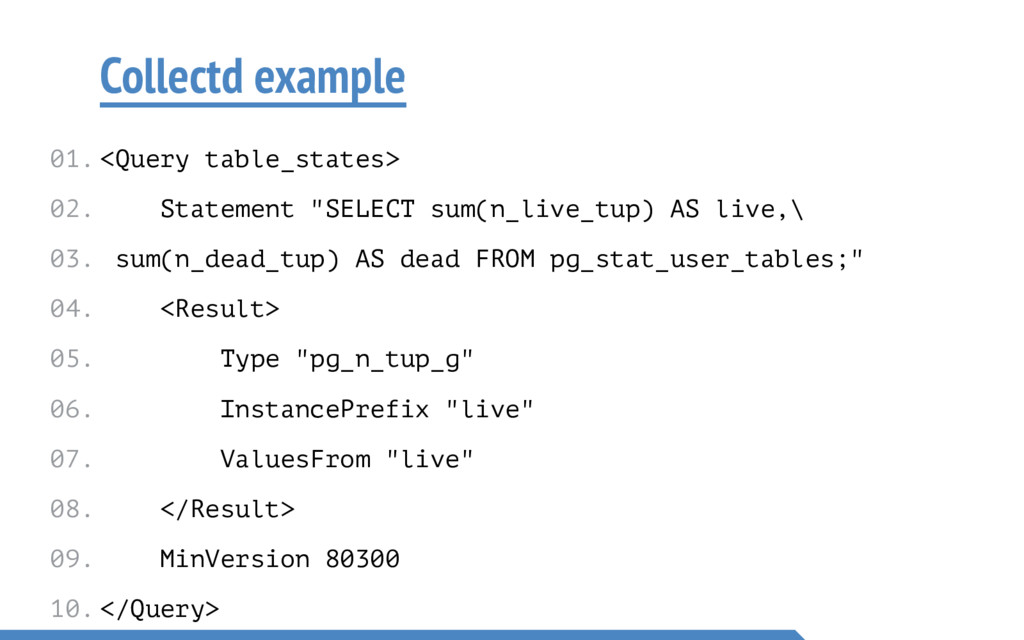
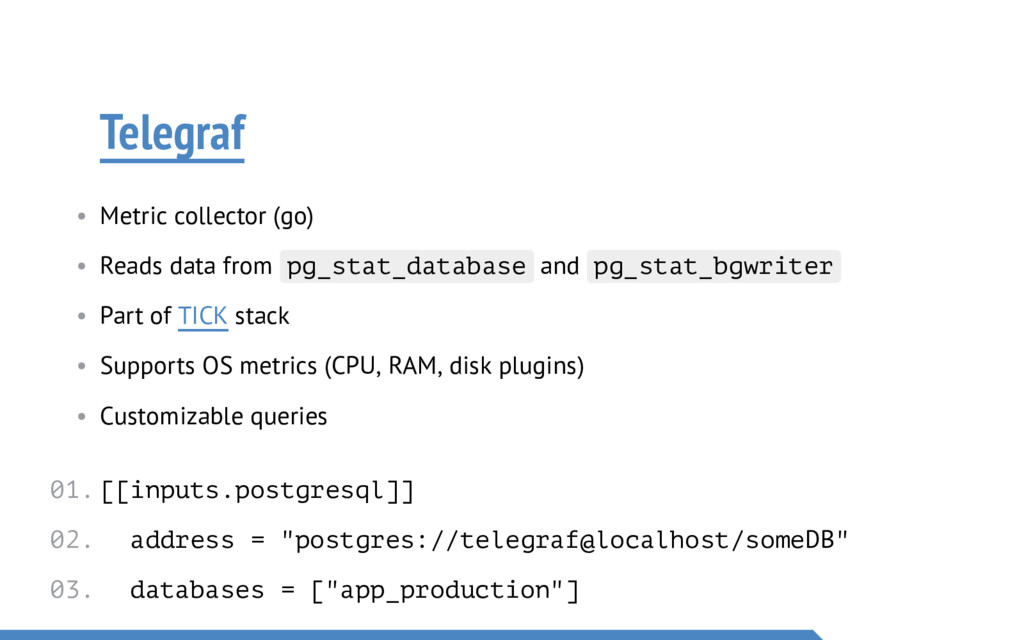
• Metric collection daemons ( collectd , telegraf ) works well for common metrics • Grafana is currently best (open-source) UI for monitoring dashboards • Expensive monitoring queries should be executed in less frequent intervals
Kitchen Stories (2003) • Business vector created by Dooder - Freepik.com • Icons made by Webalys Freebies from www.flaticon.com • Building software by Manu