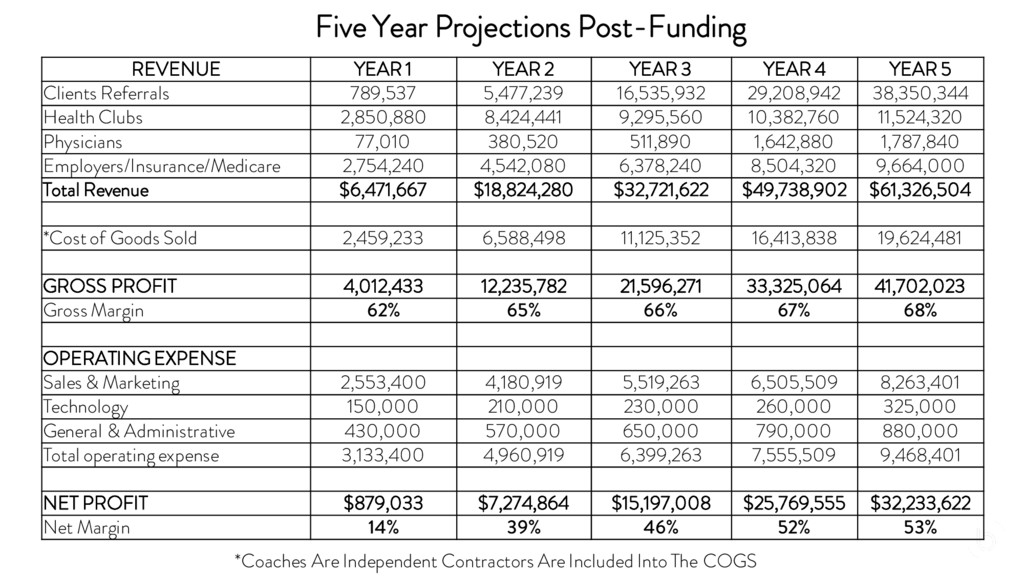
3 YEAR 4 YEAR 5 Clients Referrals 789,537 5,477,239 16,535,932 29,208,942 38,350,344 Health Clubs 2,850,880 8,424,441 9,295,560 10,382,760 11,524,320 Physicians 77,010 380,520 511,890 1,642,880 1,787,840 Employers/Insurance/Medicare 2,754,240 4,542,080 6,378,240 8,504,320 9,664,000 Total Revenue $6,471,667 $18,824,280 $32,721,622 $49,738,902 $61,326,504 *Cost of Goods Sold 2,459,233 6,588,498 11,125,352 16,413,838 19,624,481 GROSS PROFIT 4,012,433 12,235,782 21,596,271 33,325,064 41,702,023 Gross Margin 62% 65% 66% 67% 68% OPERATING EXPENSE Sales & Marketing 2,553,400 4,180,919 5,519,263 6,505,509 8,263,401 Technology 150,000 210,000 230,000 260,000 325,000 General & Administrative 430,000 570,000 650,000 790,000 880,000 Total operating expense 3,133,400 4,960,919 6,399,263 7,555,509 9,468,401 NET PROFIT $879,033 $7,274,864 $15,197,008 $25,769,555 $32,233,622 Net Margin 14% 39% 46% 52% 53% *Coaches Are Independent Contractors Are Included Into The COGS