Upgrade to Pro — share decks privately, control downloads, hide ads and more …

Your organization as a graph

Your organization as a graph

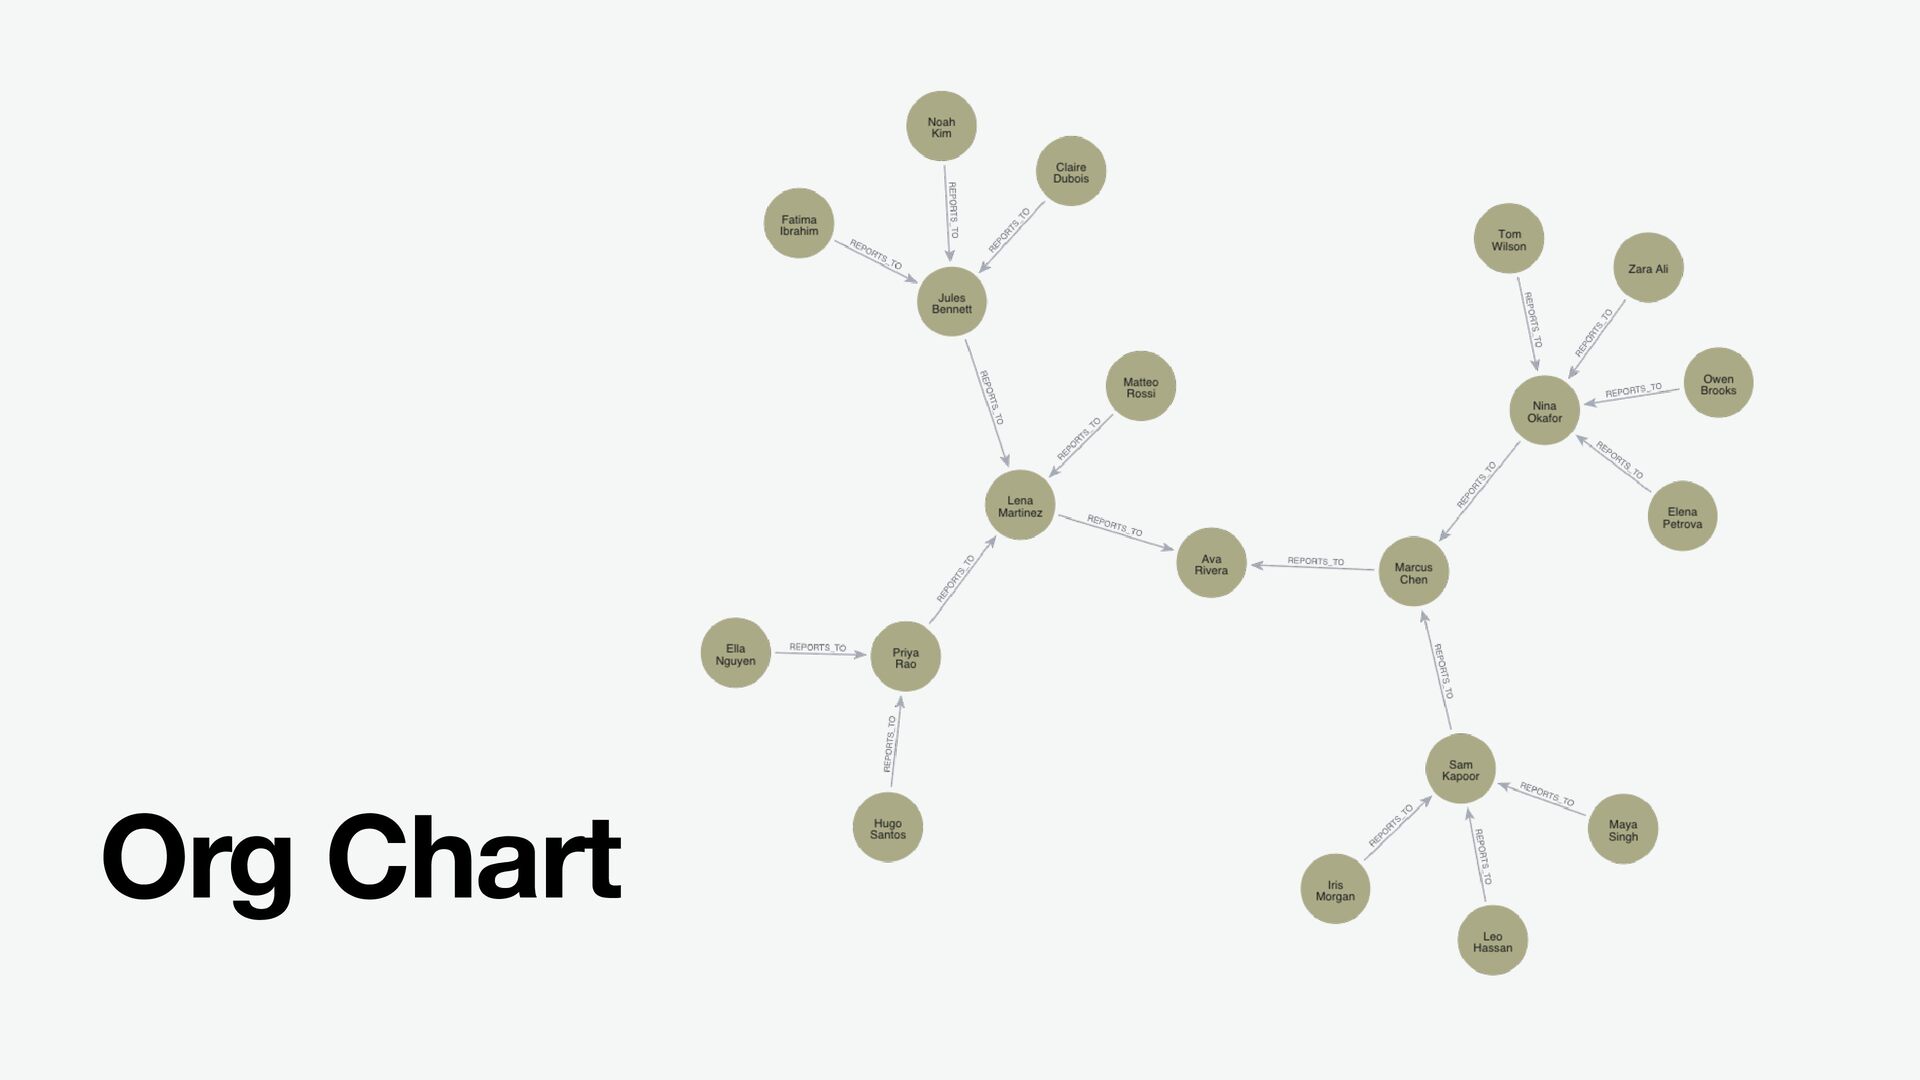
We think of companies as hierarchies: people form teams, teams sit in departments, and departments belong to divisions. But does this mental model help us understand how work actually gets done?

Not really.
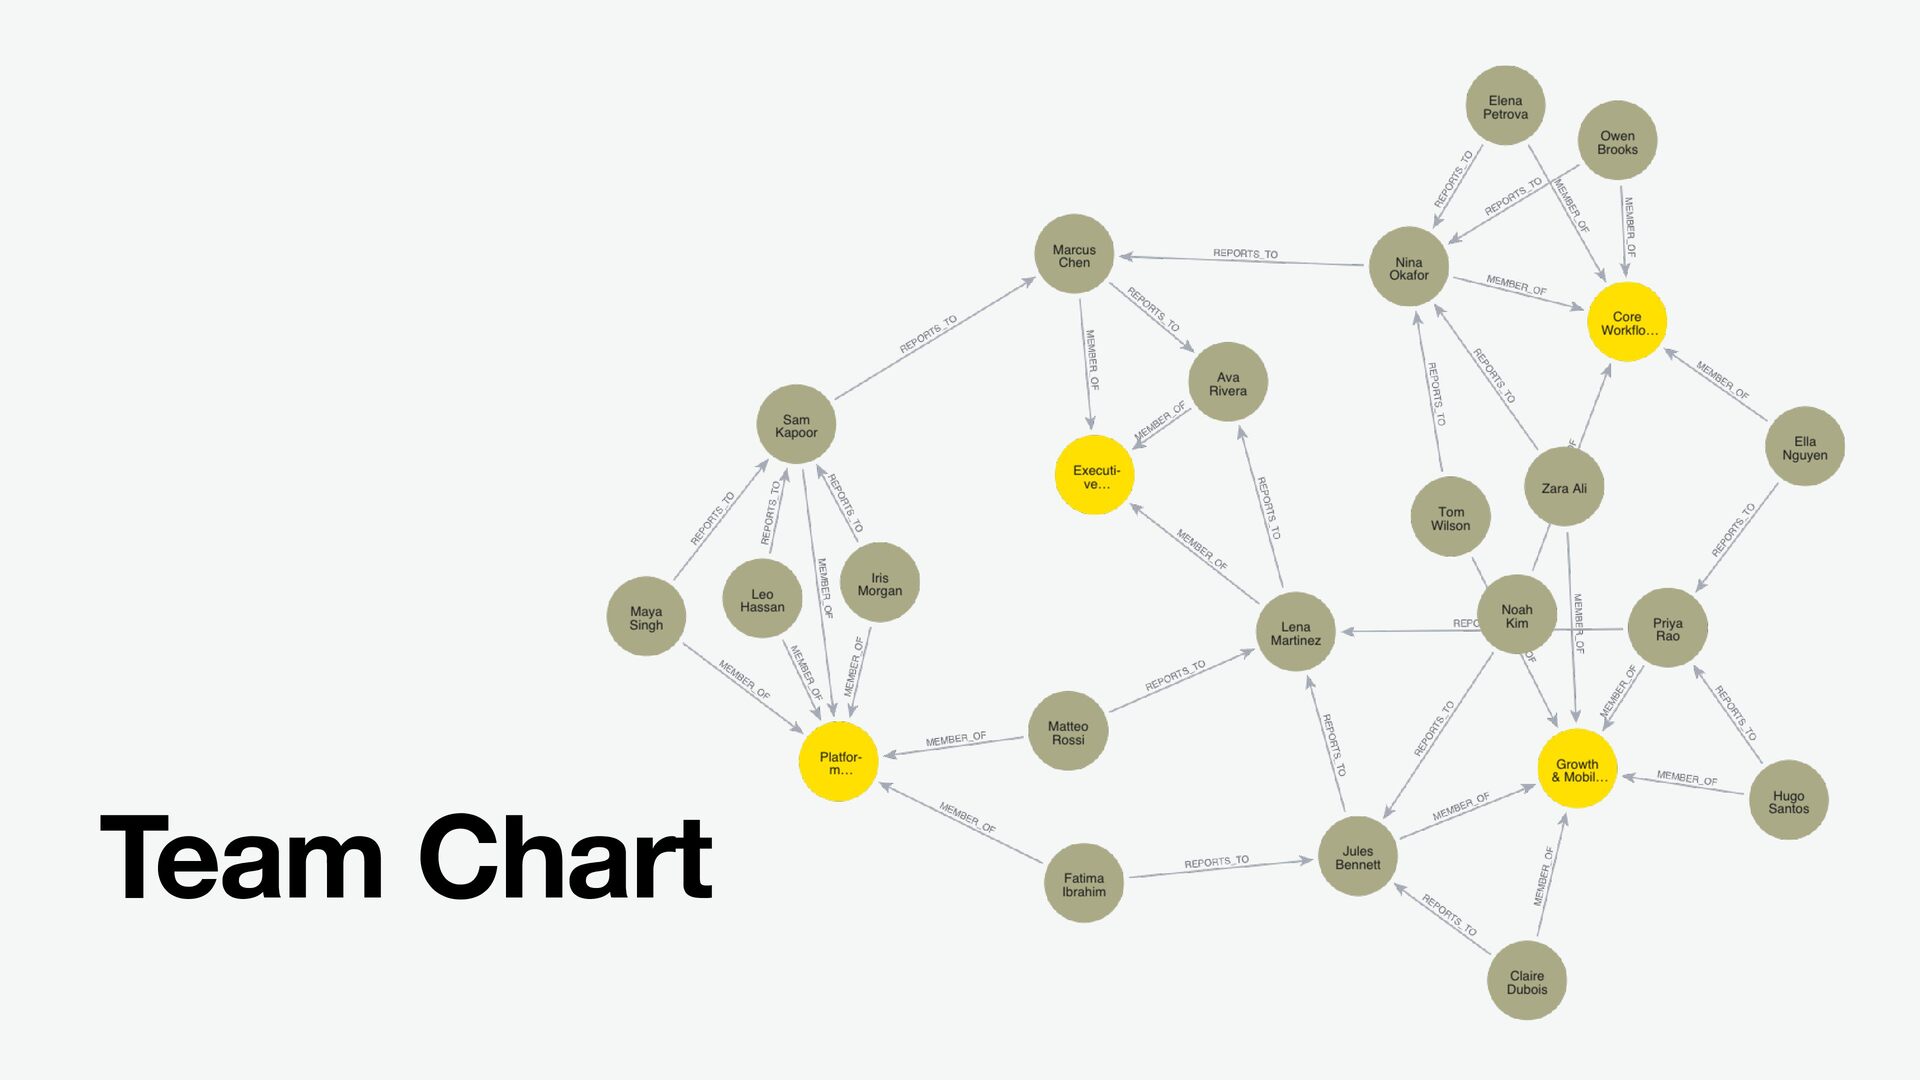
We create cross-functional groups and work streams around projects to foster collaboration. In extreme cases, we even go through reorgs and layoffs to help improve the structure. But it's still difficult to quantify how much all of these initiatives help because we lack a way to visualize how work flows through the organization.

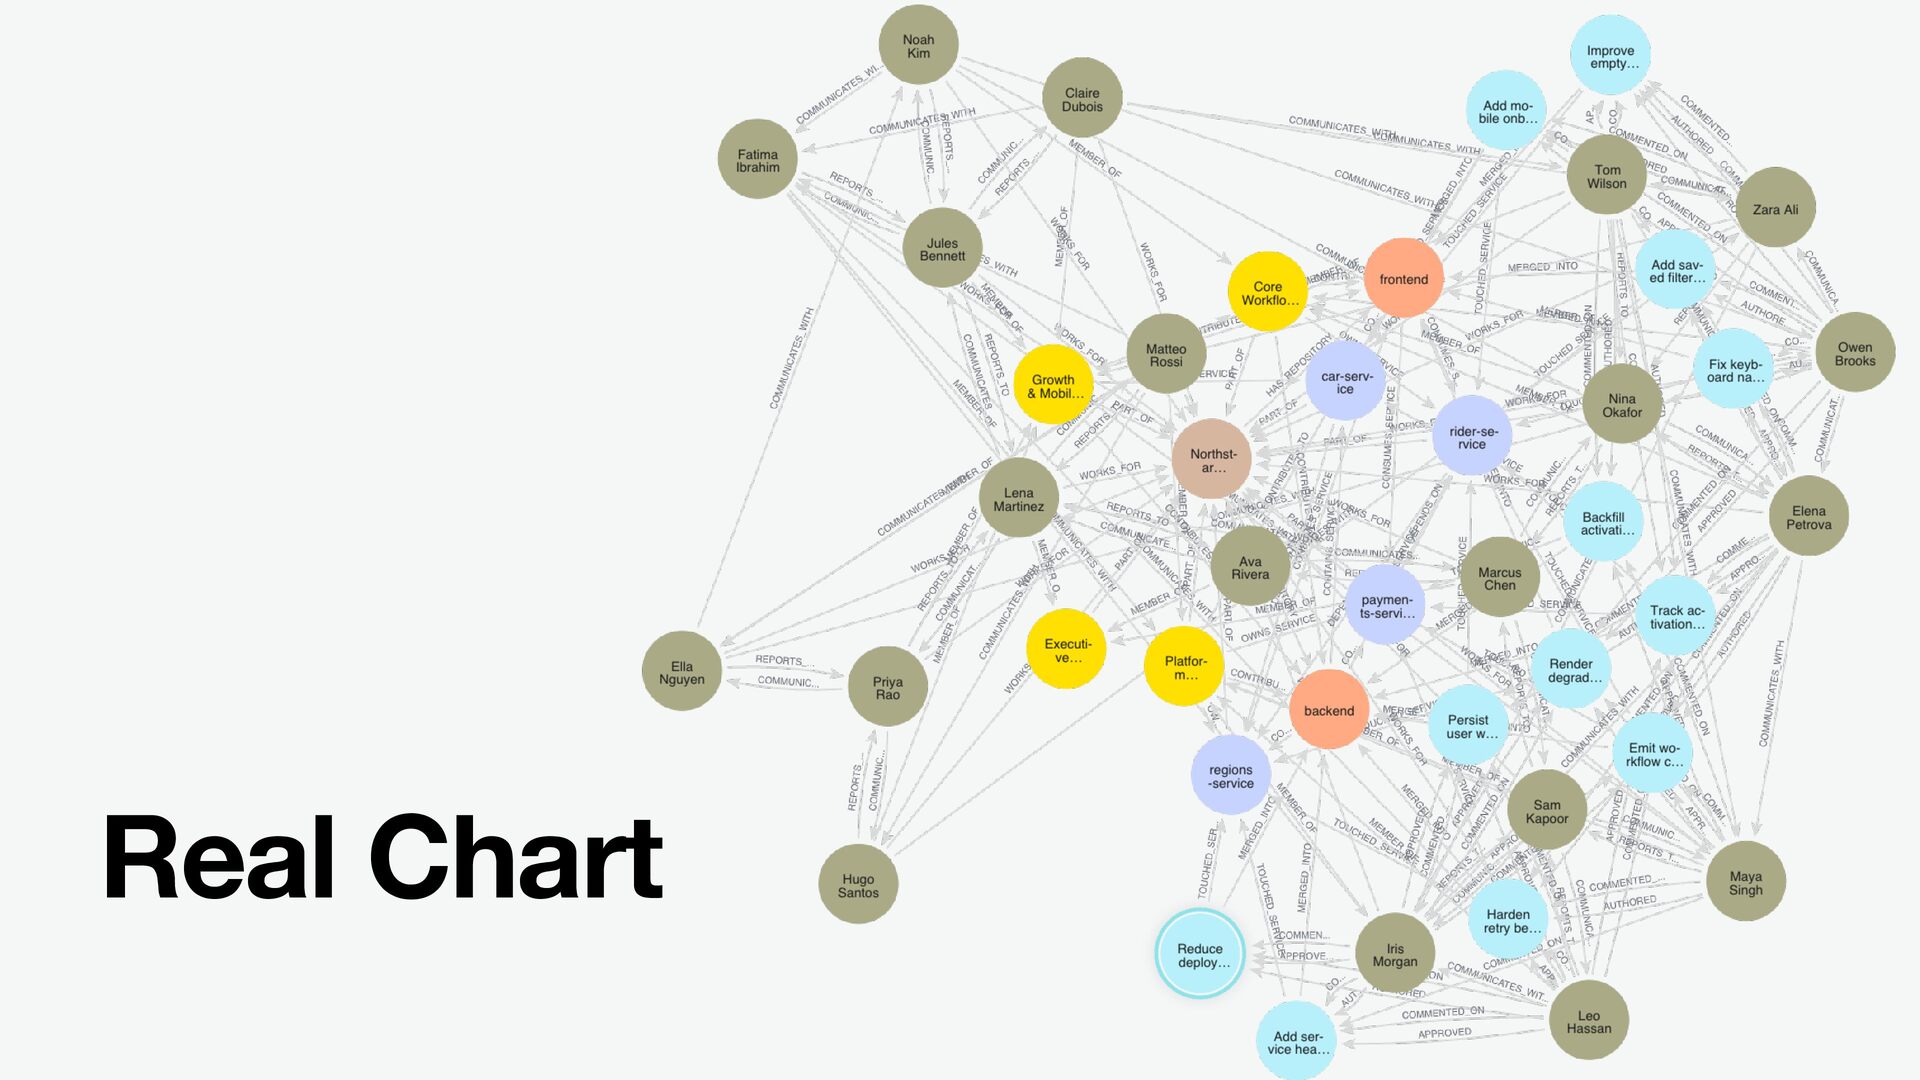
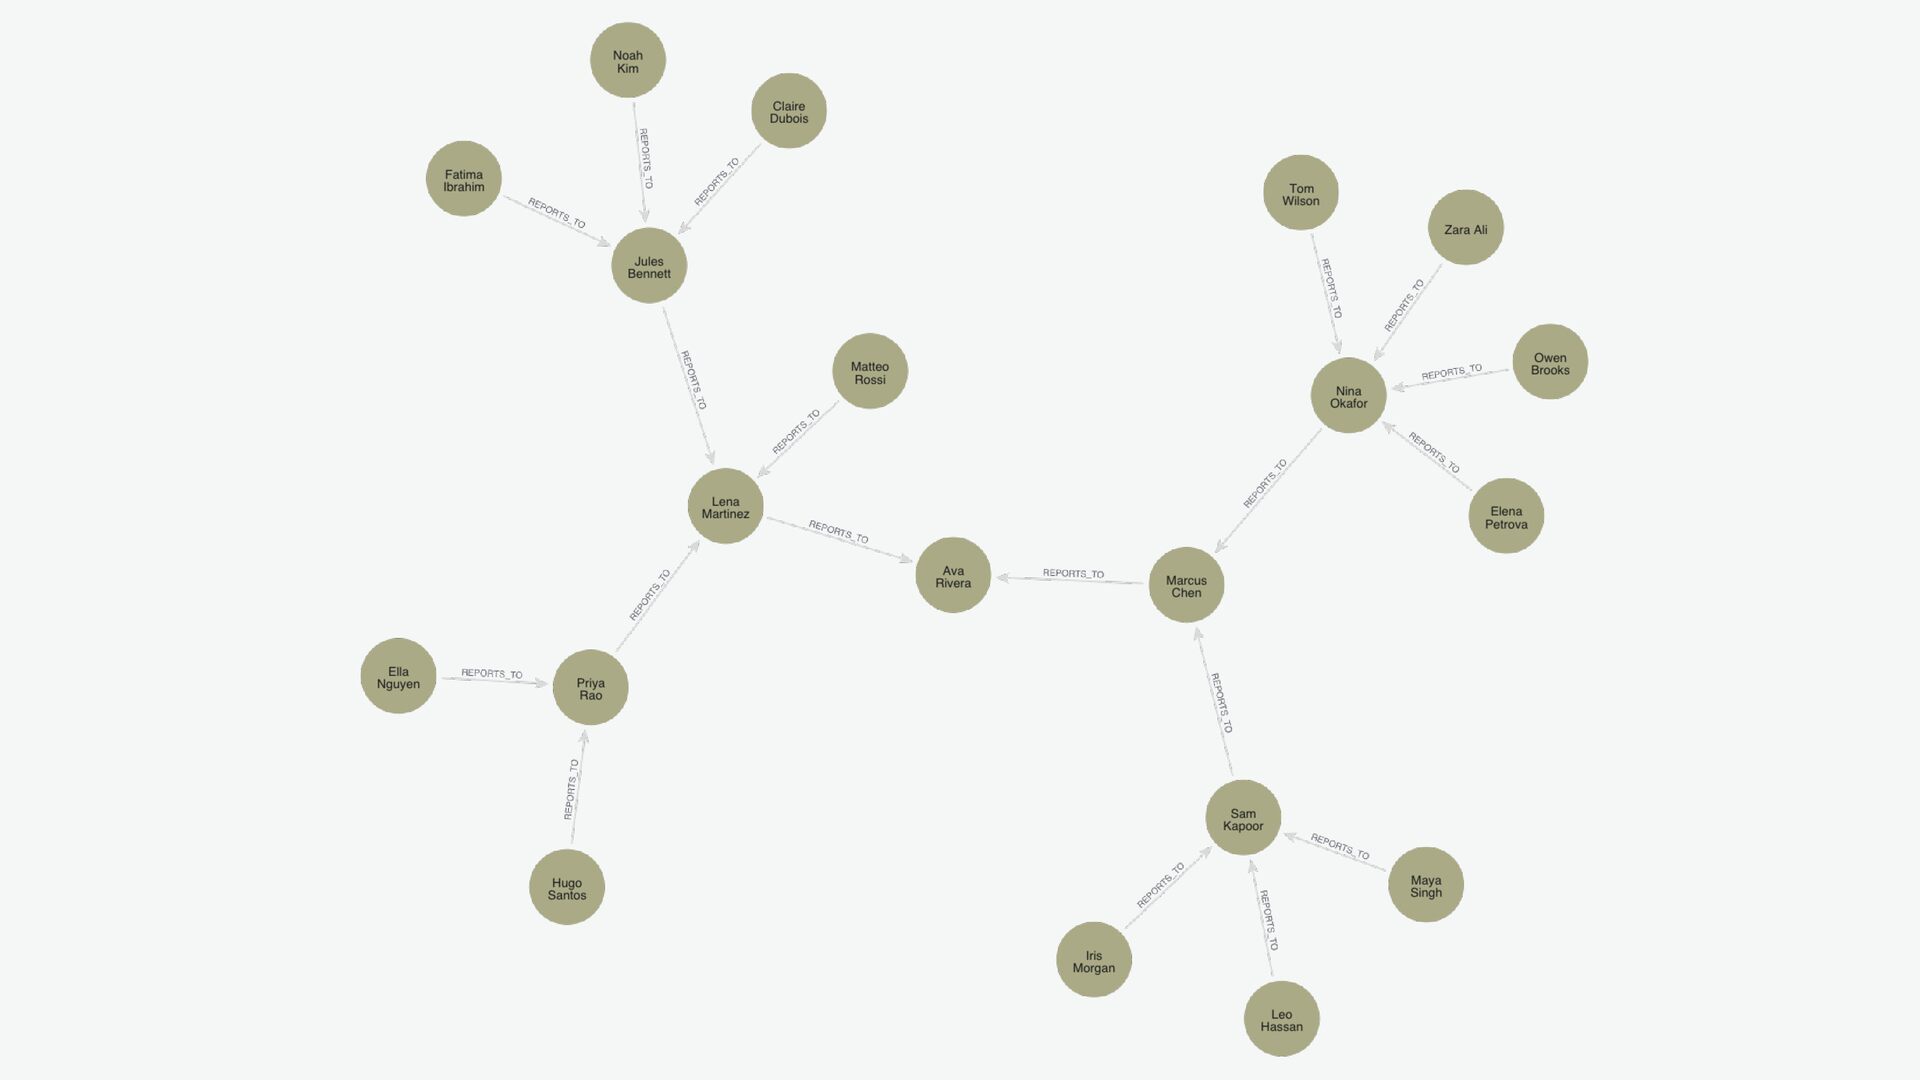
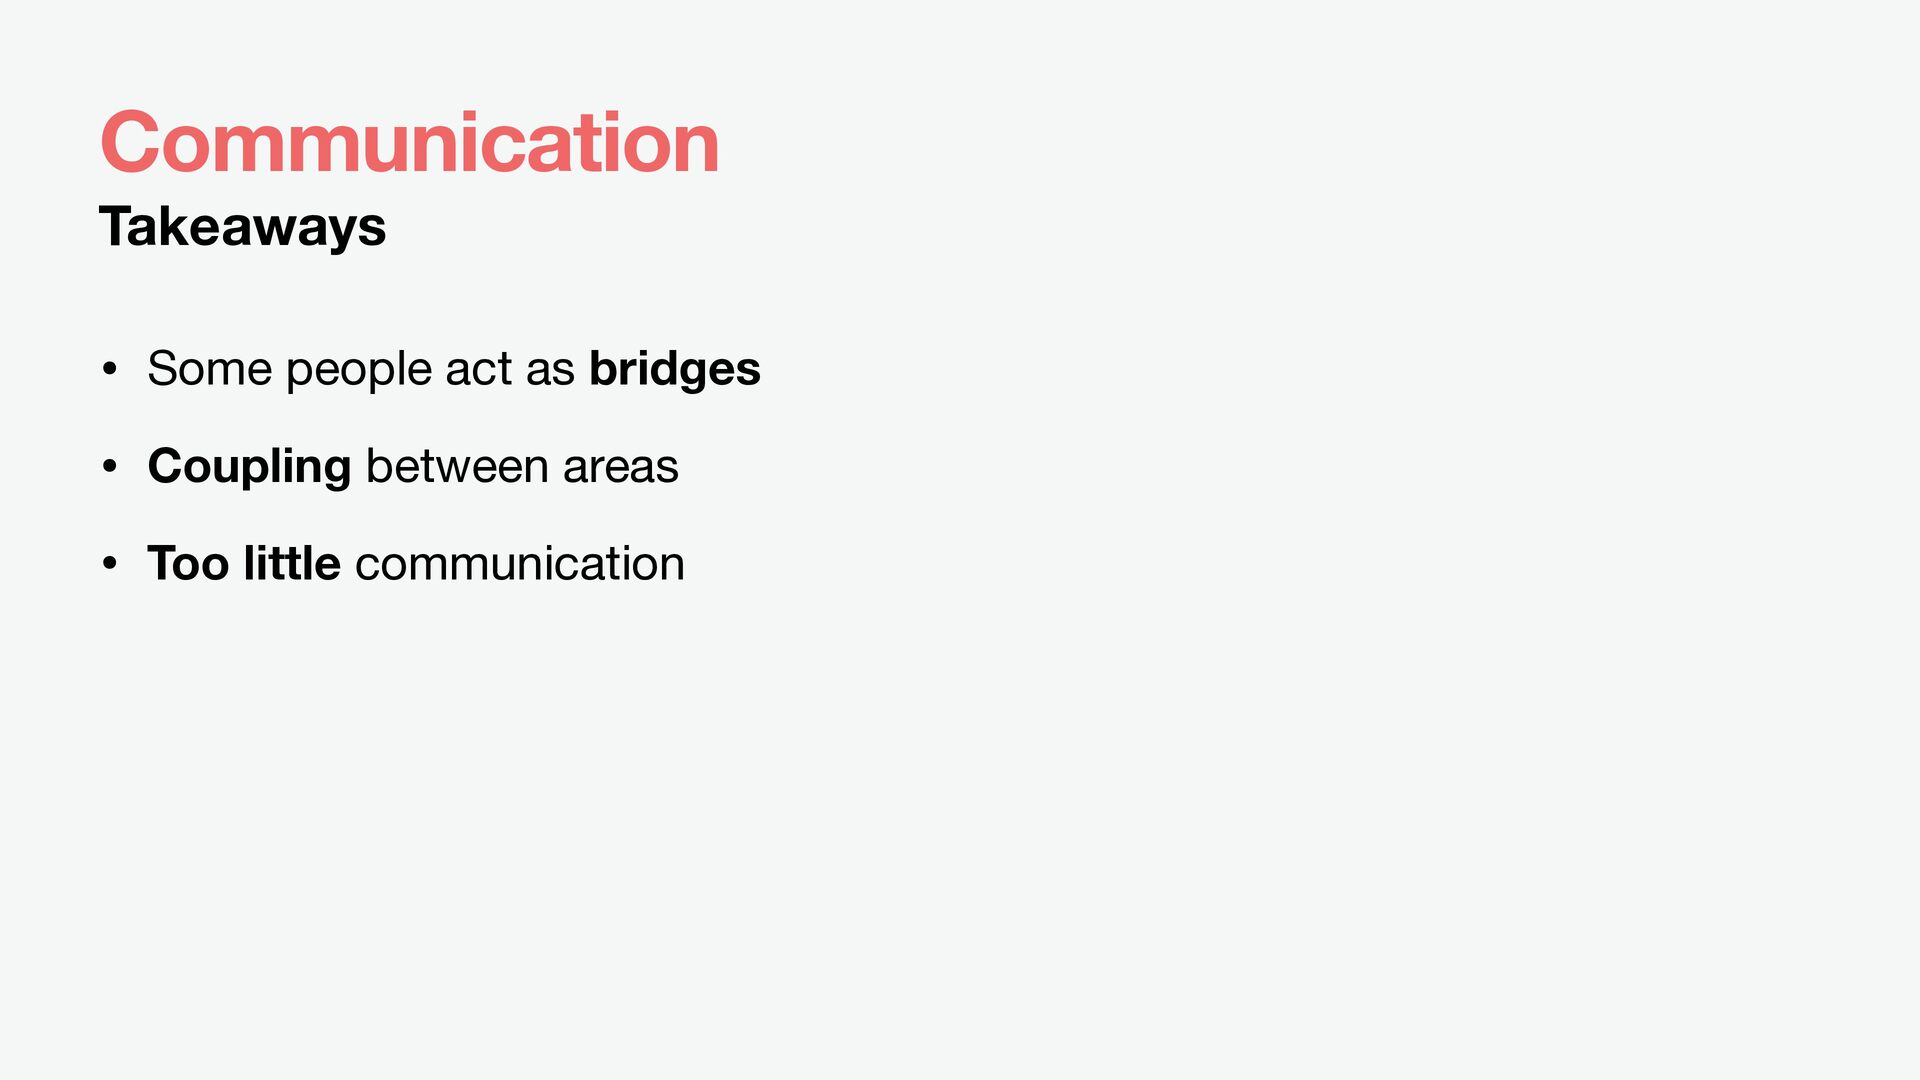
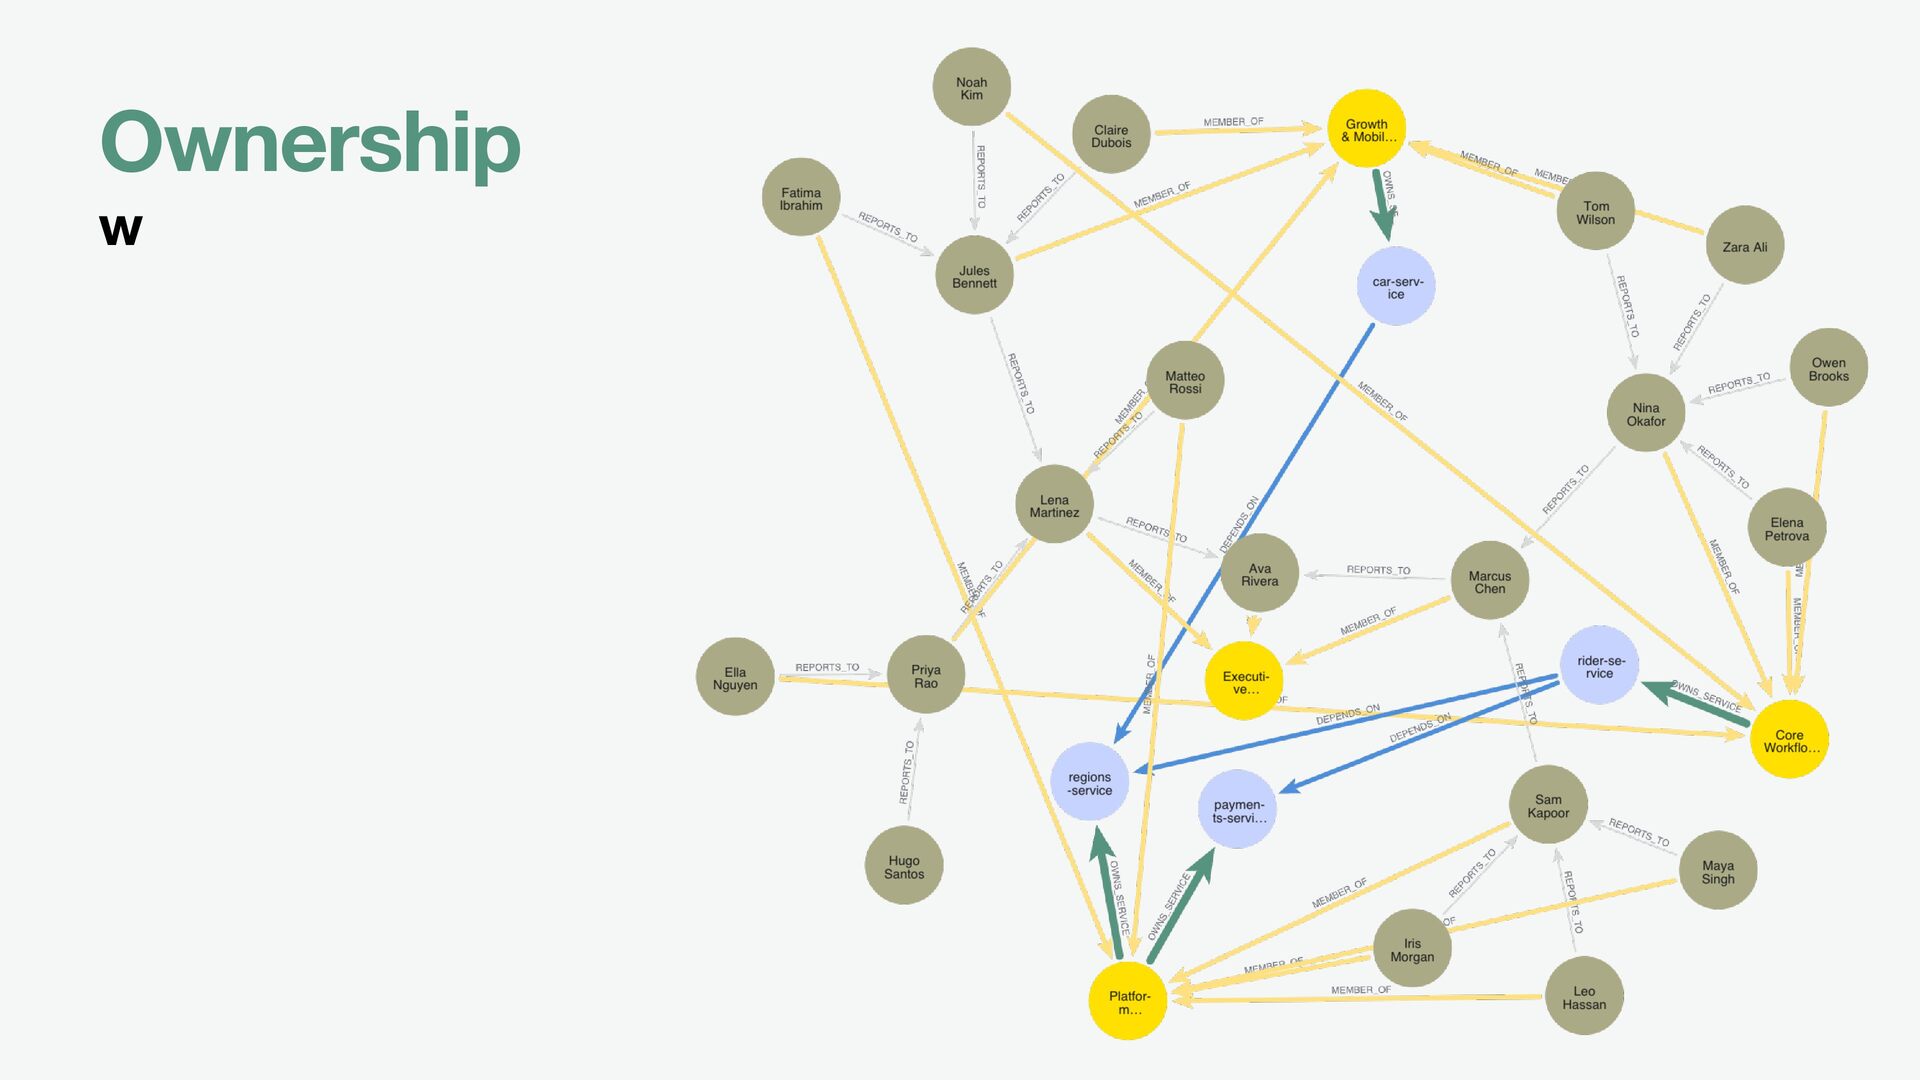
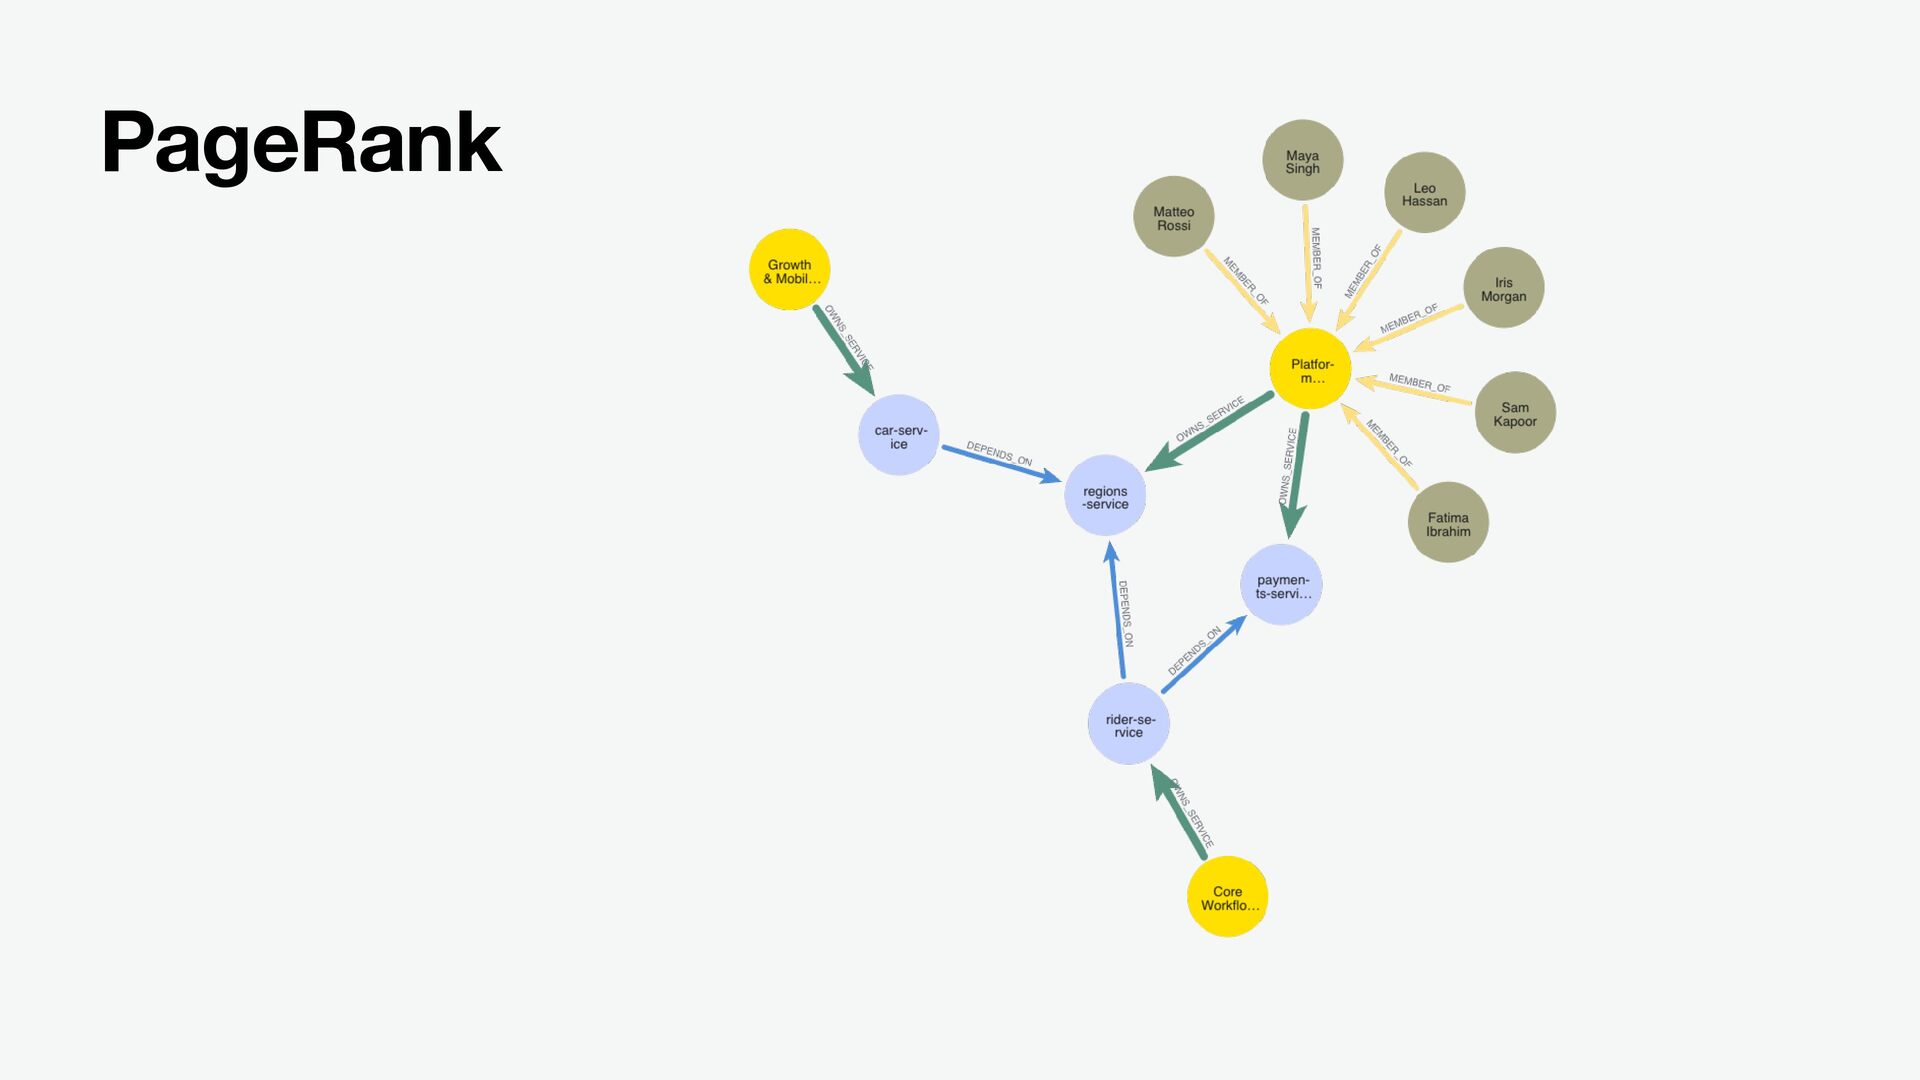
What if we could map who is involved in a project, which teams frequently interact, and where the bottlenecks are? What if we could identify pockets where knowledge accumulates, as well as the areas that are left in the dark? What if we could leverage the people who act as bridges and support those who unintentionally create isolation?

With such insights, we can enhance our organizational design by bringing teams that need to collaborate closer together while removing the barriers that hamper their efficiency. We could even take it a step further and "test" organizational changes before implementing them by simulating how information would flow in the new structure.

In this talk we'll explore how visualizing your organization as a graph can uncover hidden structures, reveal communication pathways, and help you build better products.

Avatar for Dunya Kirkali

Dunya Kirkali

May 19, 2026

More Decks by Dunya Kirkali

Other Decks in Technology

Transcript

  1. 🌍 • Team Leader at • Co-author of the •

    Engineering Manager’s Compass • Blogger on • blog.incrementalforgetting.tech • Graphs ❤ Dünya Kırkalı
  2. Why graphs Isn’t everything a graph? • Relational Data •

    Relationships are as important as entities • Combine datasets • It let’s you ask interesting questions
  3. Why now Just because Dünya likes graphs? • Layo ff

    s • Reorgs • Hiring freezes • E ffi ciency programs • Platform consolidation • AI-era productivity pressure
  4. ⭐ Northstar Systems • CEO • 1 Chief Product O

    ffi cer • 1 Chief Technology O ffi cer • 4 teams • Core Work fl ows • Growth & Mobile • Platform Experience • Executive Leadership
  5. Communication • Some people act as bridges • Coupling between

    areas • Too little communication Takeaways
  6. Ownership Input • Services • Backstage by Spotify • SERVICEOWNERS

    by GitHub • In-House • CODEOWNERS • GitHub or GitLab
  7. Ownership • Some boundaries are unclear • Not every team

    has balanced amount of ownables • Some teams depend heavily on others Takeaways
  8. Other • Trust • “Who do you go to when

    you need help” • “Who do you think I should talk to” • “Who would hurt the most if they leave” • Documentation • Notion • Con fl uence • Work Items • Jira • Linear
  9. Leiden Community Detection • Finds densely connected clusters • Allows

    you to take a step back • Breaking down monoliths • Designing teams
  10. Betweenness • Finds nodes that sit on many shortest paths

    between other nodes • Identi fi es bridges • Find bottlenecks • Coordination chokepoints
  11. Betweenness • Lena Martinez • Marcus Chen • Fatima Ibrahim

    • Nina Okafor • Matteo Rossi • Jules Bennett • Zara Ali 35.48 35.01 28.40 27.79 25.30 23.20 20.81
  12. PageRank • Rank in fl uence based on incoming connections

    • Identify the most in fl uential people, services, or teams in the graph • Highlight points that require more care
  13. PageRank • regions-service • Lena Martinez • car-service • payments-service

    • Elena Petrova • Growth & Mobile • Marcus Chen • rider-service 1.205 0.660 0.658 0.646 0.615 0.598 0.590 0.584
  14. Pipeline 1. Make your hypothesis 2. Collect data 3. Convert

    them into Cypher queries and import into Neo4j
  15. Pipeline 1. Make your hypothesis 2. Collect data 3. Convert

    them into Cypher queries and import into Neo4j • Each dataset in it’s own DB • Then create a combined DB where you associate all data • Install the Neo4J CLI
  16. Pipeline 1. Make your hypothesis 2. Collect data 3. Convert

    them into Cypher queries and import into Neo4j 4. Use your favourite agent harness
  17. Pipeline 1. Make your hypothesis 2. Collect data 3. Convert

    them into Cypher queries and import into Neo4j 4. Use your favourite agent harness 5. Correlate with other data sources
  18. Pipeline 1. Make your hypothesis 2. Collect data 3. Convert

    them into Cypher queries and import into Neo4j 4. Use your favourite agent harness 5. Correlate with other data sources 6. Experiment
  19. Pipeline 1. Make your hypothesis 2. Collect data 3. Convert

    them into Cypher queries and import into Neo4j 4. Use your favourite agent harness 5. Correlate with other data sources 6. Experiment 7. Repeat
  20. Considerations • Ethics • Con fi dentiality • Anonymity •

    Expectations • It’s not a 💊, it’s a 🔍 • You always need to interpret the data • Leverage LLMs to pose your questions
  21. Acknowledgements • 📖 Hidden power of social networks
 by Andrew

    Parker and Rob Cross • 📖 Linked
 by Albert-László Barabási • 🎤 Engineering Leadership through a Social Network Lens
 by Gabriel Ramirez • 🫶 Support
 by Maxim Schepelin
  22. Resources • SERVICEOWNERS by GitHub • CodeScene • Backstage by

    Spotify • Understanding the Leiden Algorithm • Pi Coding Agent • Neo4j