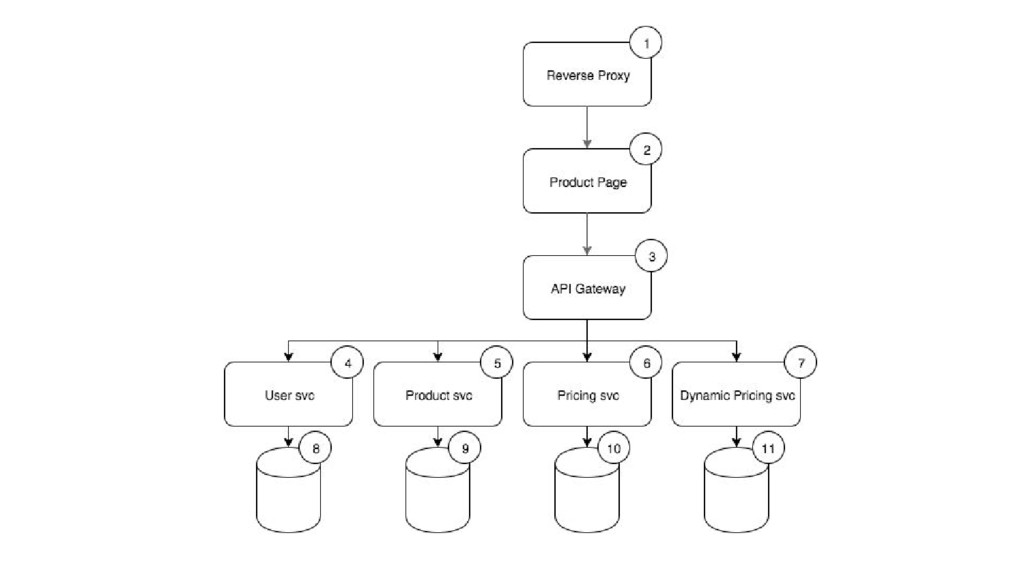
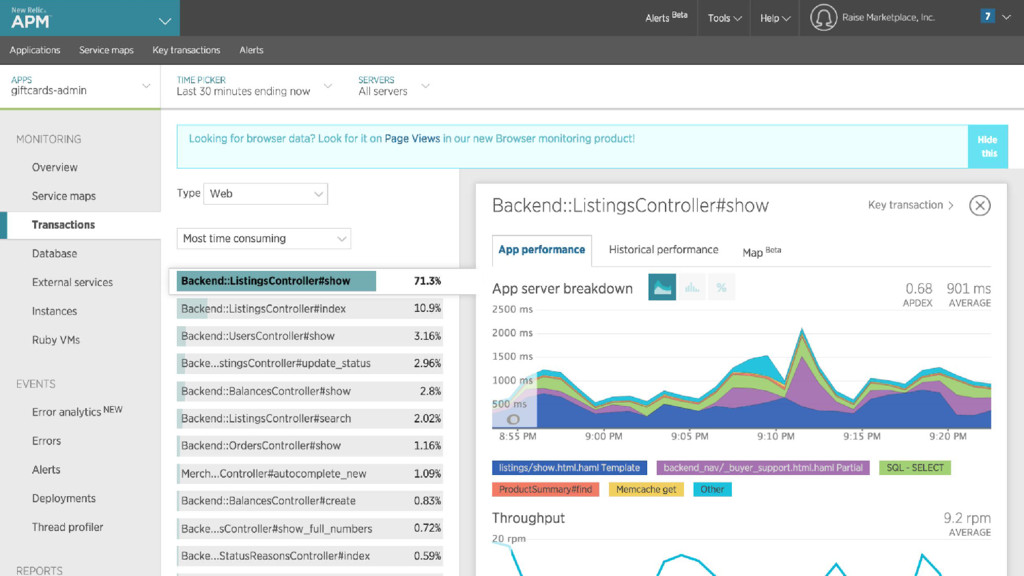
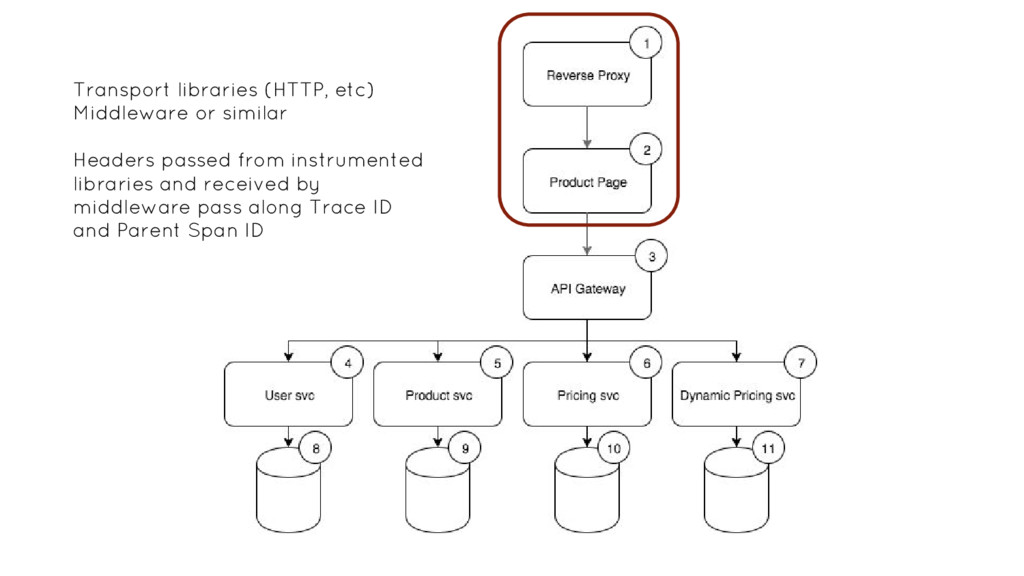
Once you’ve broken up your monolithic application into a micro services architecture like everyone’s been telling you to you’ll come upon a horrible realization. The profiling and analysis tools you’ve been using to monitor the performance of your application are no longer quite as useful as they once were. Most traditional profilers have no way to cross process and service boundaries and give meaningful insights into inter-process performance issues. This session will demonstrate the a tracing infrastructure you can put in place to monitor your distributed service oriented architecture. You’ll discover just how easy it is to instrument a system for tracing and visualize tracing data for highlighting issues and insights.