Upgrade to Pro — share decks privately, control downloads, hide ads and more …

And the beats go on! - SoftShake 2016

Elastic Co
October 28, 2016

And the beats go on! - SoftShake 2016

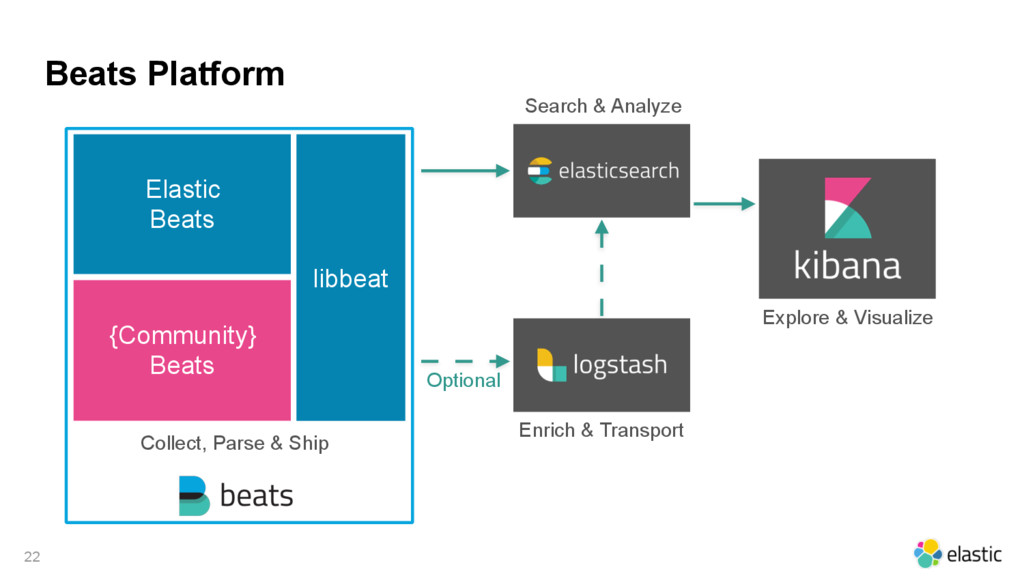
Venez découvrir les nouveaux Data Shippers pour Elasticsearch:

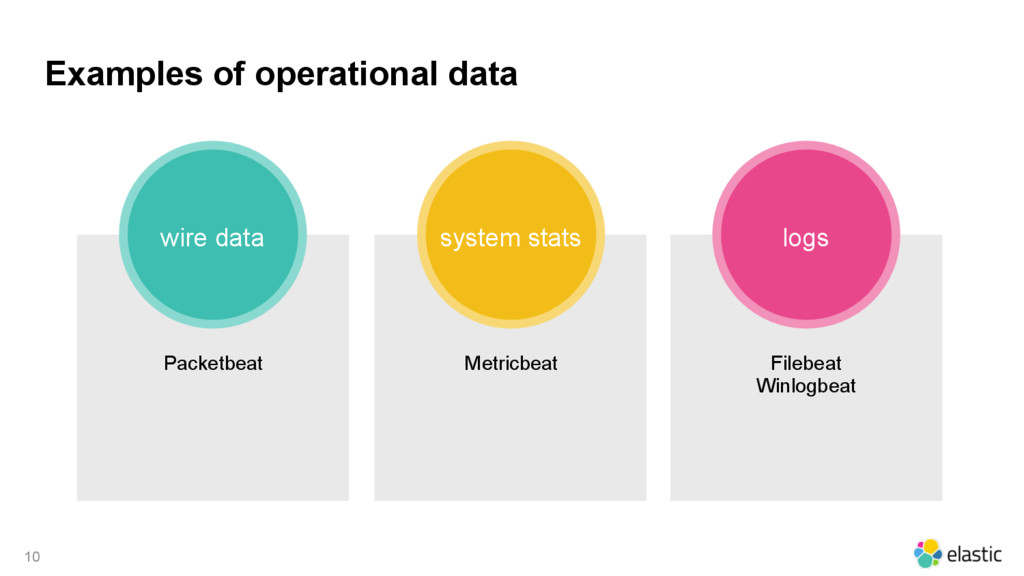
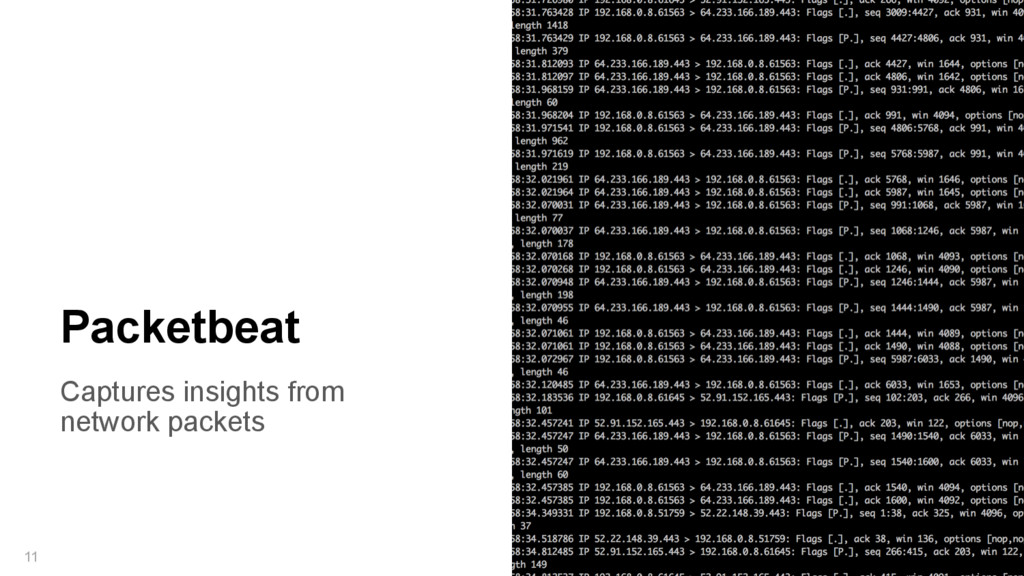
Packetbeat : décortiquez les protocoles réseau
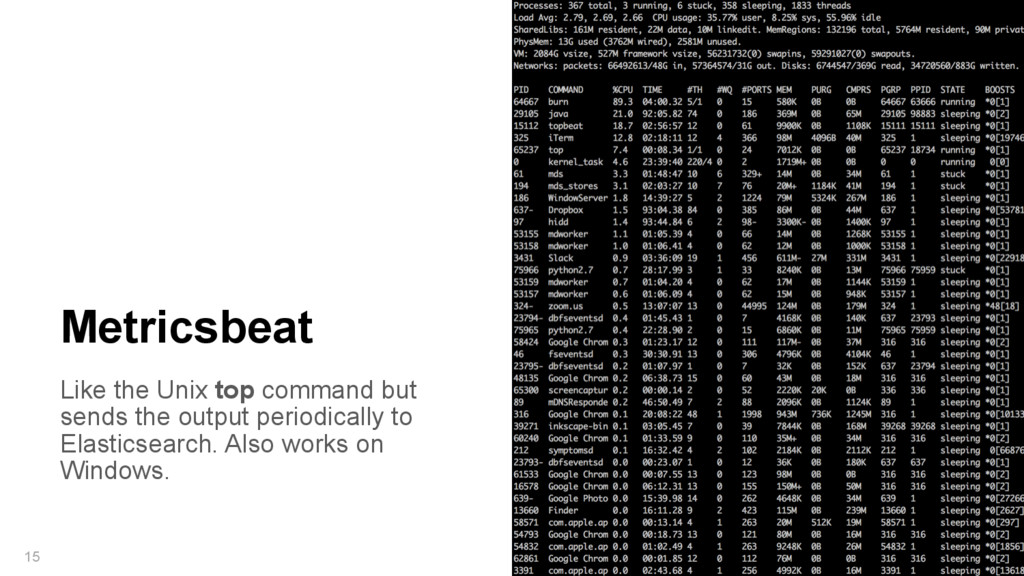
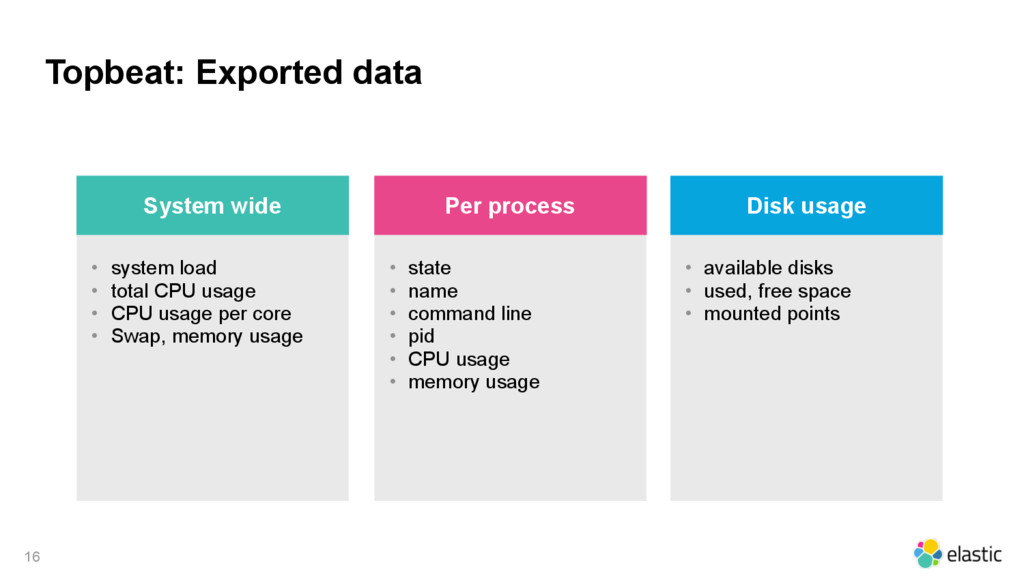
Metricbeat: récoltez vos métriques
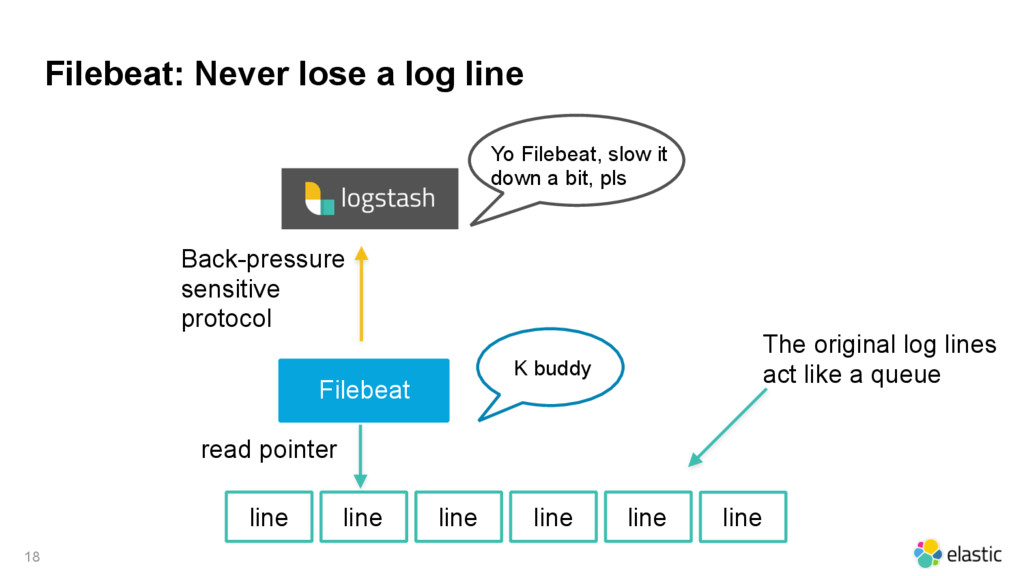
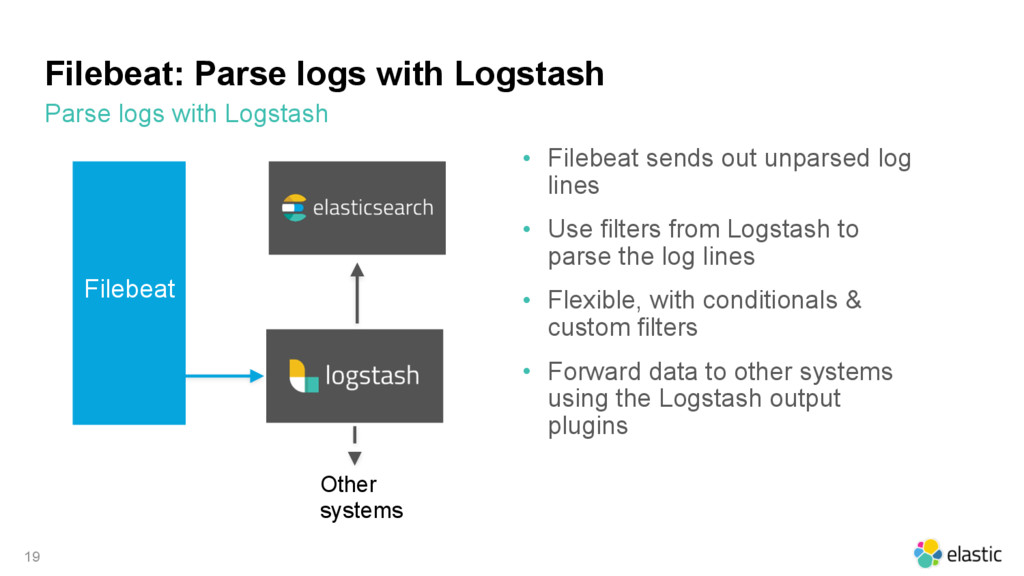
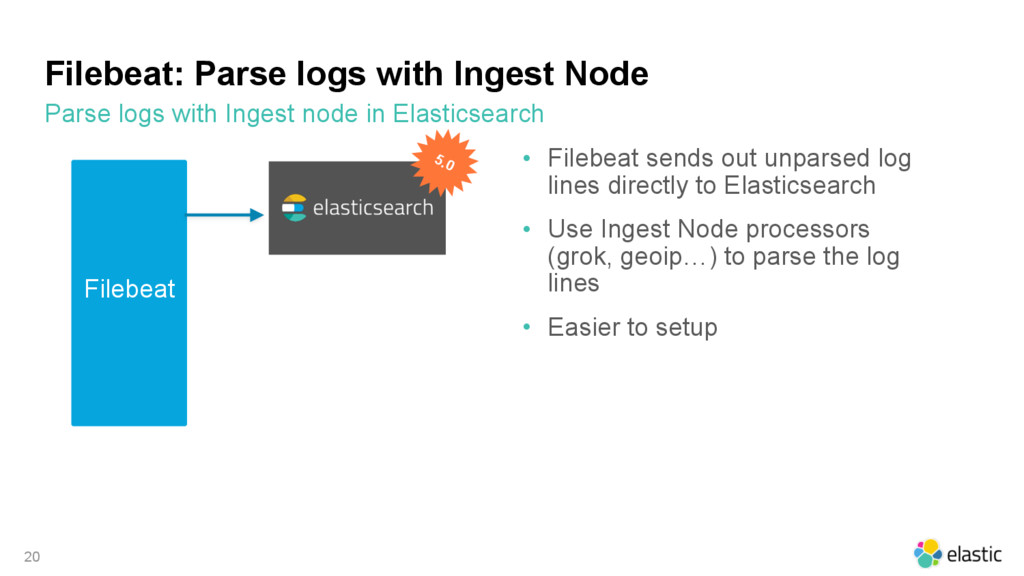
Filebeat: analysez vos logs en temps réel ou transmettez les vers logstash pour enrichissement
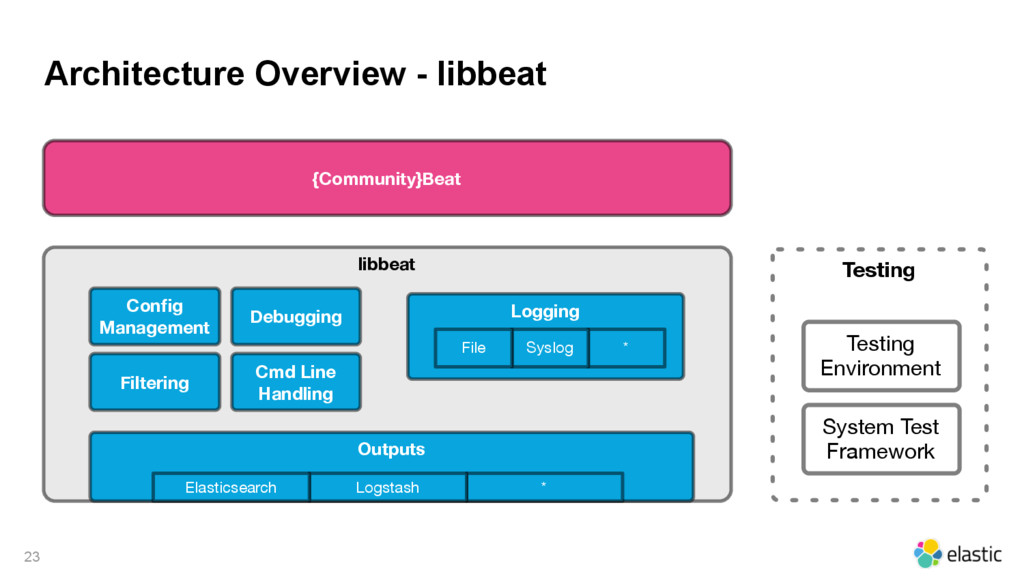
Et comment contribuer au mix et ajouter vos propres beats avec Libbeat.

http://www.kora.li/admin.html#/index/p?u=dadoonet&s=beats&c=softshake&e=Donkey_Kong

Elastic Co

October 28, 2016
Tweet

More Decks by Elastic Co

Other Decks in Technology

Transcript

  1. 3

  2. 4 The only Elasticsearch as a Service offering powered by

    the creators of the Elastic Stack • Always runs on the latest software • One-click to scale/upgrade with no downtime • Free Kibana and backups every 30 minutes • Dedicated, SLA-based support • Easily add X-Pack features: security (Shield), alerting (Watcher), and monitoring (Marvel) • Pricing starts at $45 a month
  3. 5

  4. Examples of operational data 10 wire data system stats logs

    Packetbeat Metricbeat Filebeat Winlogbeat
  5. Sniffing the network traffic 12 Client Server sniff sniff •

    Copy traffic at OS or hardware level • Is completely passive • ZERO latency overhead • Not in the request/response path, cannot break your application
  6. Packetbeat: Real-time application monitoring 13 1 2 3 4 capture

    network traffic decodes network traffic correlates request with response in transactions extract measurements like response time, status 5 group meta info in json objects to send to Elasticsearch It does all of these in real-time directly on the target servers.
  7. Like the Unix top command but sends the output periodically

    to Elasticsearch. Also works on Windows. 15 Metricsbeat
  8. Topbeat: Exported data 16 • system load • total CPU

    usage • CPU usage per core • Swap, memory usage System wide • state • name • command line • pid • CPU usage • memory usage Per process • available disks • used, free space • mounted points Disk usage
  9. Filebeat: Never lose a log line 18 line line line

    line line read pointer Filebeat Back-pressure sensitive protocol Yo Filebeat, slow it down a bit, pls K buddy line The original log lines act like a queue
  10. Filebeat: Parse logs with Logstash Parse logs with Logstash 19

    • Filebeat sends out unparsed log lines • Use filters from Logstash to parse the log lines • Flexible, with conditionals & custom filters • Forward data to other systems using the Logstash output plugins Filebeat Other systems
  11. Filebeat: Parse logs with Ingest Node Parse logs with Ingest

    node in Elasticsearch 20 • Filebeat sends out unparsed log lines directly to Elasticsearch • Use Ingest Node processors (grok, geoip…) to parse the log lines • Easier to setup Filebeat 5.0
  12. Beats Platform 22 Explore & Visualize Search & Analyze Enrich

    & Transport Optional libbeat {Community} Beats Elastic Beats Collect, Parse & Ship
  13. Architecture Overview - libbeat 23 {Community}Beat libbeat Outputs * Logstash

    Elasticsearch Config Management Debugging Logging * Syslog File Cmd Line Handling Filtering Testing Testing Environment System Test Framework
  14. 25

  15. 26