Genomic mapping in outbred mice reveals overlap in genetic susceptibility for HZE ion and γ-ray induced tumors
2016 TAGC IMGS Conference in Orlando, FL. Determining the significance of space radiation exposures: high resolution genomic mapping to determine overlap in susceptibility loci to HZE ion and γ-ray induced tumors
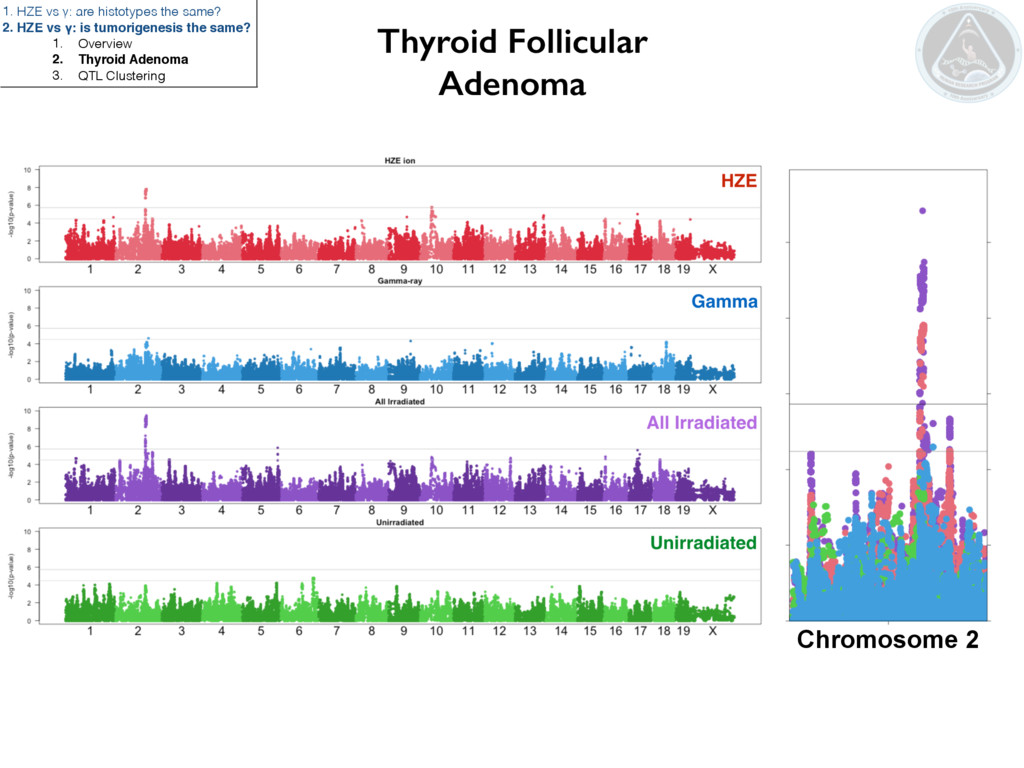
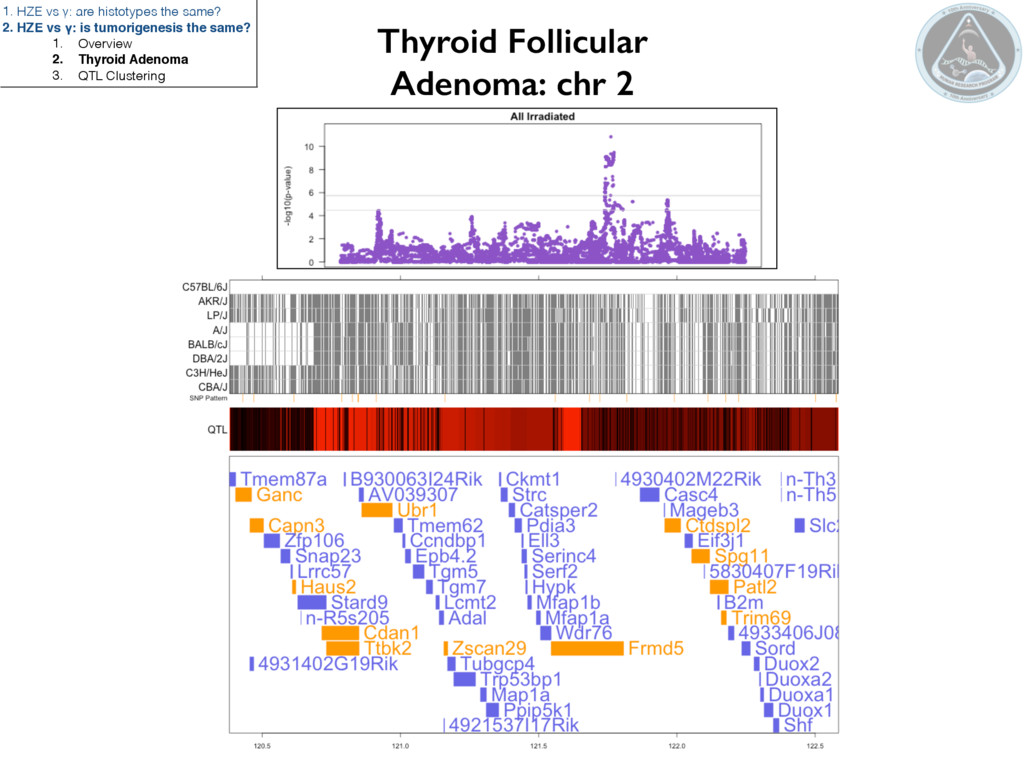
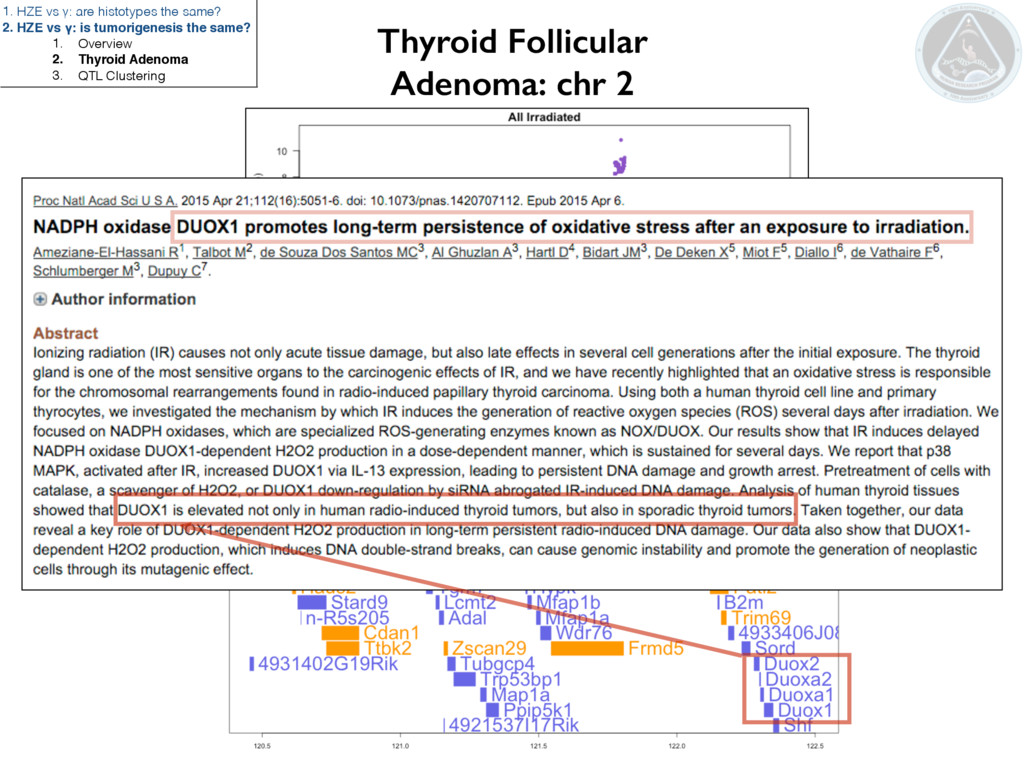
Determining the significance of space radiation exposures: high resolution genomic mapping to determine overlap in susceptibility loci to HZE ion and γ-ray induced tumors Chromosome 2
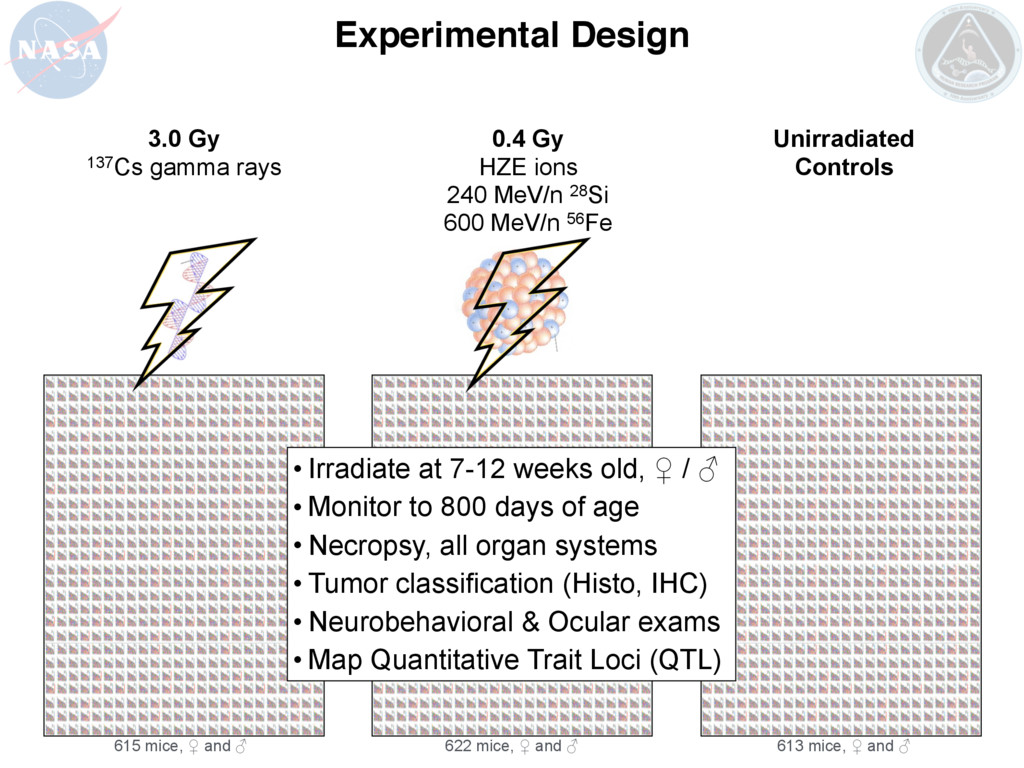
to represent human heterogeneity that will elucidate the spectrum of tumor types caused by HZE nuclei as well as possible differences compared to γ-rays.
to represent human heterogeneity that will elucidate the spectrum of tumor types caused by (1) HZE nuclei as well as possible differences compared to γ-rays.
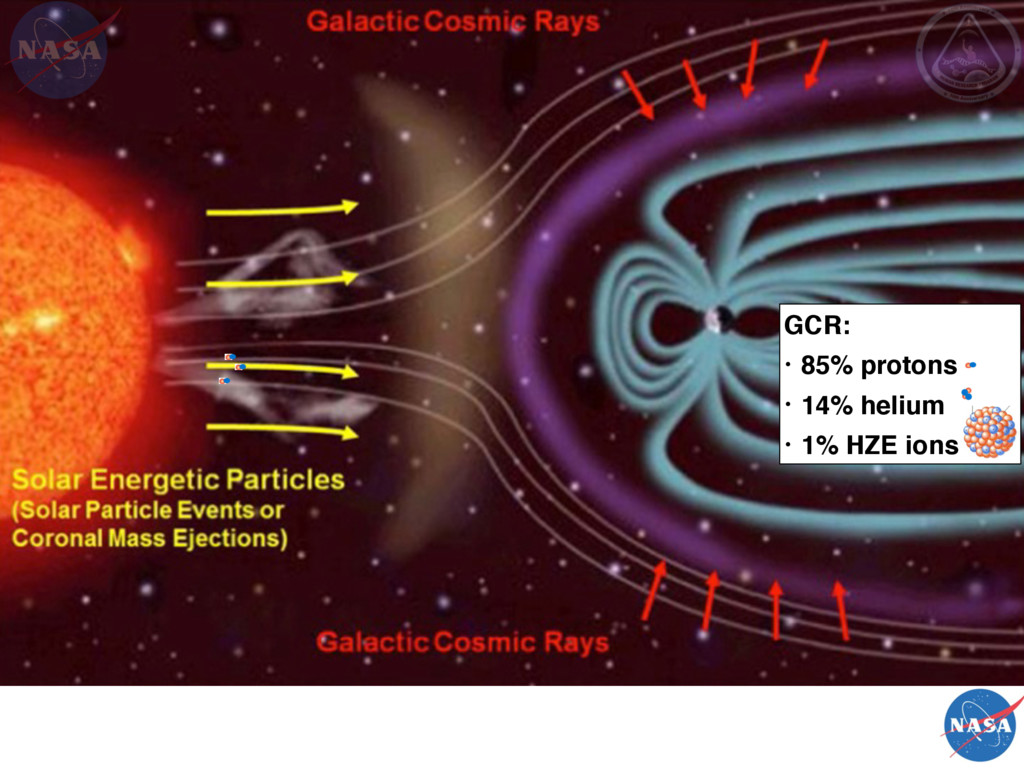
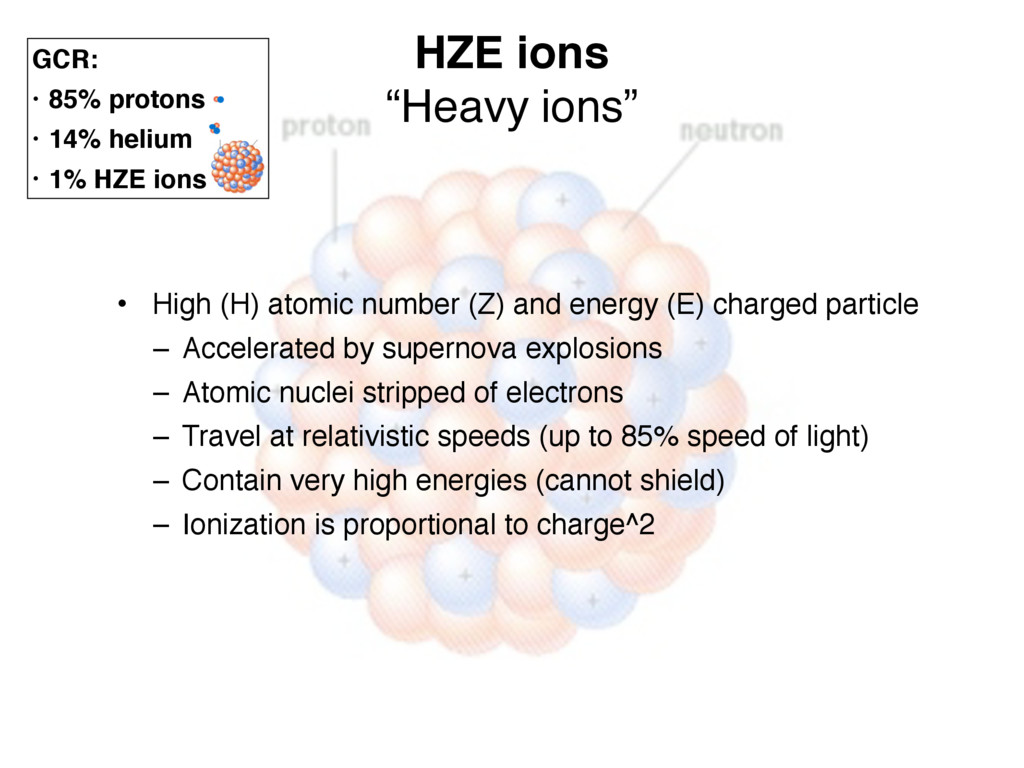
and energy (E) charged particle – Accelerated by supernova explosions – Atomic nuclei stripped of electrons – Travel at relativistic speeds (up to 85% speed of light) – Contain very high energies (cannot shield) – Ionization is proportional to charge^2 GCR: • 85% protons • 14% helium • 1% HZE ions
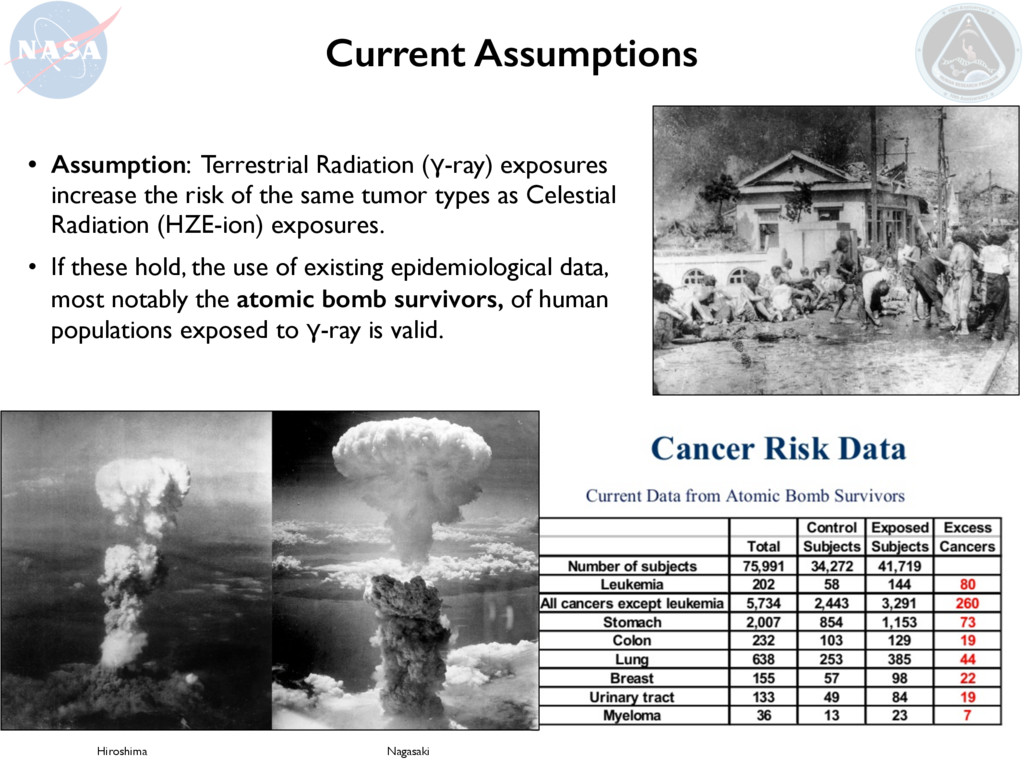
the same tumor types as Celestial Radiation (HZE-ion) exposures. • If these hold, the use of existing epidemiological data, most notably the atomic bomb survivors, of human populations exposed to γ-ray is valid. Hiroshima Nagasaki Current Assumptions
variance • thus fewer mice are needed to detect statistical differences Disadvantages of using inbred mice: • strain-specific responses may obscure the variability we expect in a genetically diverse population such as humans Toxicity Studies using Inbred mice
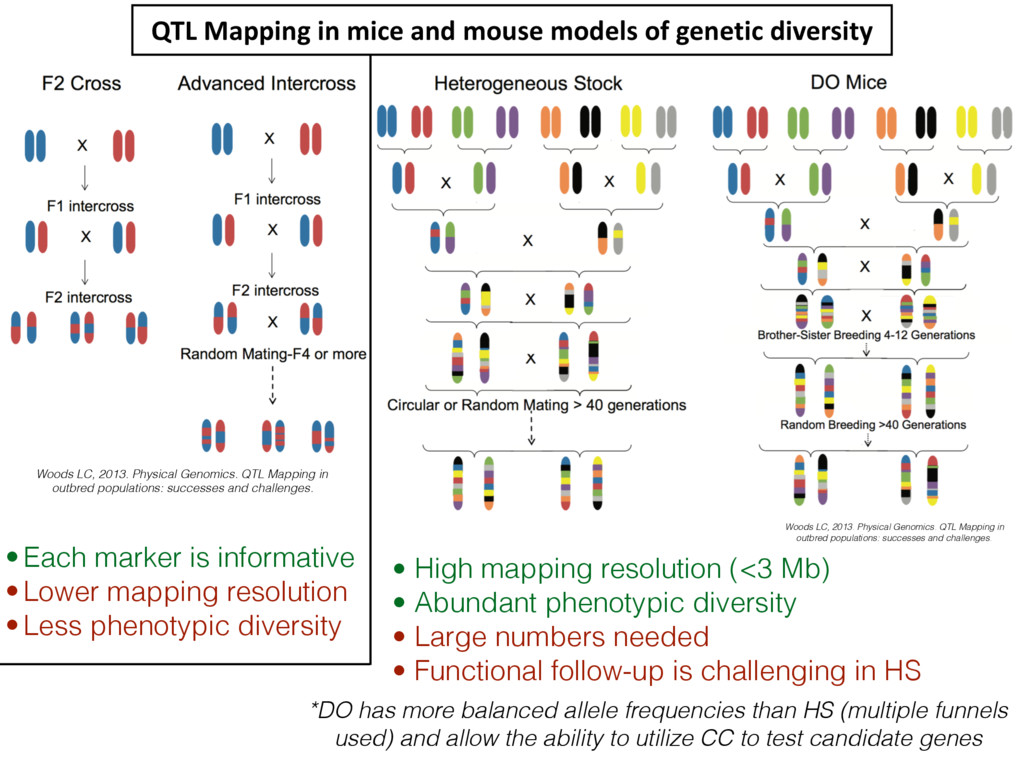
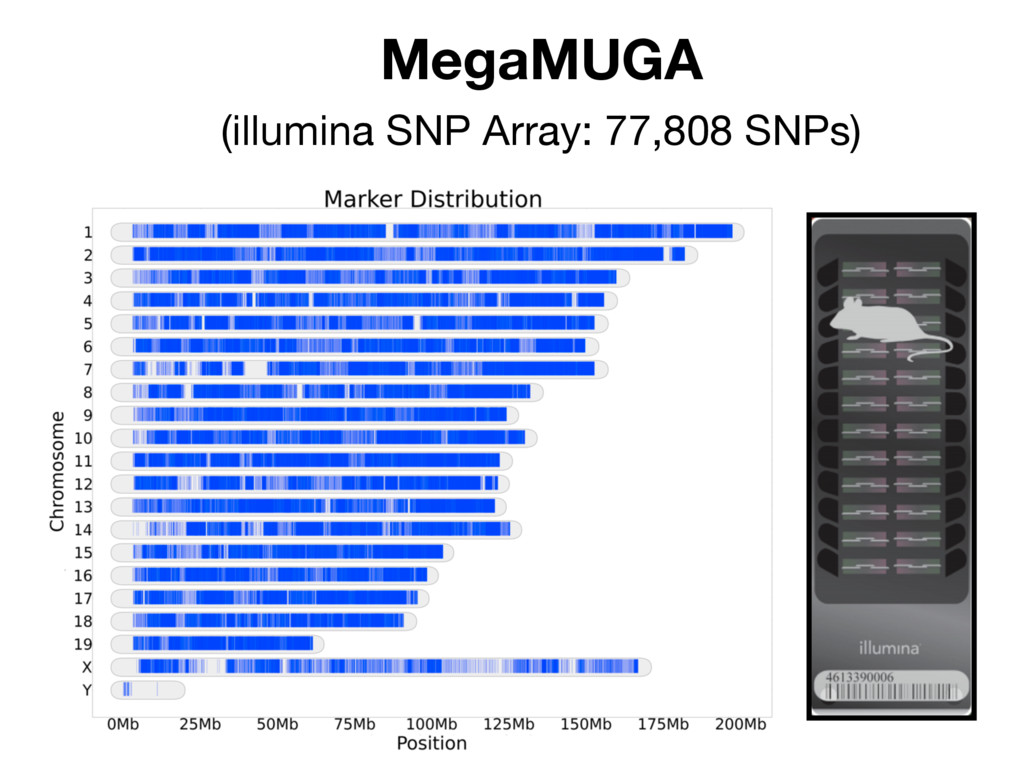
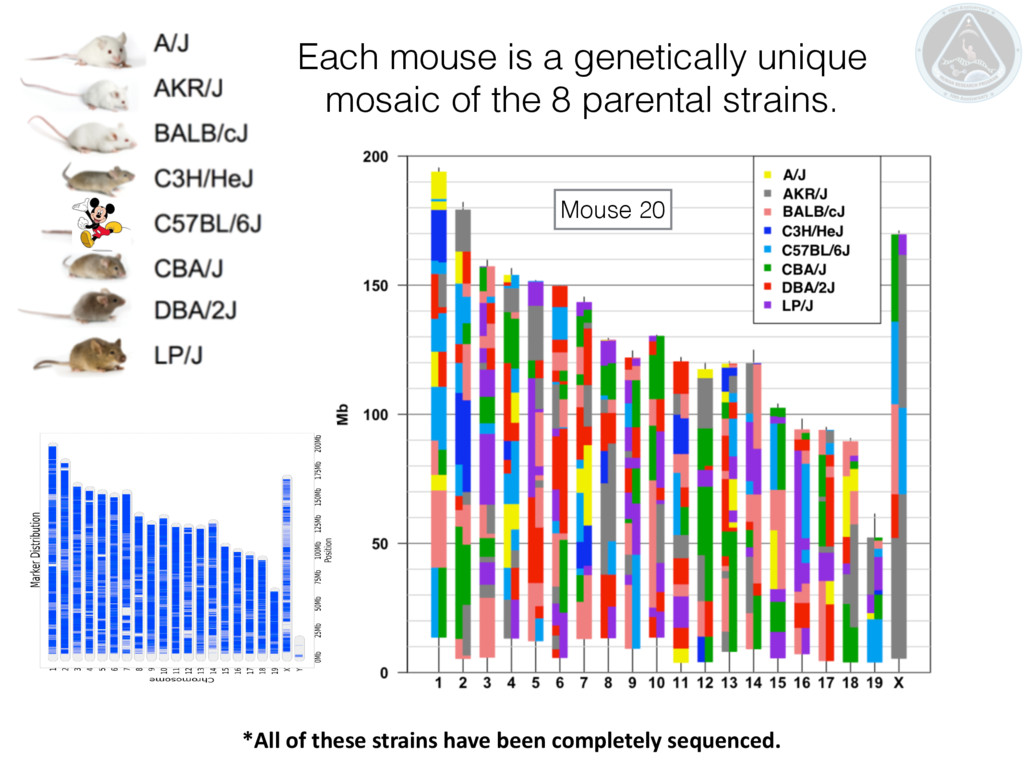
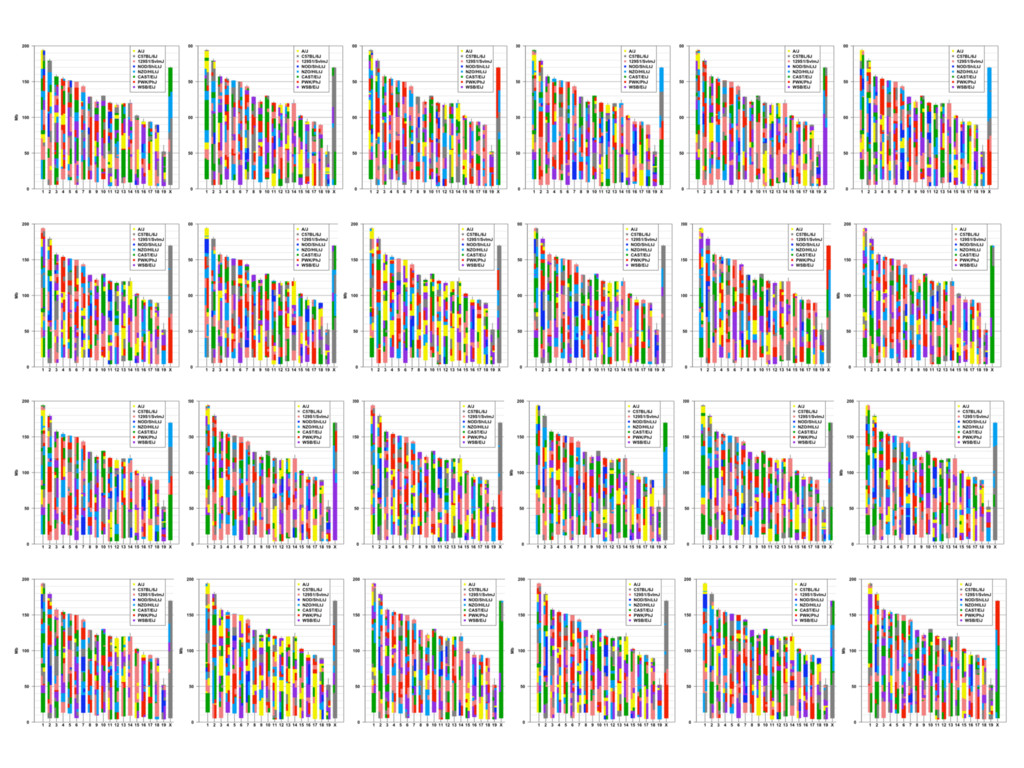
• High mapping resolution (<3 Mb) • Abundant phenotypic diversity • Large numbers needed • Functional follow-up is challenging in HS *DO has more balanced allele frequencies than HS (multiple funnels used) and allow the ability to utilize CC to test candidate genes QTL Mapping in mice and mouse models of genetic diversity Woods LC, 2013. Physical Genomics. QTL Mapping in outbred populations: successes and challenges. Woods LC, 2013. Physical Genomics. QTL Mapping in outbred populations: successes and challenges.
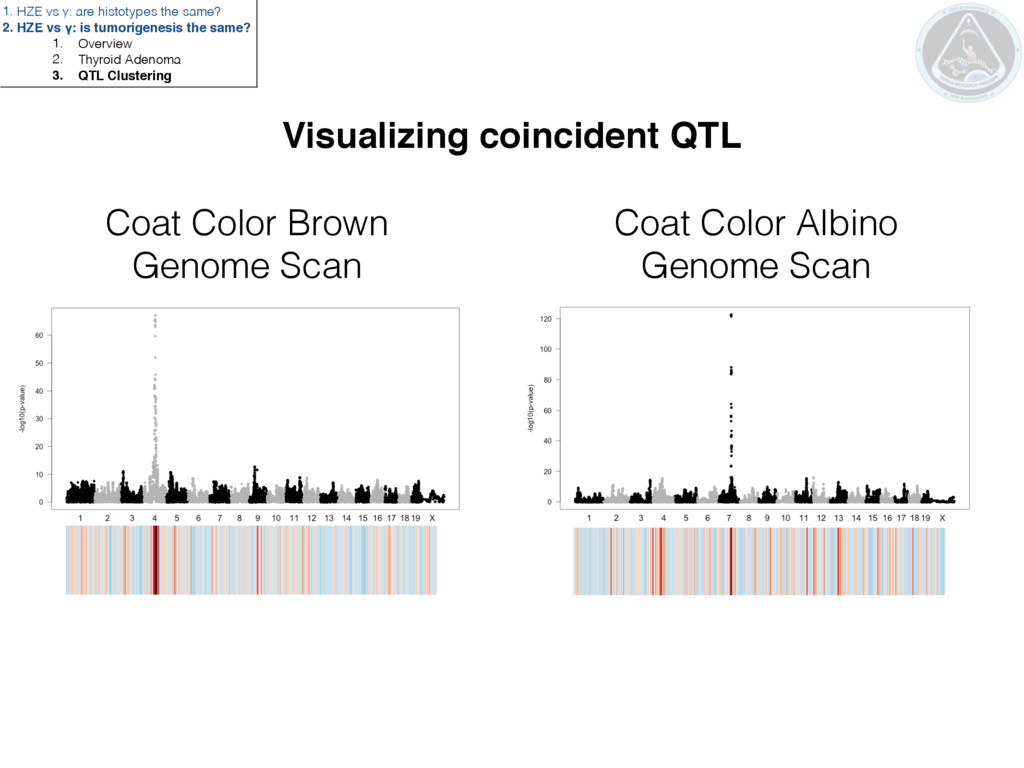
Visualizing coincident QTL 1. HZE vs γ: are histotypes the same? 2. HZE vs γ: is tumorigenesis the same? 1. Overview 2. Thyroid Adenoma 3. QTL Clustering
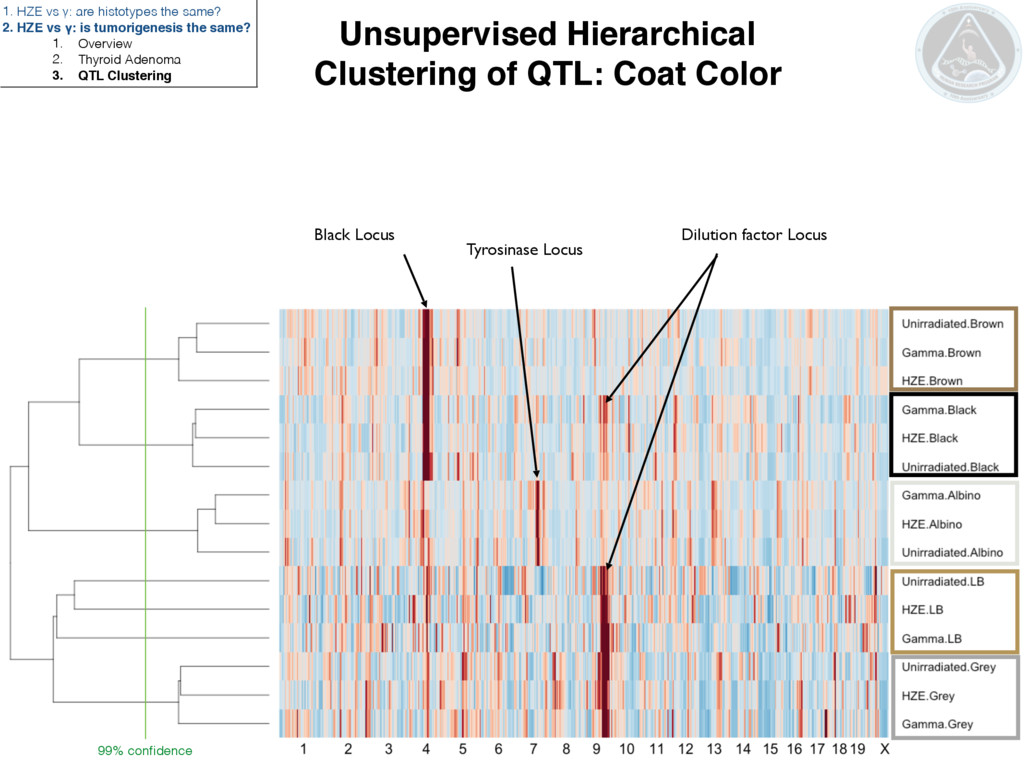
Locus Dilution factor Locus 1. HZE vs γ: are histotypes the same? 2. HZE vs γ: is tumorigenesis the same? 1. Overview 2. Thyroid Adenoma 3. QTL Clustering 99% confidence
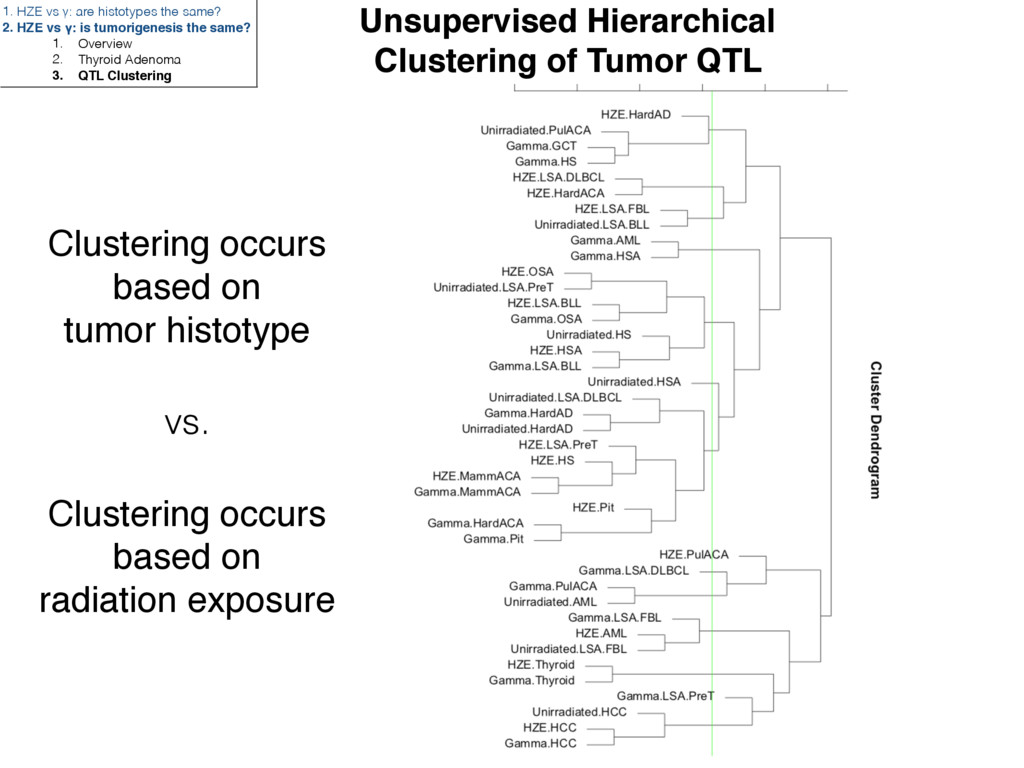
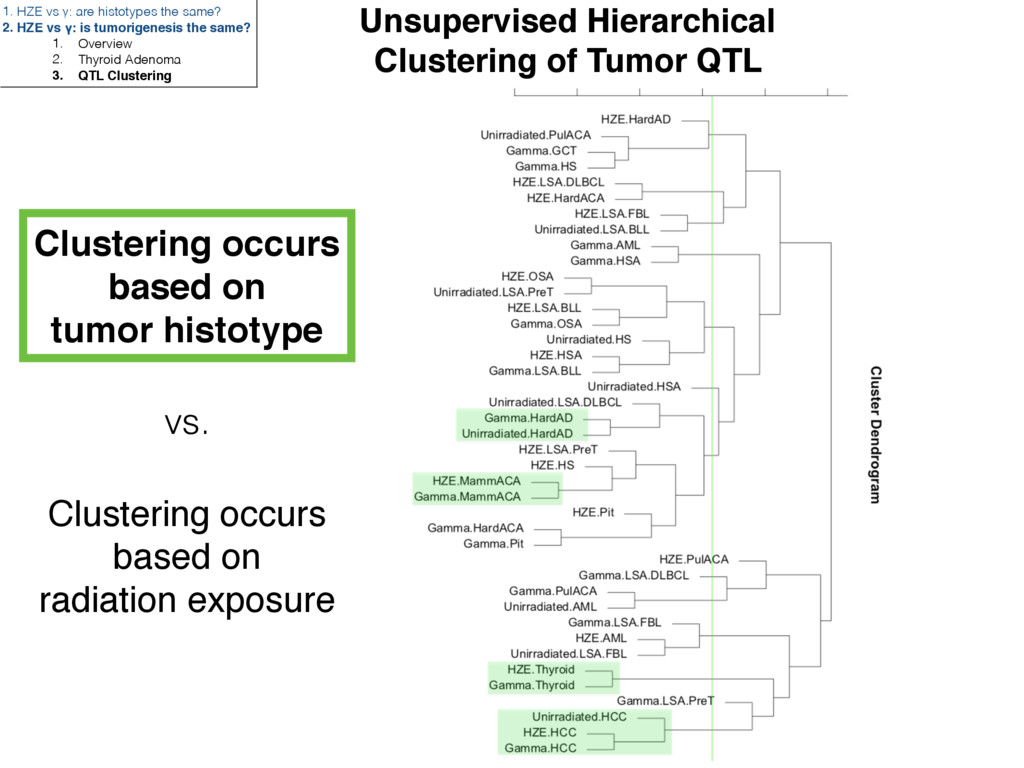
radiation exposure vs. Unsupervised Hierarchical Clustering of Tumor QTL 1. HZE vs γ: are histotypes the same? 2. HZE vs γ: is tumorigenesis the same? 1. Overview 2. Thyroid Adenoma 3. QTL Clustering
radiation exposure vs. Unsupervised Hierarchical Clustering of Tumor QTL 1. HZE vs γ: are histotypes the same? 2. HZE vs γ: is tumorigenesis the same? 1. Overview 2. Thyroid Adenoma 3. QTL Clustering
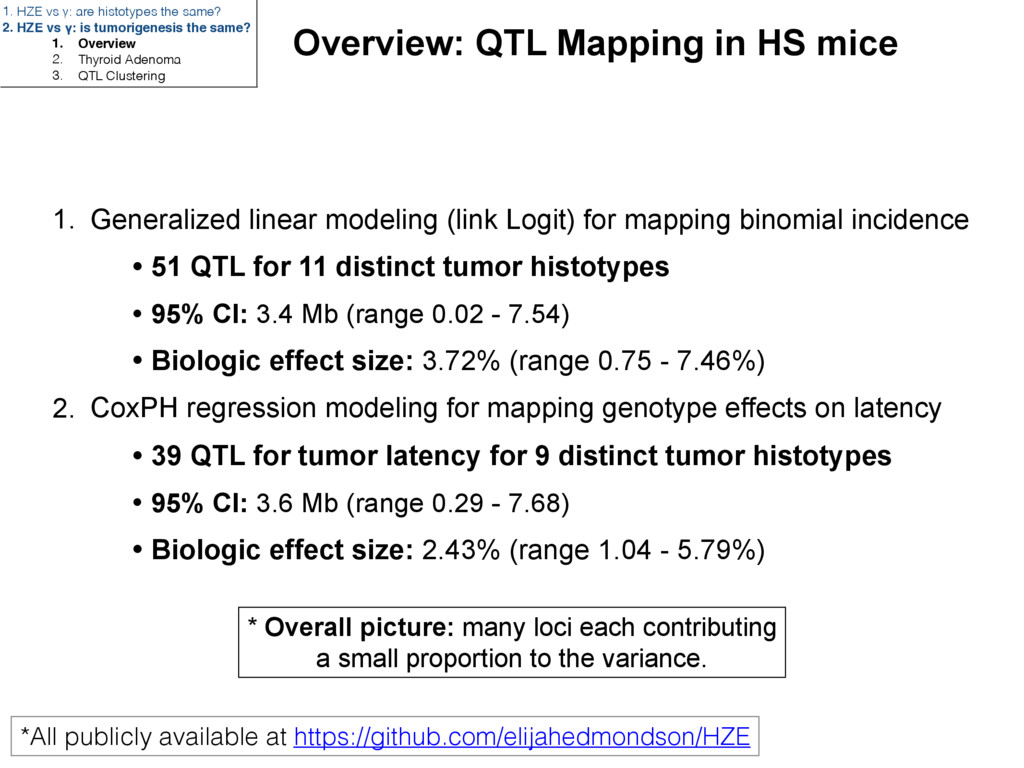
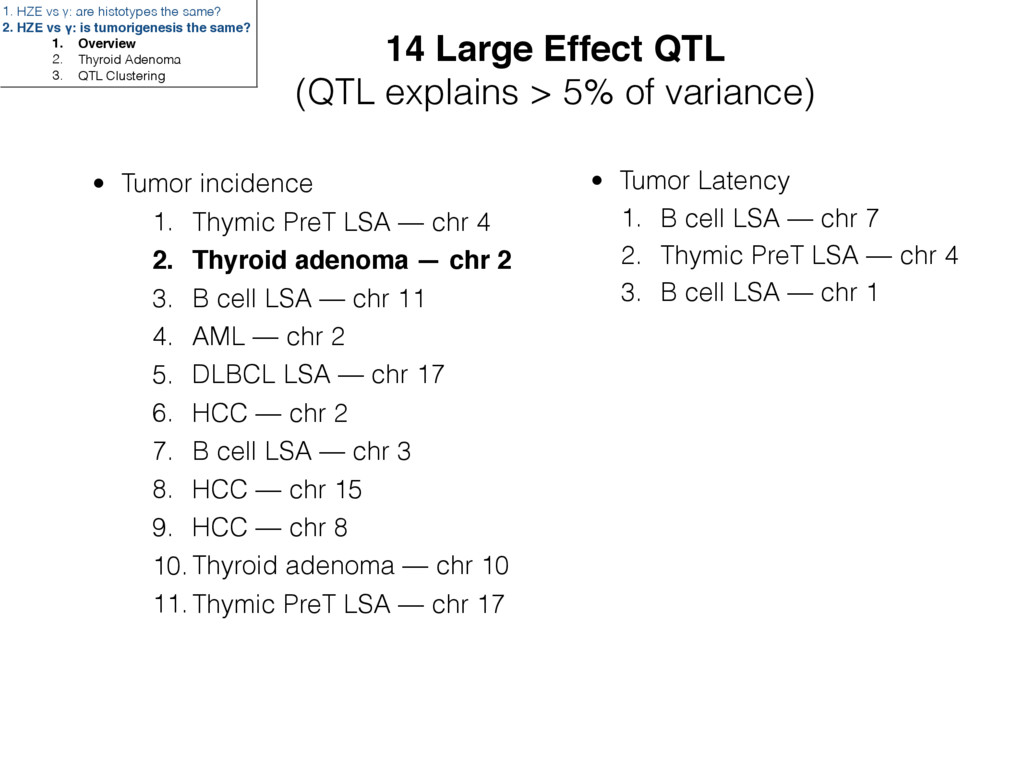
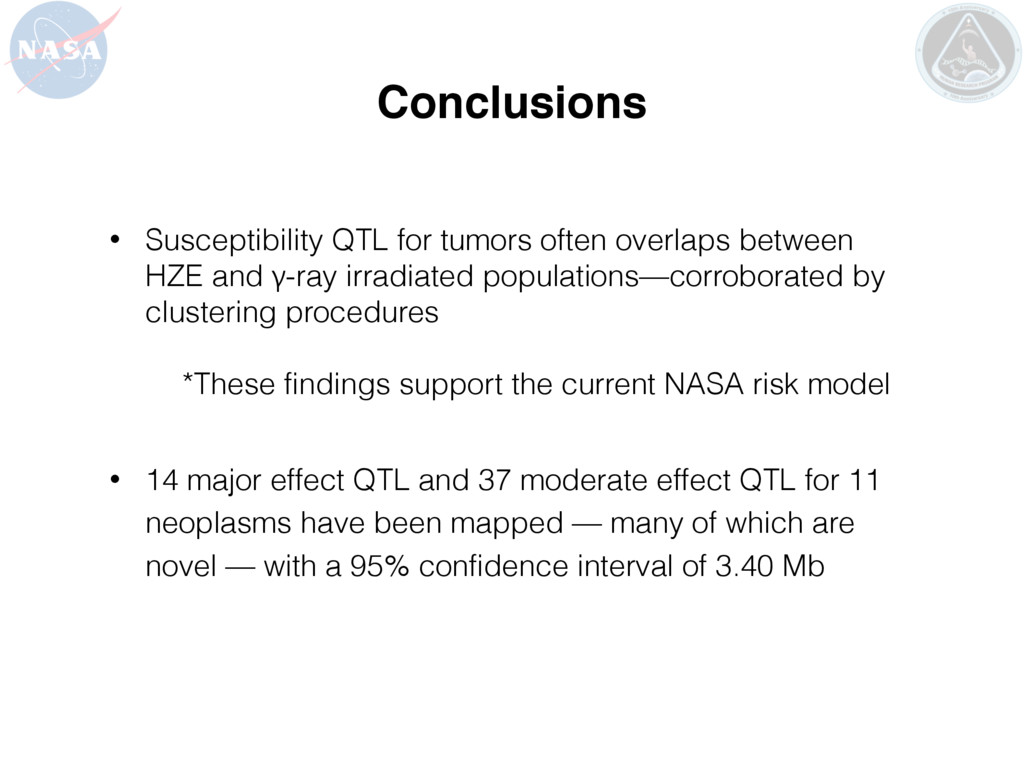
and γ-ray irradiated populations—corroborated by clustering procedures *These findings support the current NASA risk model • 14 major effect QTL and 37 moderate effect QTL for 11 neoplasms have been mapped — many of which are novel — with a 95% confidence interval of 3.40 Mb
Paula Genik Todd Bass Debra Kamstock Jackson Labs Daniel M. Gatti OHSU Ovidiu Dan Iancu John Belknap Jacob Raber Columbia Norman Kleiman International Mammalian Genome Society Funded by NASA grant NNX12AB54G Acknowledgements Elijah Edmondson, DVM DACVP [email protected]
![Elijah Edmondson, DVM DACVP [email protected] Weil Lab, Colorado State Univeristy](https://files.speakerdeck.com/presentations/99a0b3c6183e4cb4a0b1fd387dcb778a/slide_0.jpg)