in outbred mice reveals overlap in genetic susceptibility for HZE ion and γ-ray induced tumors Final Defense MIP Seminar September 13, 2016 Chromosome 2
to represent human heterogeneity that will elucidate the spectrum of tumor types caused by HZE nuclei as well as possible differences compared to γ-rays.
to represent human heterogeneity that will elucidate the spectrum of tumor types caused by (1) HZE nuclei as well as possible differences compared to γ-rays.
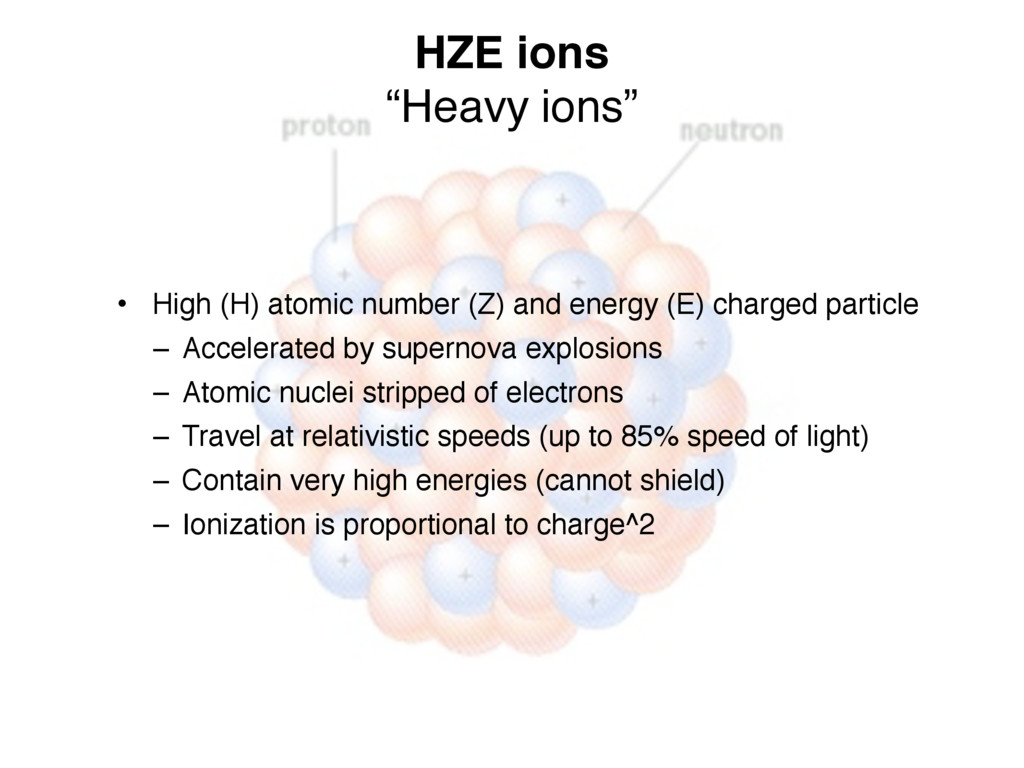
and energy (E) charged particle – Accelerated by supernova explosions – Atomic nuclei stripped of electrons – Travel at relativistic speeds (up to 85% speed of light) – Contain very high energies (cannot shield) – Ionization is proportional to charge^2
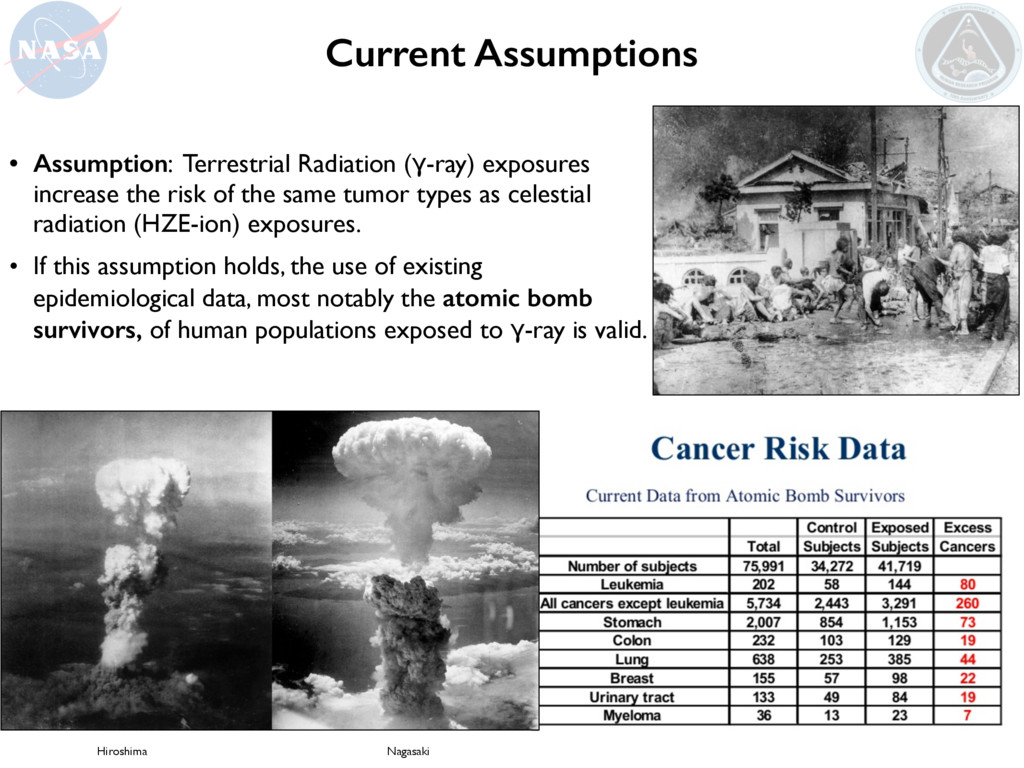
the same tumor types as celestial radiation (HZE-ion) exposures. • If this assumption holds, the use of existing epidemiological data, most notably the atomic bomb survivors, of human populations exposed to γ-ray is valid. Hiroshima Nagasaki Current Assumptions
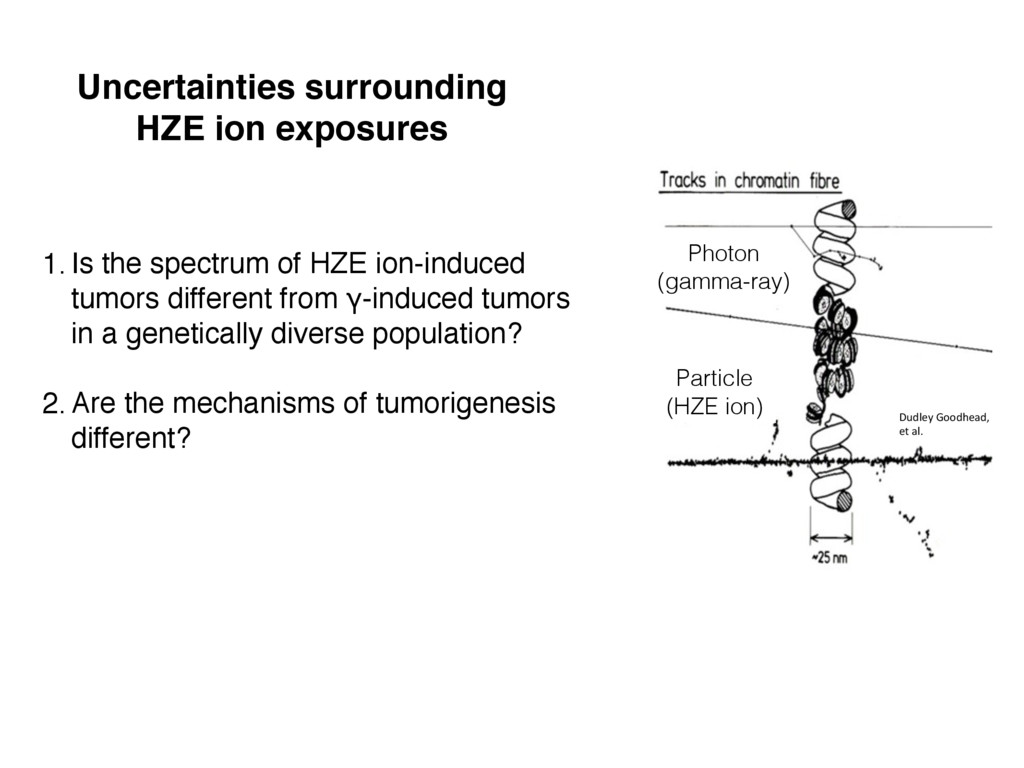
HZE ion-induced tumors different from γ-induced tumors in a genetically diverse population? 2. Are the mechanisms of tumorigenesis different? Dudley Goodhead, et al. Photon (gamma-ray) Particle (HZE ion)
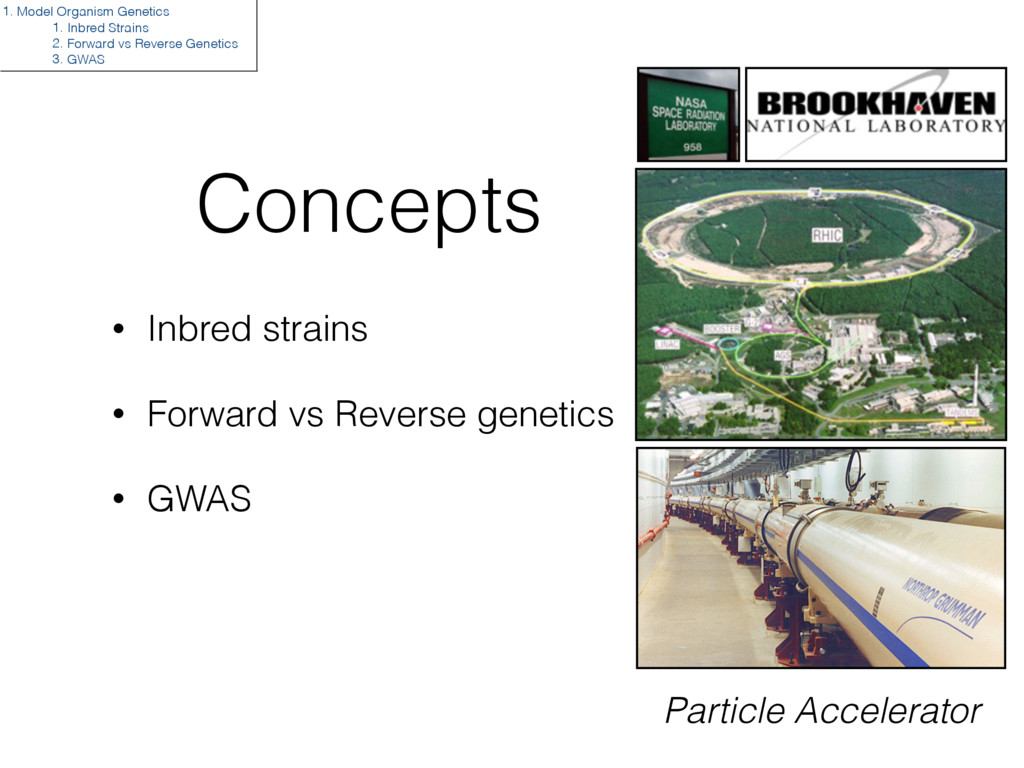
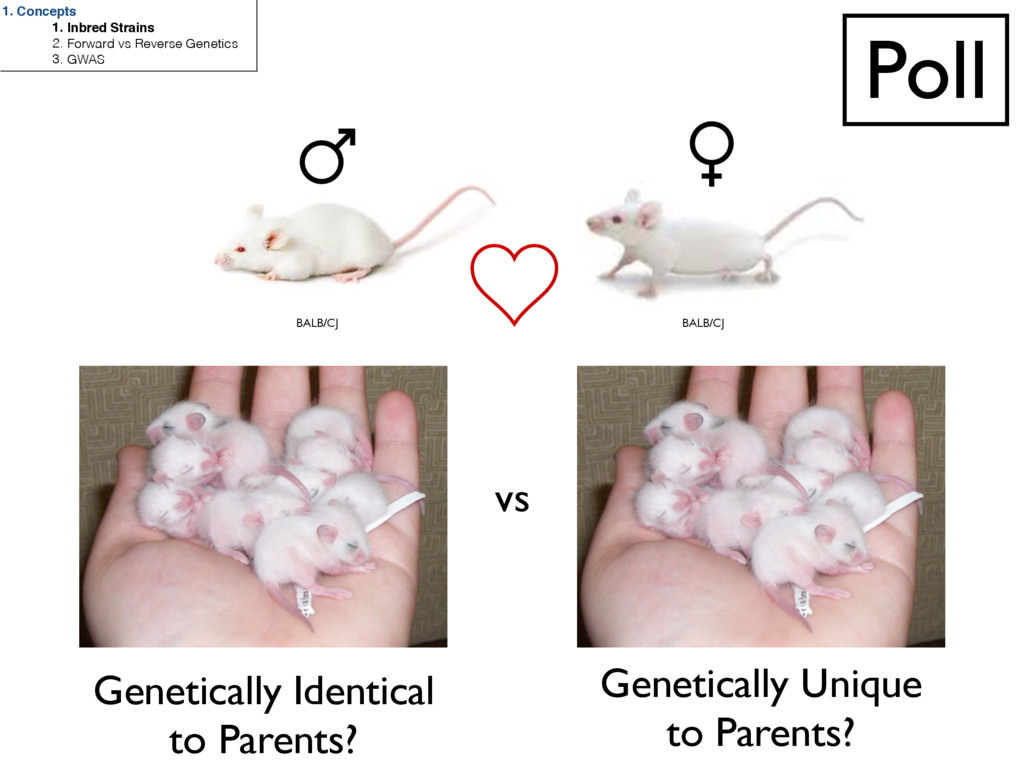
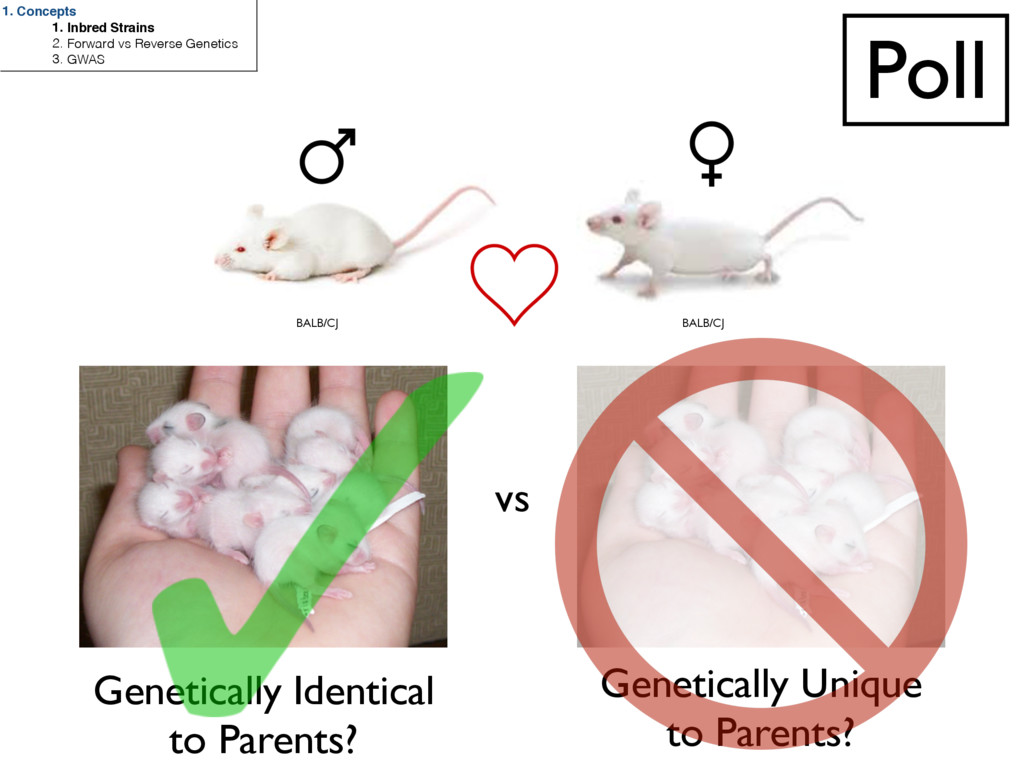
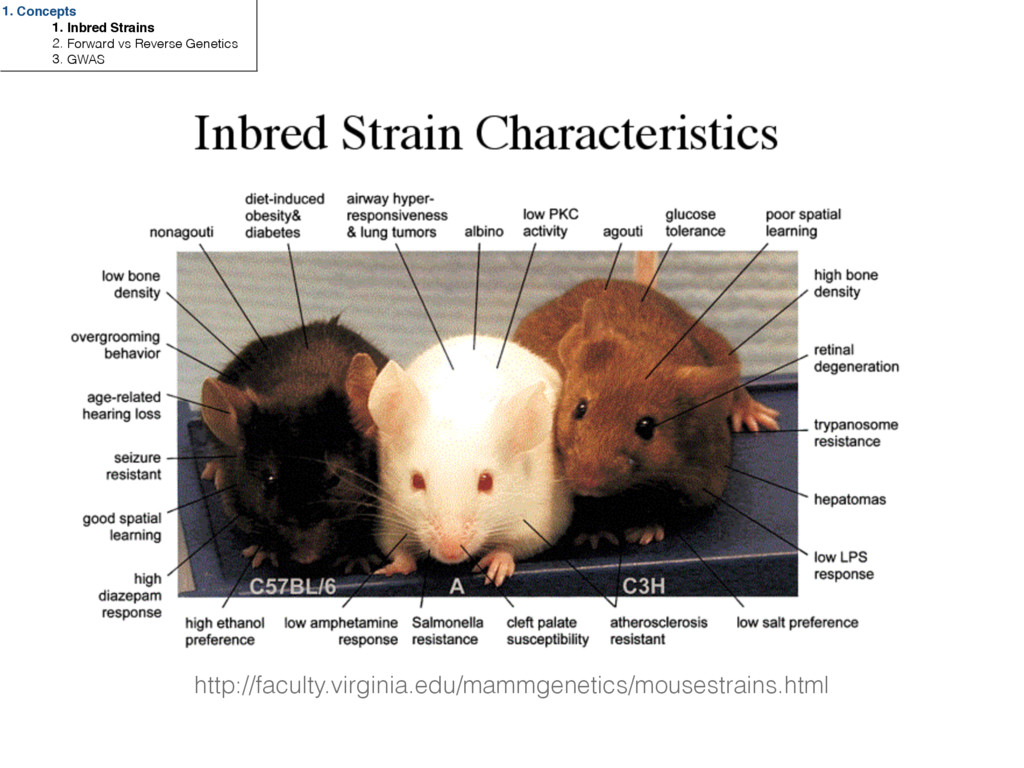
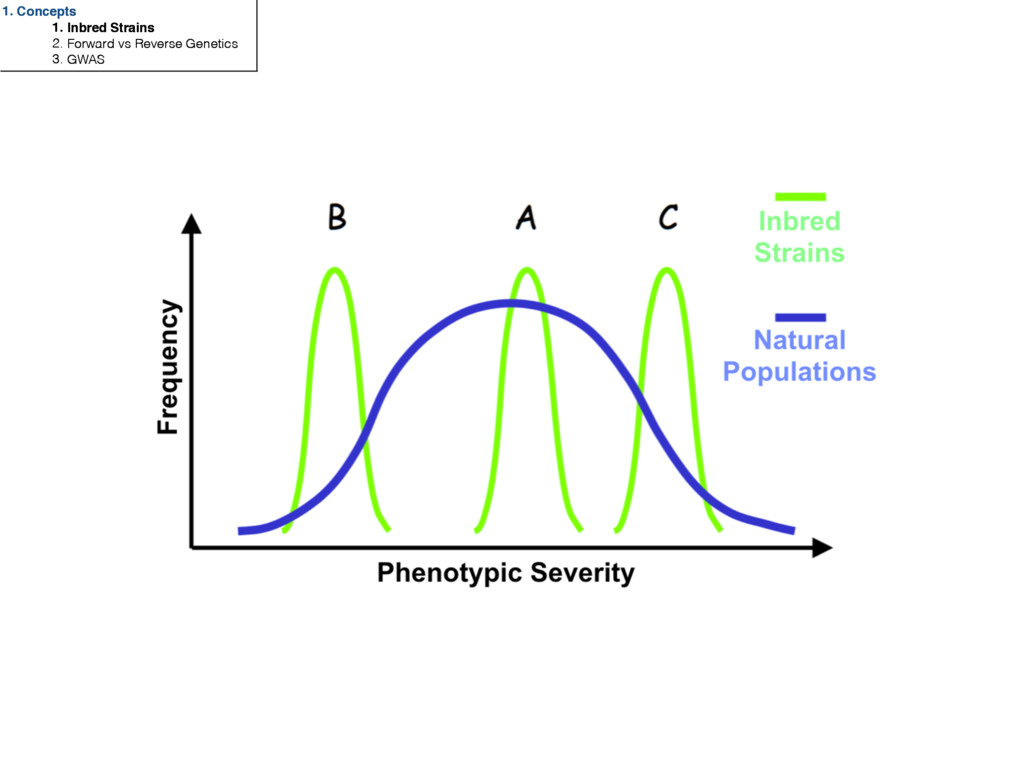
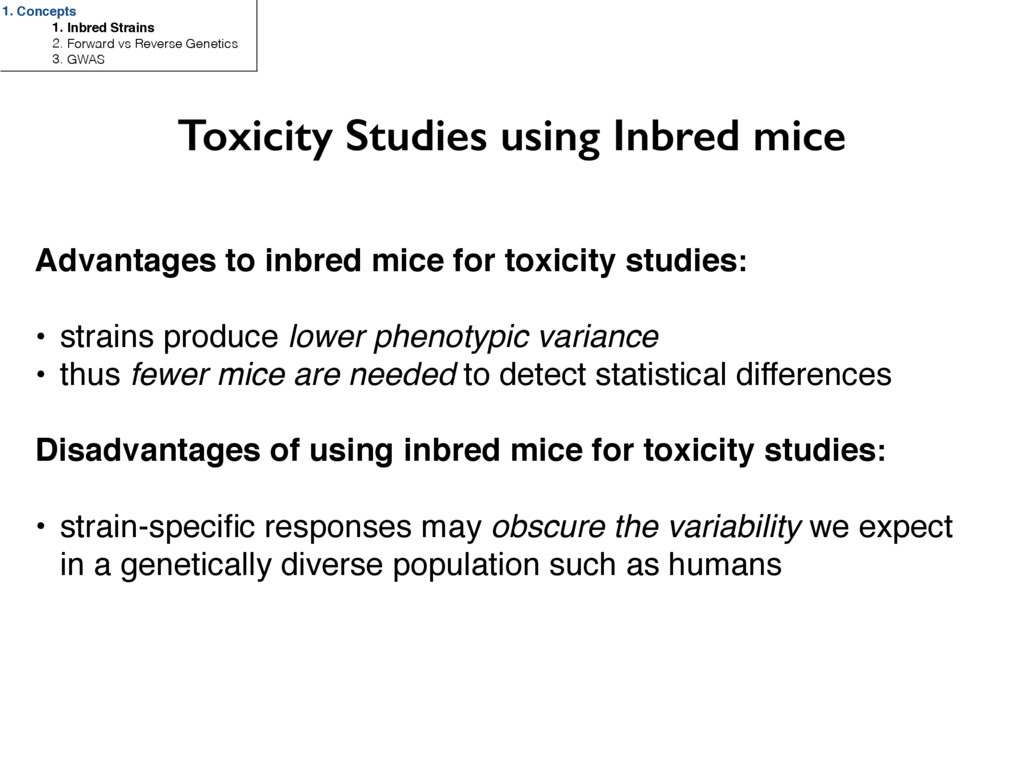
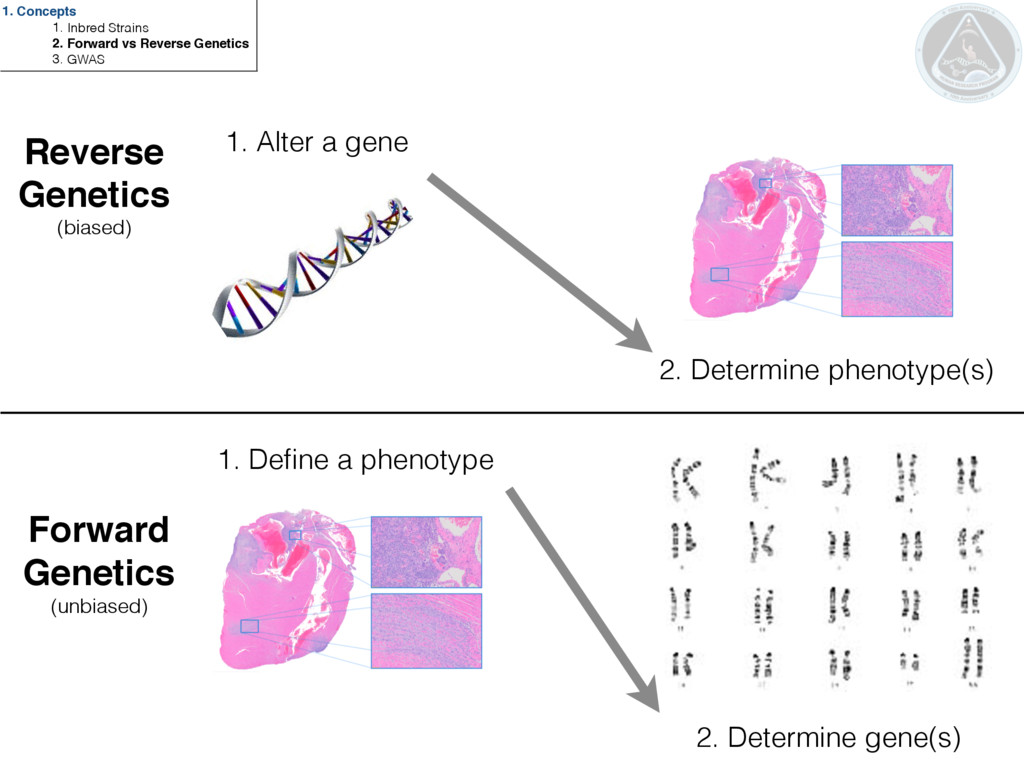
lower phenotypic variance • thus fewer mice are needed to detect statistical differences Disadvantages of using inbred mice for toxicity studies: • strain-specific responses may obscure the variability we expect in a genetically diverse population such as humans Toxicity Studies using Inbred mice 1. Concepts 1. Inbred Strains 2. Forward vs Reverse Genetics 3. GWAS
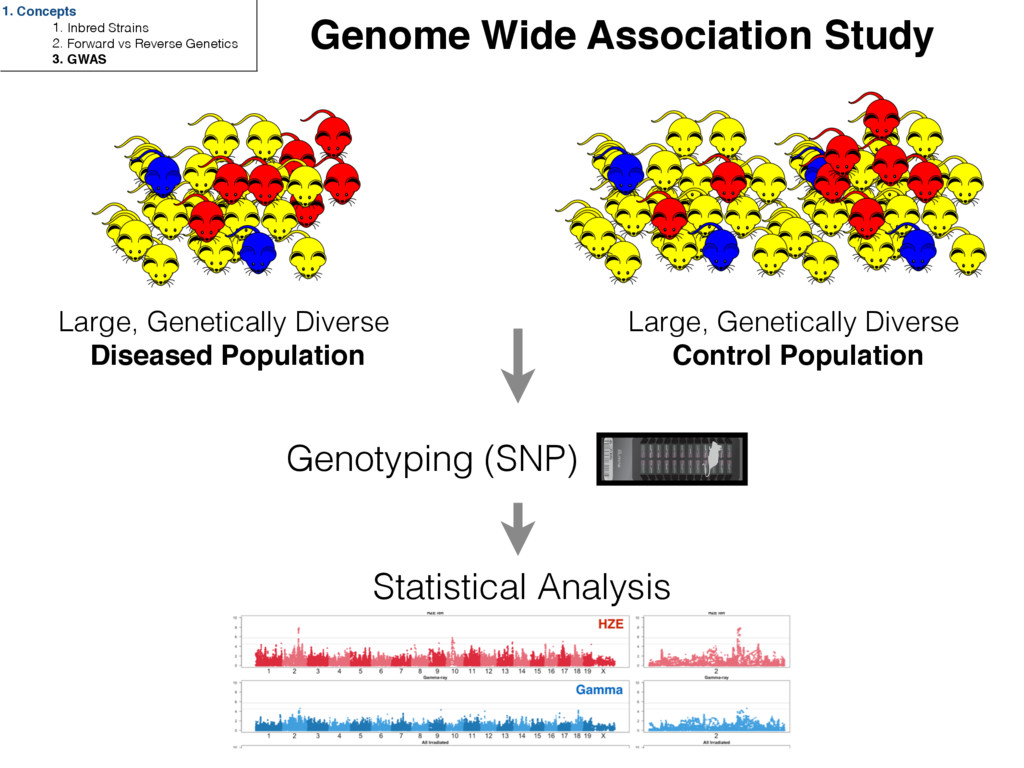
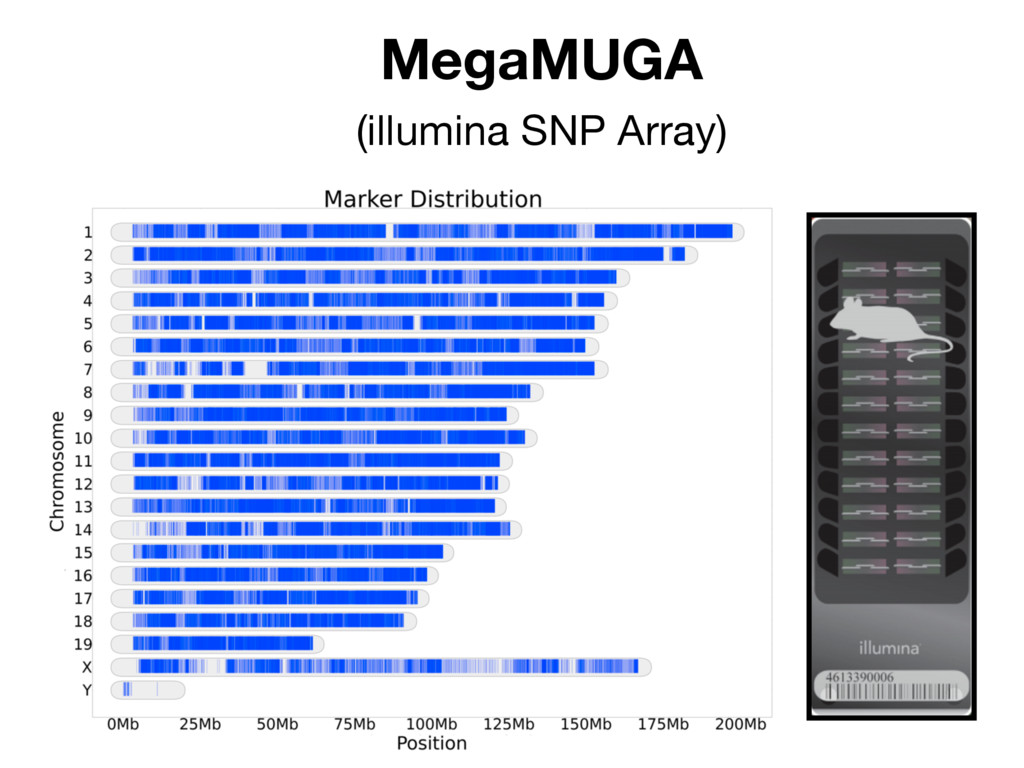
3. GWAS Genotyping (SNP) Large, Genetically Diverse Control Population Large, Genetically Diverse Diseased Population Statistical Analysis Genome Wide Association Study
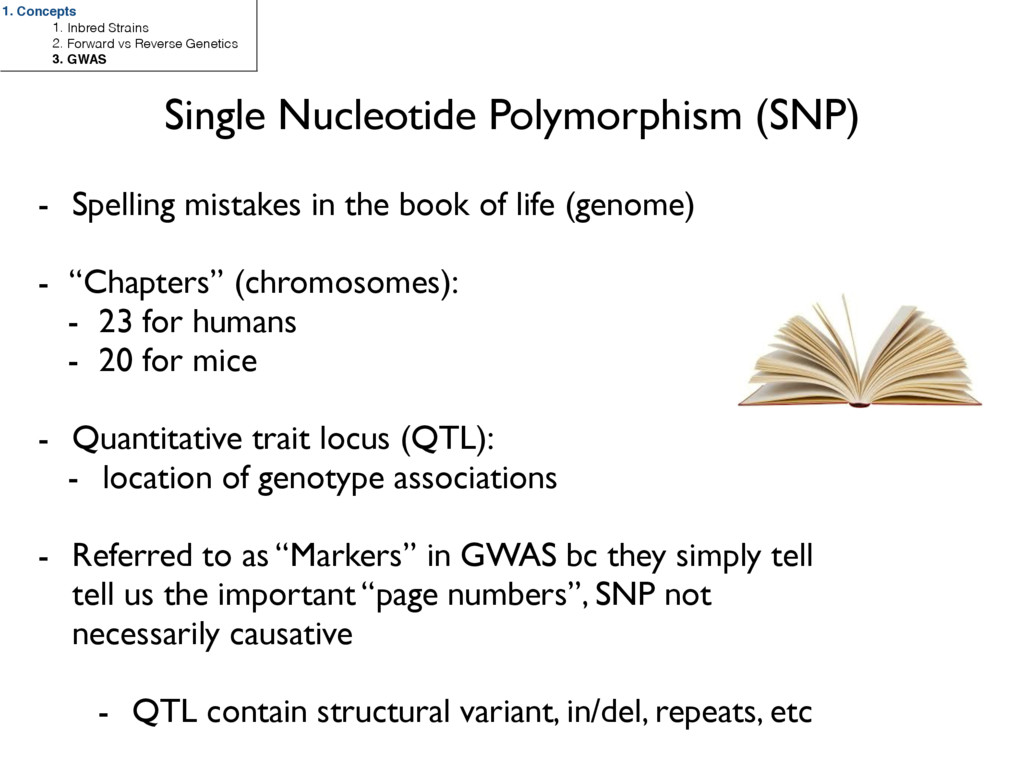
of life (genome) - “Chapters” (chromosomes): - 23 for humans - 20 for mice - Quantitative trait locus (QTL): - location of genotype associations - Referred to as “Markers” in GWAS bc they simply tell tell us the important “page numbers”, SNP not necessarily causative - QTL contain structural variant, in/del, repeats, etc 1. Concepts 1. Inbred Strains 2. Forward vs Reverse Genetics 3. GWAS
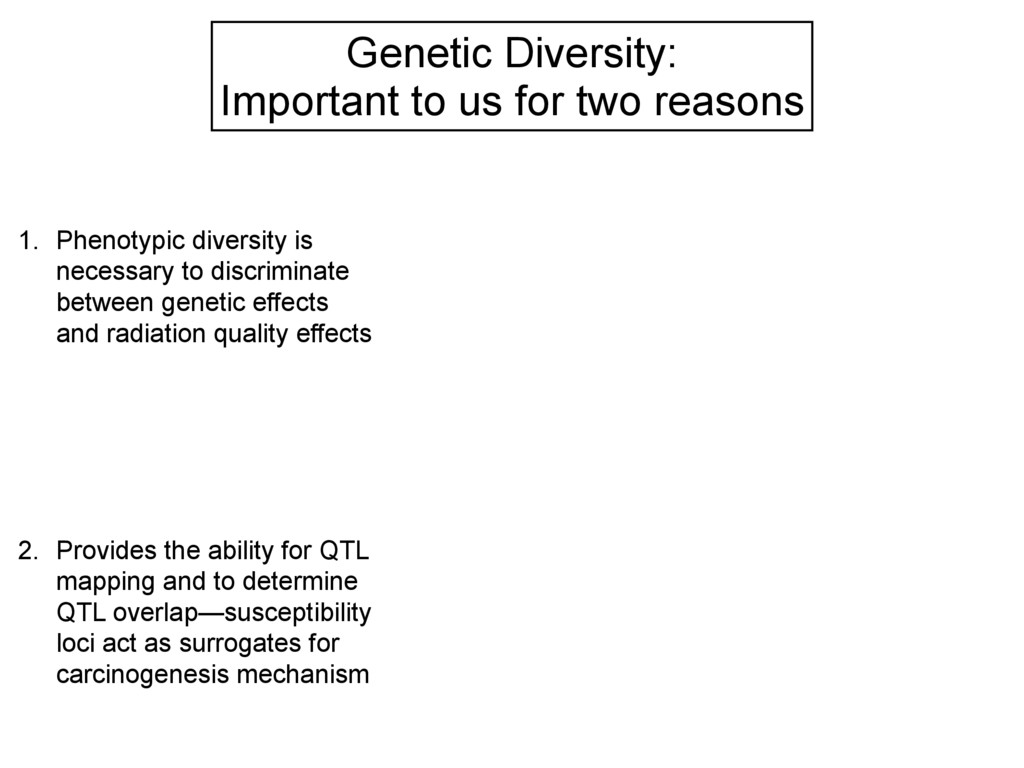
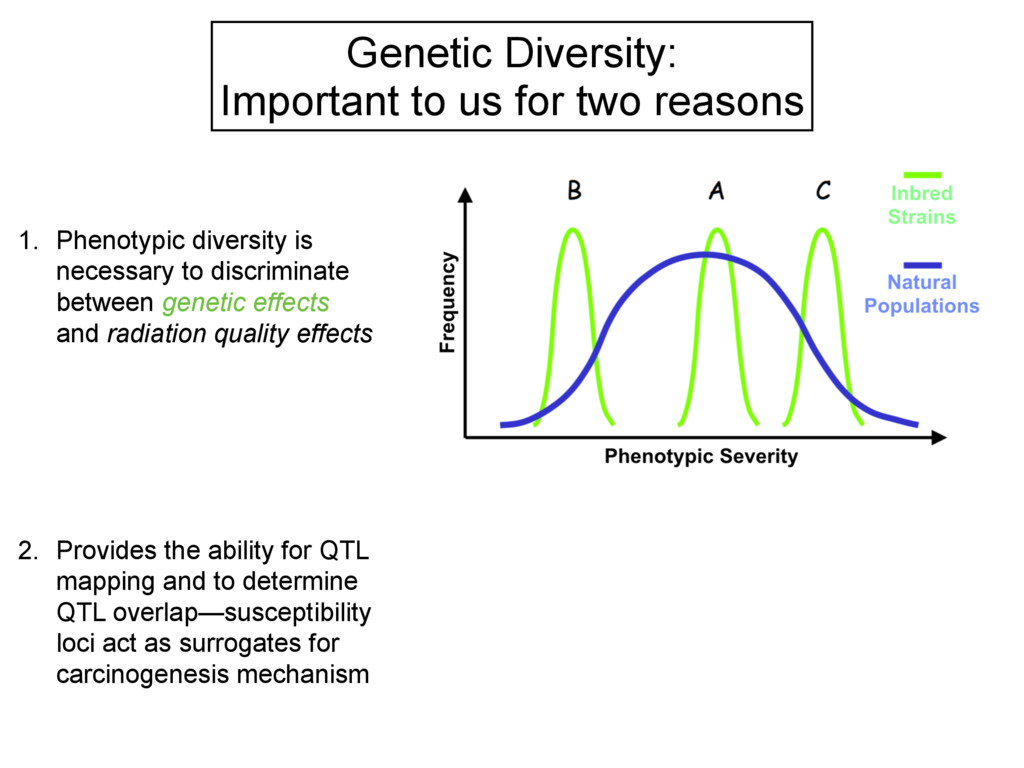
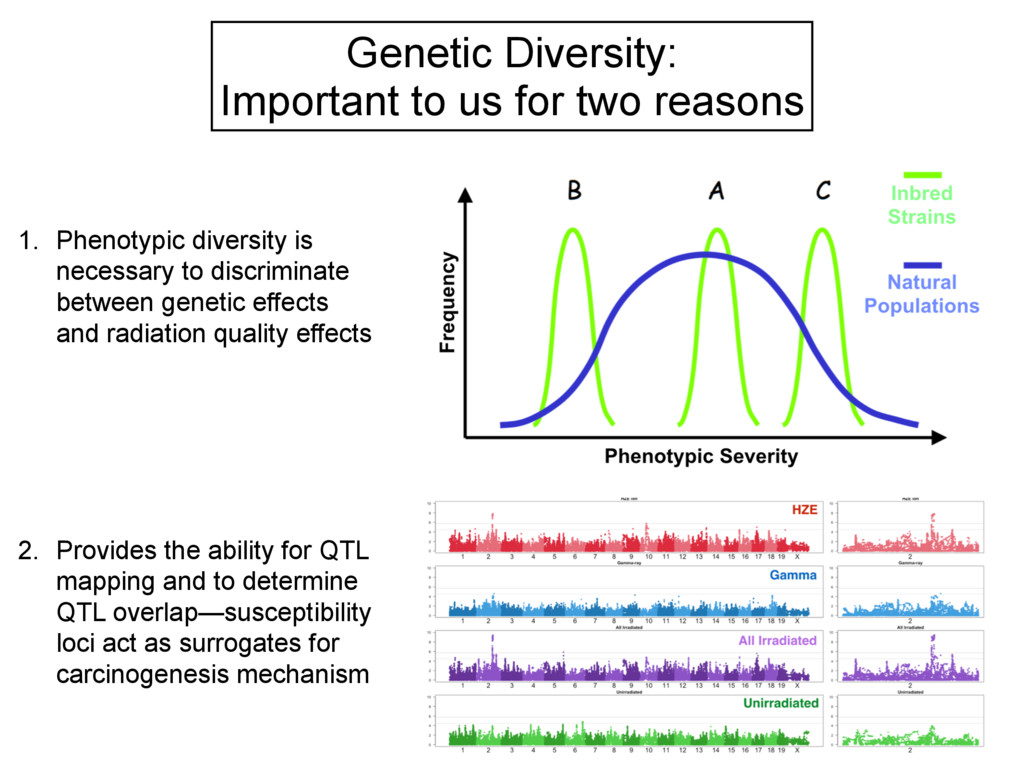
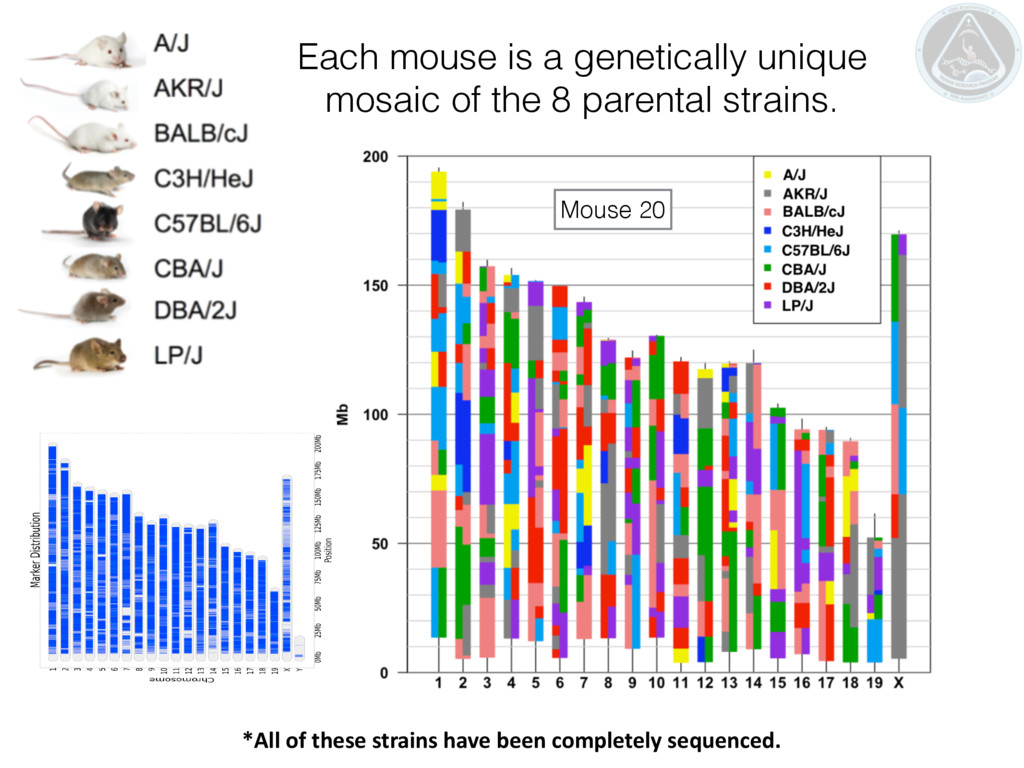
diversity is necessary to discriminate between genetic effects and radiation quality effects 2. Provides the ability for QTL mapping and to determine QTL overlap—susceptibility loci act as surrogates for carcinogenesis mechanism
diversity is necessary to discriminate between genetic effects and radiation quality effects 2. Provides the ability for QTL mapping and to determine QTL overlap—susceptibility loci act as surrogates for carcinogenesis mechanism
diversity is necessary to discriminate between genetic effects and radiation quality effects 2. Provides the ability for QTL mapping and to determine QTL overlap—susceptibility loci act as surrogates for carcinogenesis mechanism
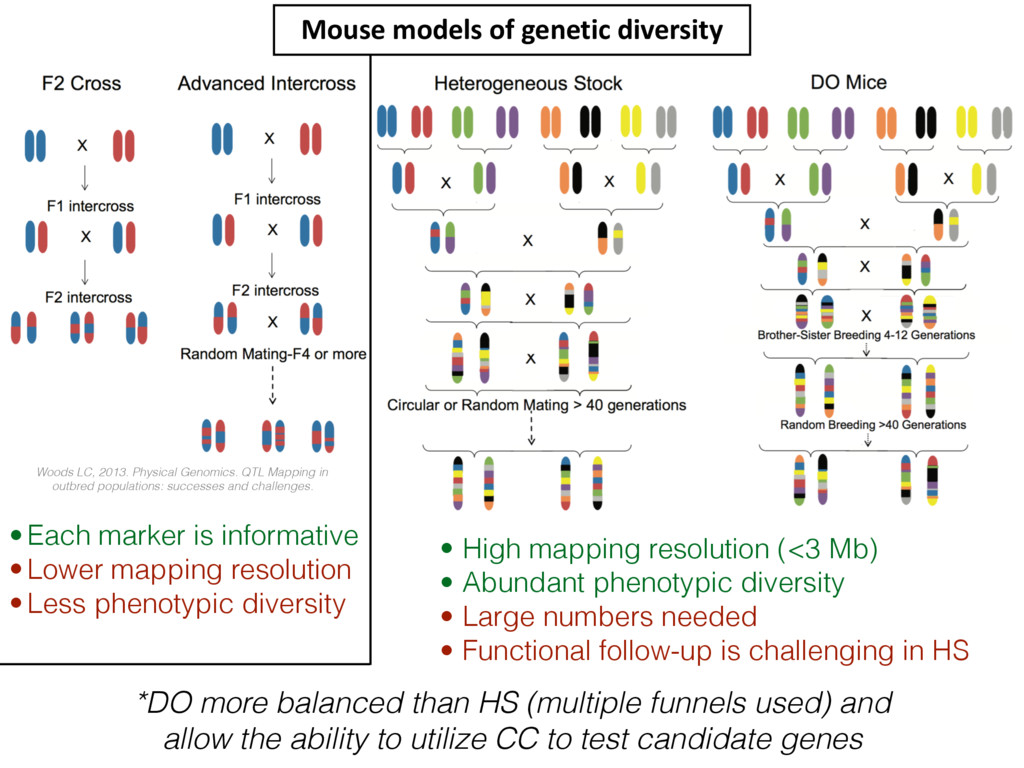
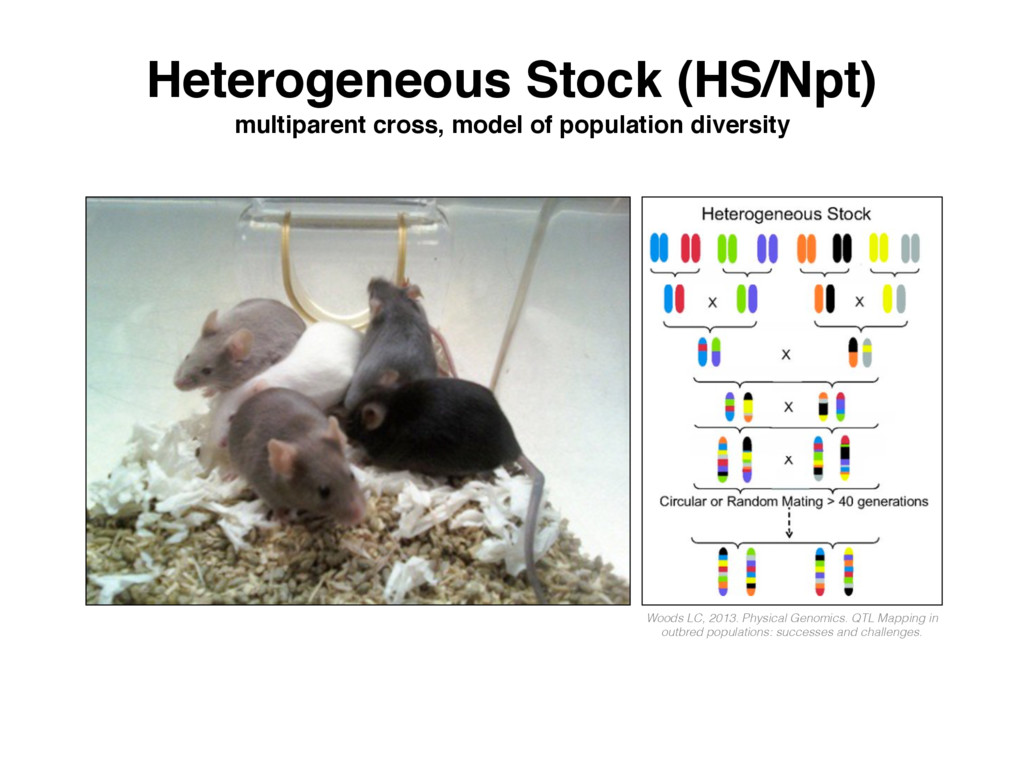
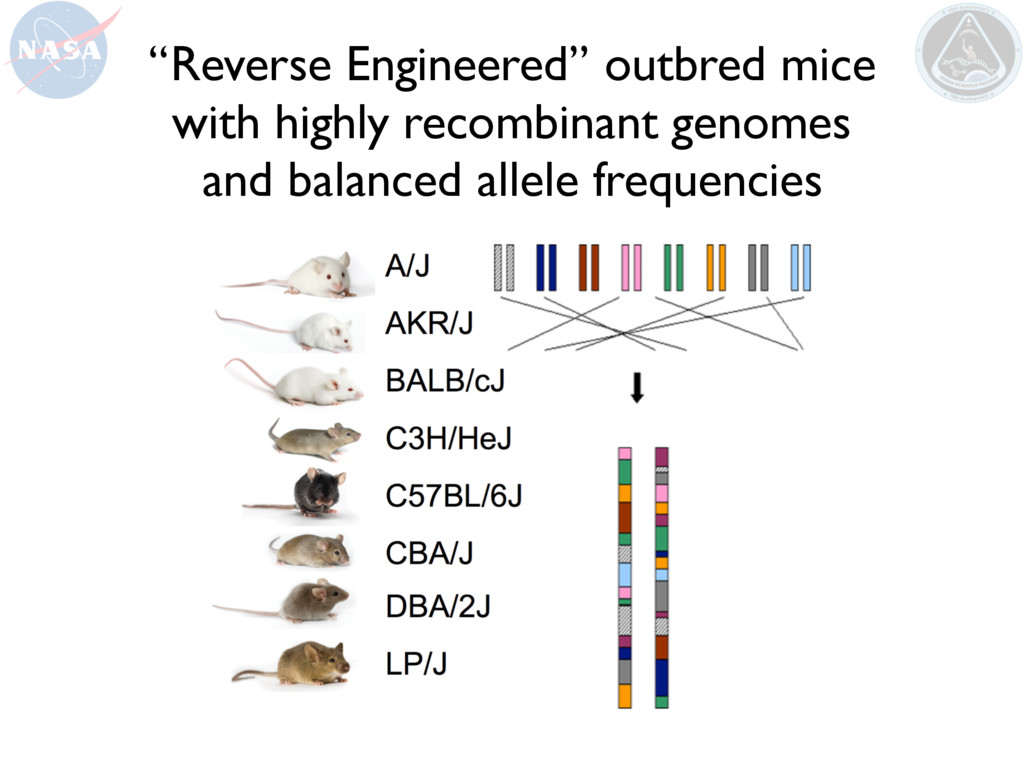
• High mapping resolution (<3 Mb) • Abundant phenotypic diversity • Large numbers needed • Functional follow-up is challenging in HS *DO more balanced than HS (multiple funnels used) and allow the ability to utilize CC to test candidate genes Mouse models of genetic diversity Woods LC, 2013. Physical Genomics. QTL Mapping in outbred populations: successes and challenges.
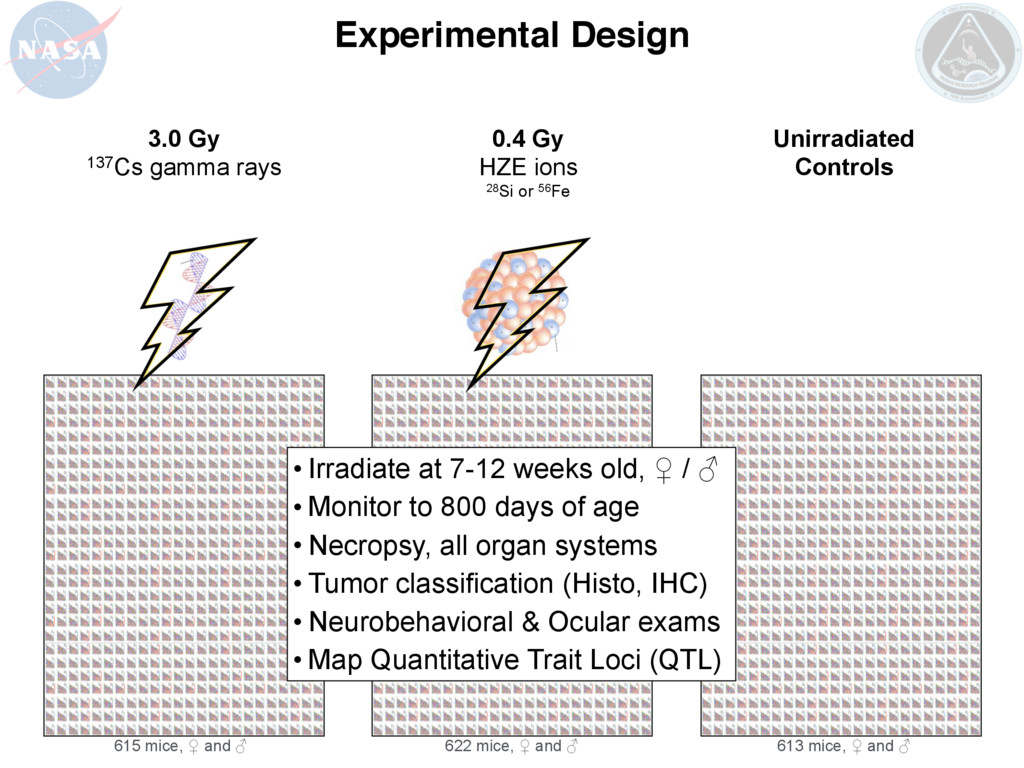
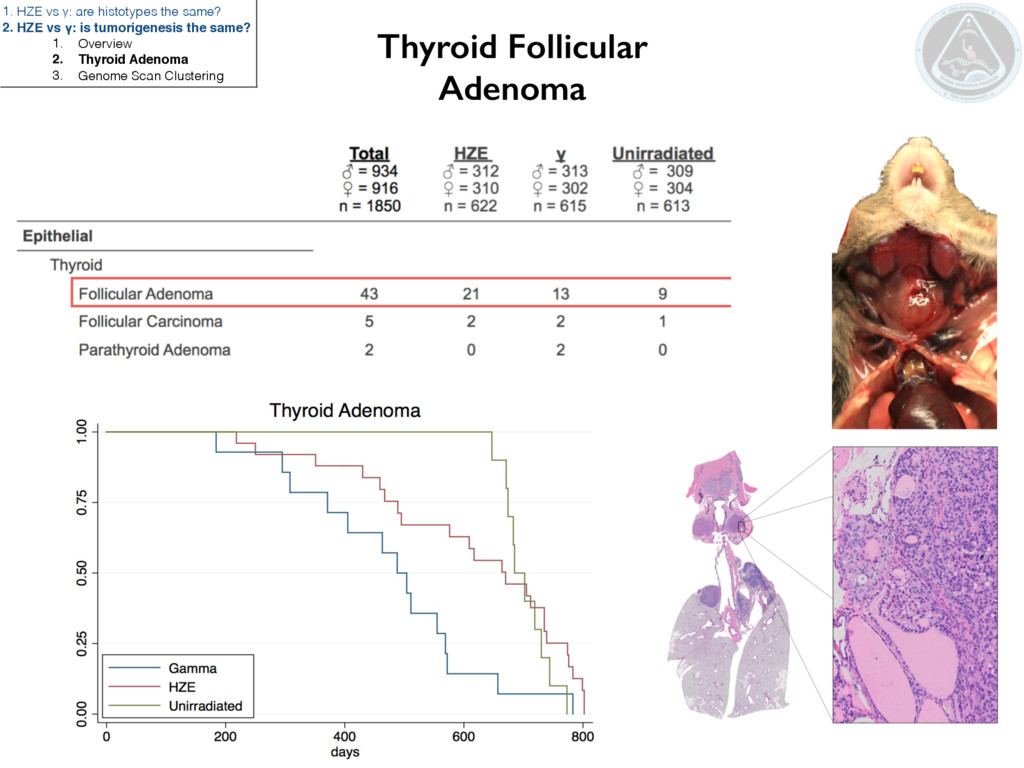
gamma rays Unirradiated Controls Experimental Design 613 mice, ♀ and ♂ 615 mice, ♀ and ♂ 622 mice, ♀ and ♂ • Irradiate at 7-12 weeks old, ♀ / ♂ • Monitor to 800 days of age • Necropsy, all organ systems • Tumor classification (Histo, IHC) • Neurobehavioral & Ocular exams • Map Quantitative Trait Loci (QTL)
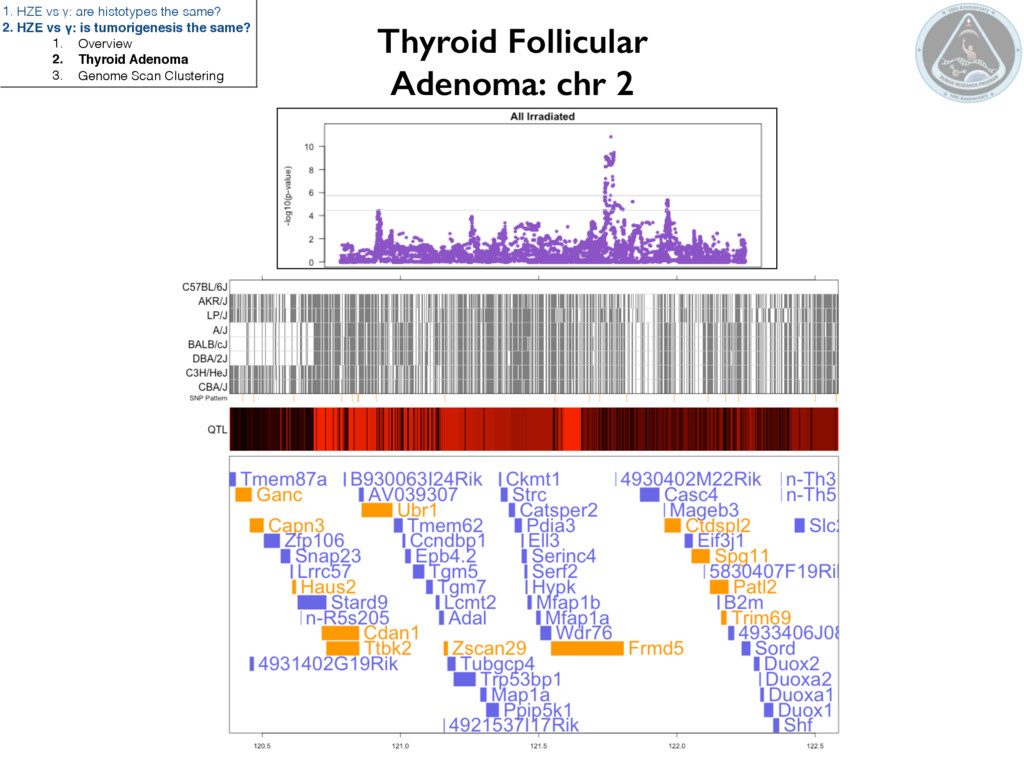
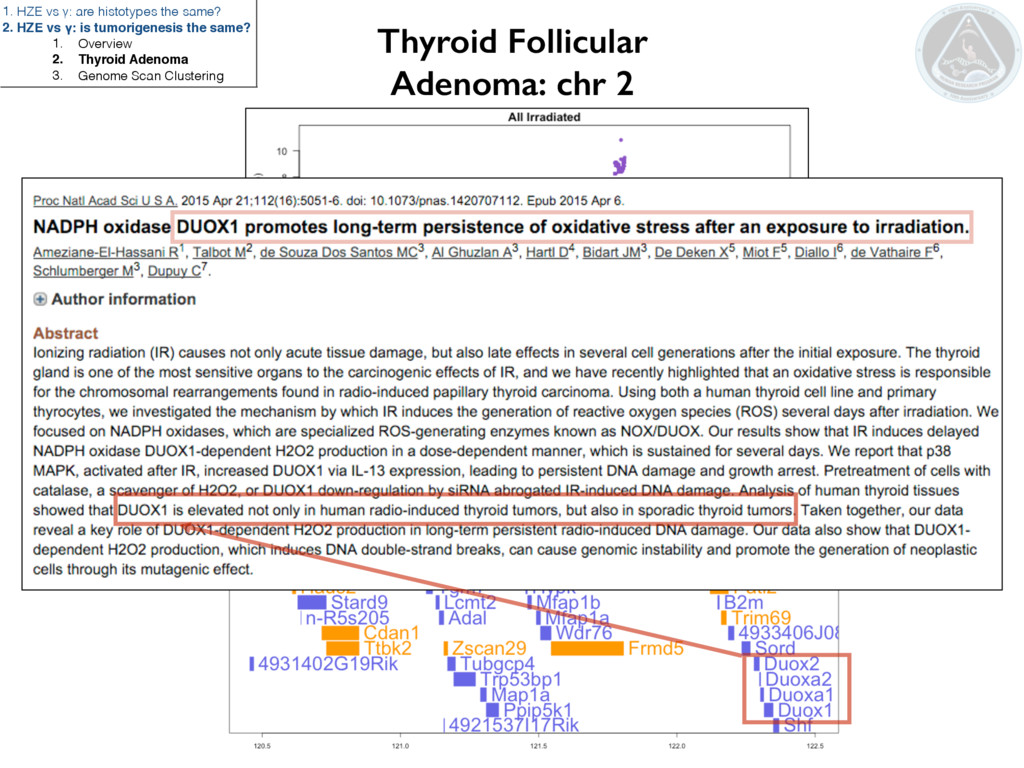
ion and γ-ray irradiation? 1. HZE vs γ: are histotypes the same? 2. HZE vs γ: is tumorigenesis the same? 1. Overview 2. Thyroid Adenoma 3. Genome Scan Clustering
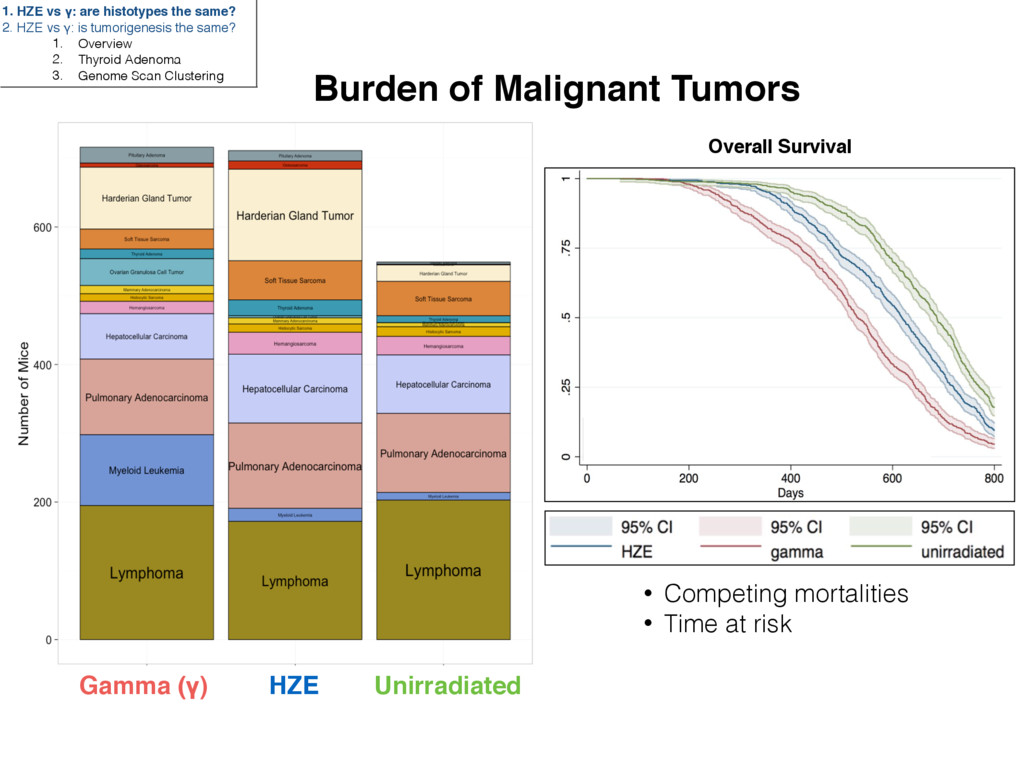
Time at risk HZE Gamma (γ) Unirradiated 1. HZE vs γ: are histotypes the same? 2. HZE vs γ: is tumorigenesis the same? 1. Overview 2. Thyroid Adenoma 3. Genome Scan Clustering
irradiation similar to the tumor susceptibility QTL following HZE ion irradiation? 1. HZE vs γ: are histotypes the same? 2. HZE vs γ: is tumorigenesis the same? 1. Overview 2. Thyroid Adenoma 3. Genome Scan Clustering
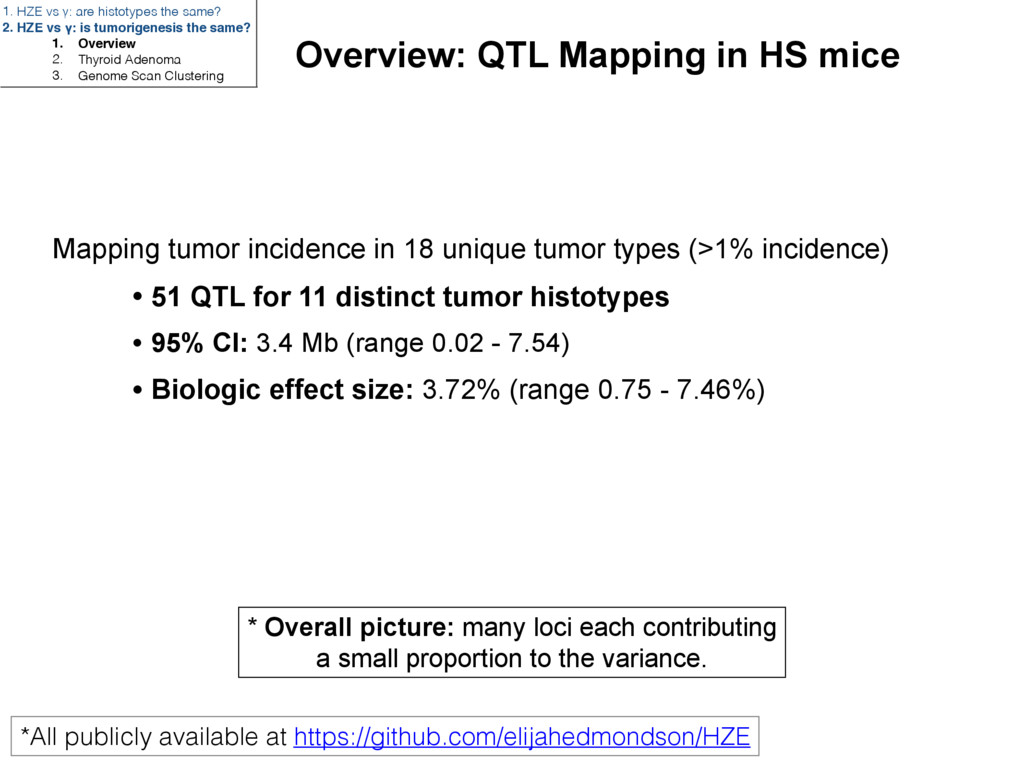
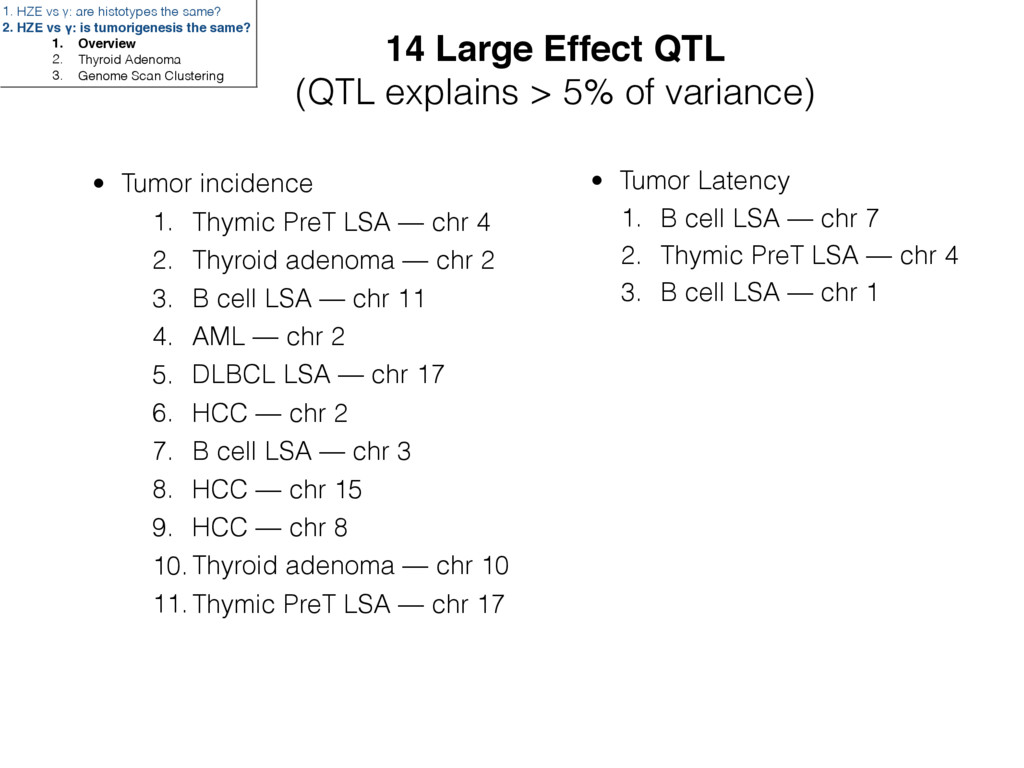
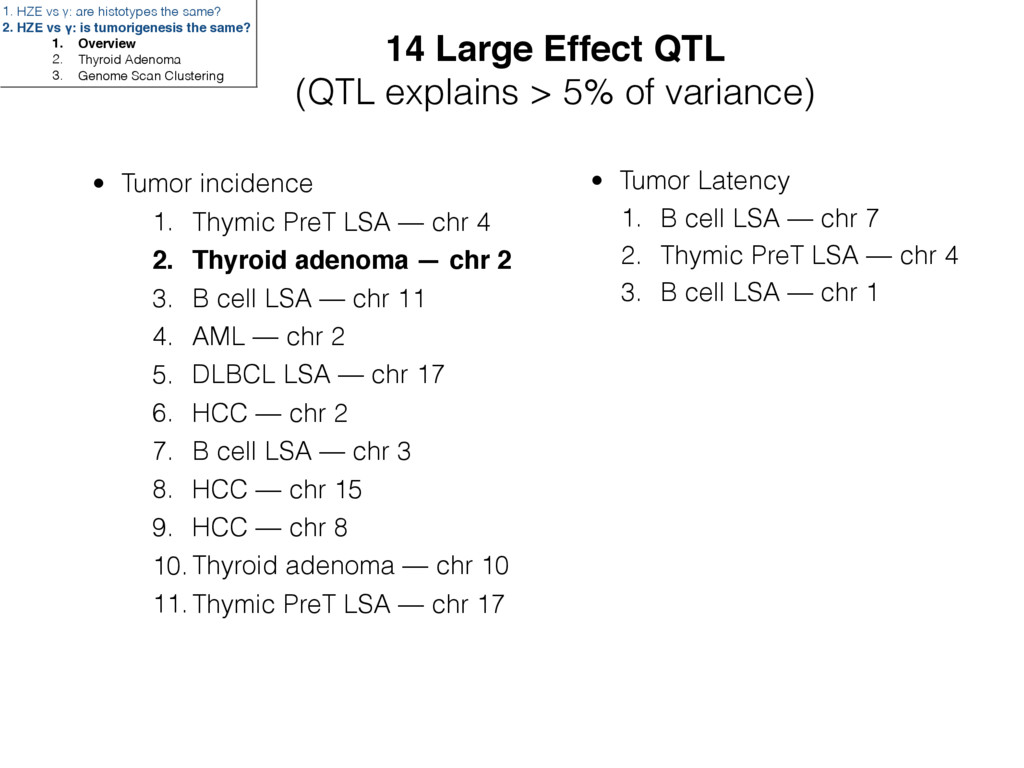
• 51 QTL for 11 distinct tumor histotypes • 95% CI: 3.4 Mb (range 0.02 - 7.54) • Biologic effect size: 3.72% (range 0.75 - 7.46%) *All publicly available at https://github.com/elijahedmondson/HZE * Overall picture: many loci each contributing a small proportion to the variance. Overview: QTL Mapping in HS mice 1. HZE vs γ: are histotypes the same? 2. HZE vs γ: is tumorigenesis the same? 1. Overview 2. Thyroid Adenoma 3. Genome Scan Clustering
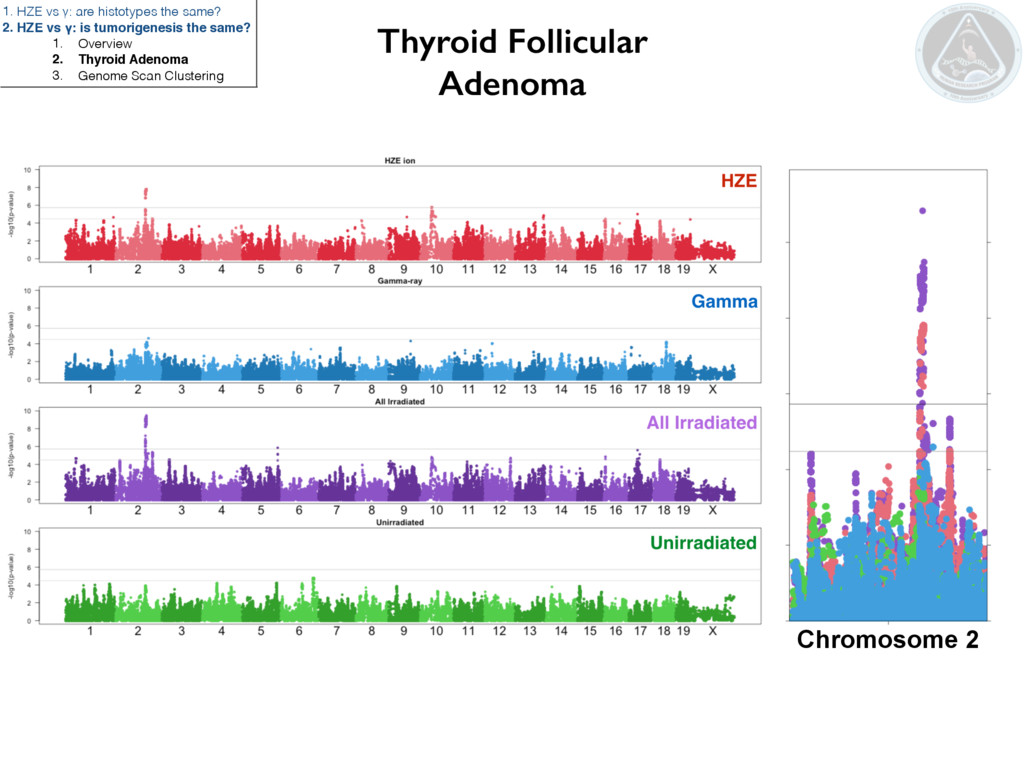
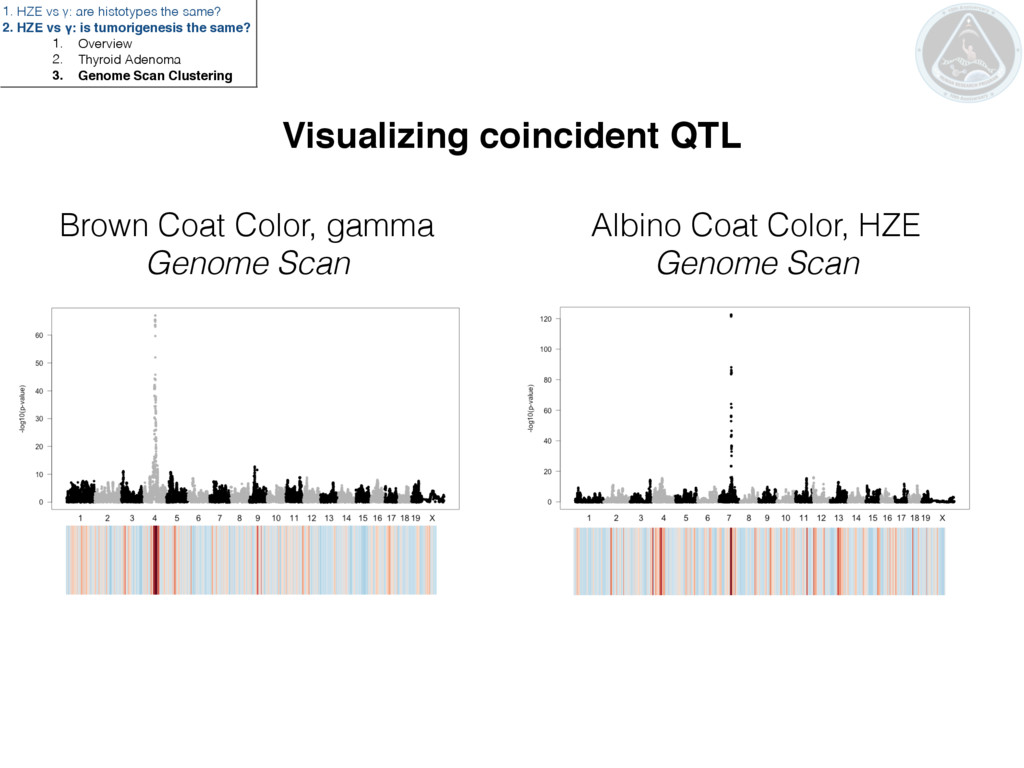
Genome Scan Visualizing coincident QTL 1. HZE vs γ: are histotypes the same? 2. HZE vs γ: is tumorigenesis the same? 1. Overview 2. Thyroid Adenoma 3. Genome Scan Clustering
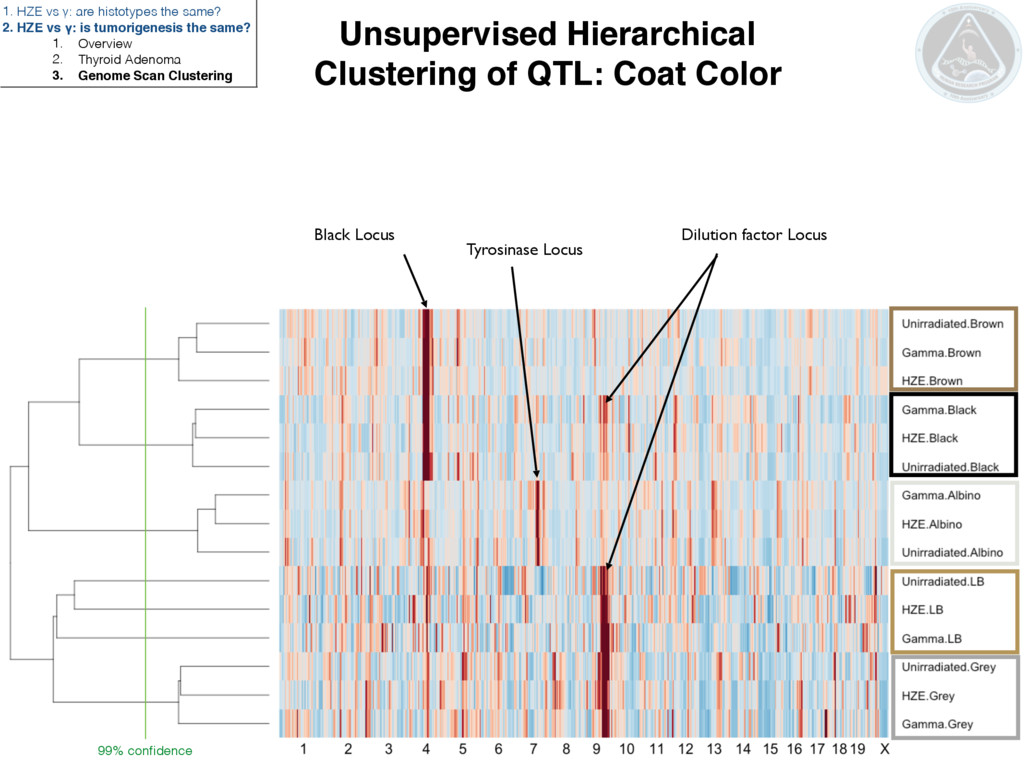
Locus Dilution factor Locus 99% confidence 1. HZE vs γ: are histotypes the same? 2. HZE vs γ: is tumorigenesis the same? 1. Overview 2. Thyroid Adenoma 3. Genome Scan Clustering
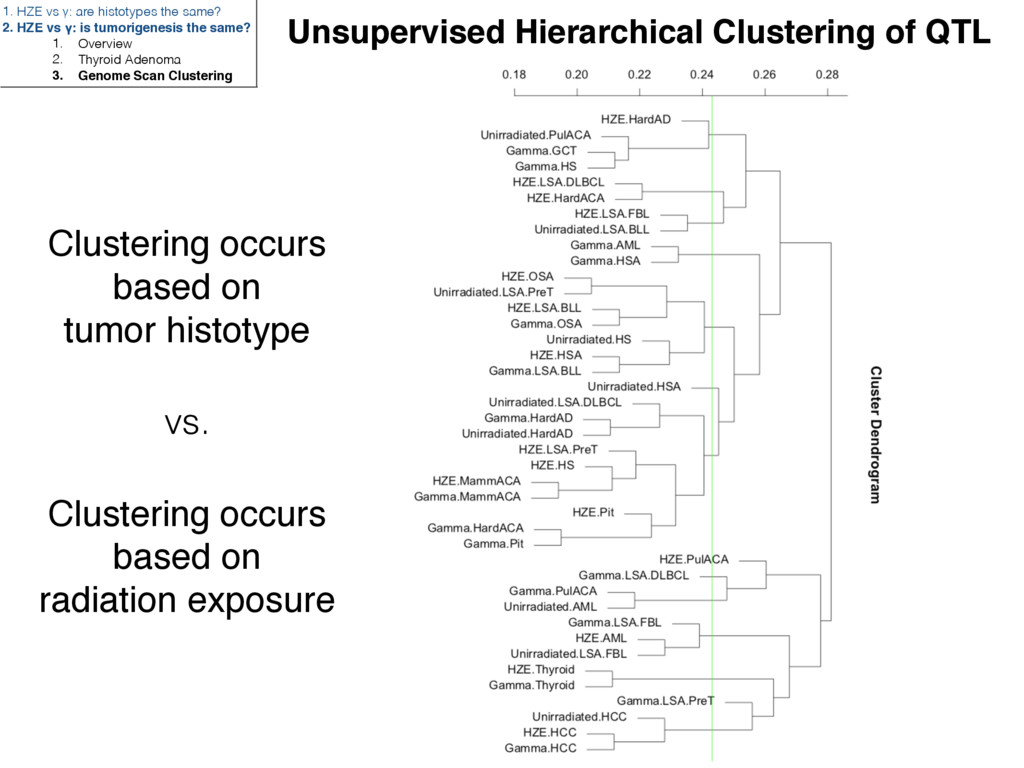
radiation exposure vs. Unsupervised Hierarchical Clustering of QTL 1. HZE vs γ: are histotypes the same? 2. HZE vs γ: is tumorigenesis the same? 1. Overview 2. Thyroid Adenoma 3. Genome Scan Clustering
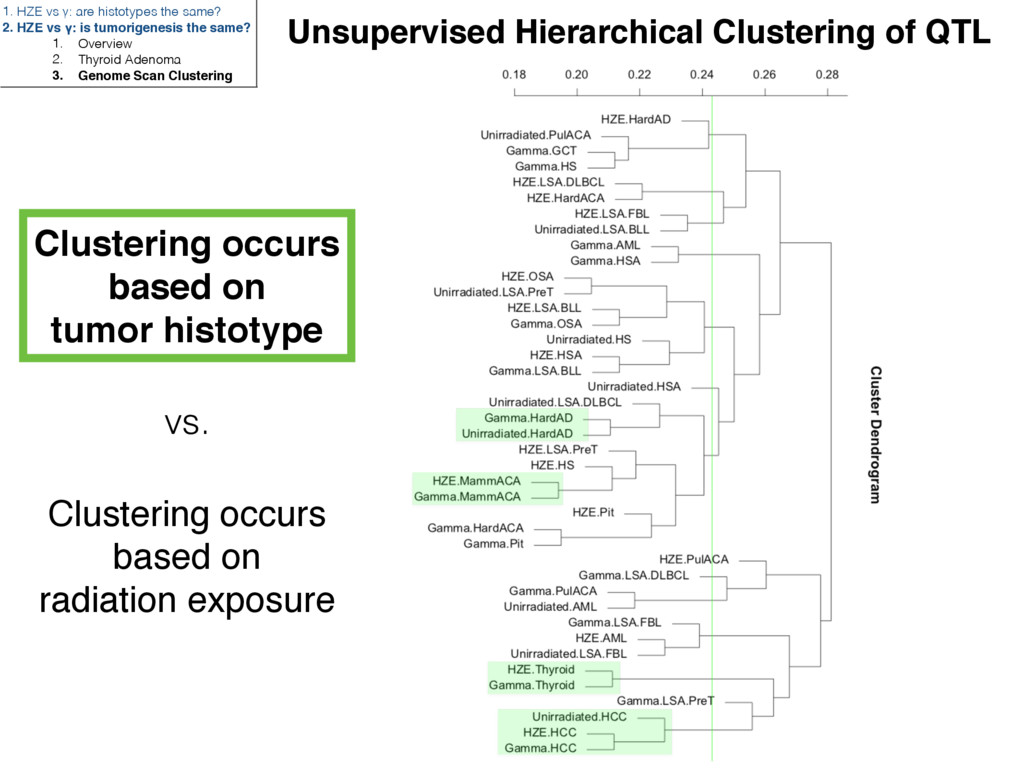
radiation exposure vs. Unsupervised Hierarchical Clustering of QTL 1. HZE vs γ: are histotypes the same? 2. HZE vs γ: is tumorigenesis the same? 1. Overview 2. Thyroid Adenoma 3. Genome Scan Clustering
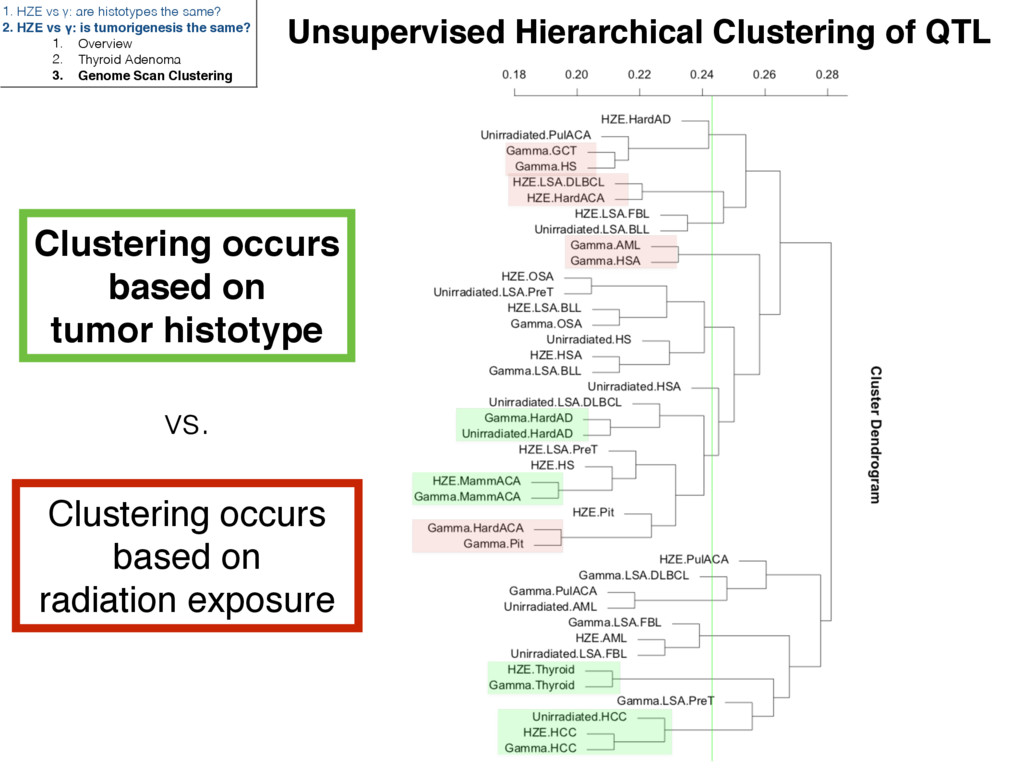
radiation exposure vs. Unsupervised Hierarchical Clustering of QTL 1. HZE vs γ: are histotypes the same? 2. HZE vs γ: is tumorigenesis the same? 1. Overview 2. Thyroid Adenoma 3. Genome Scan Clustering
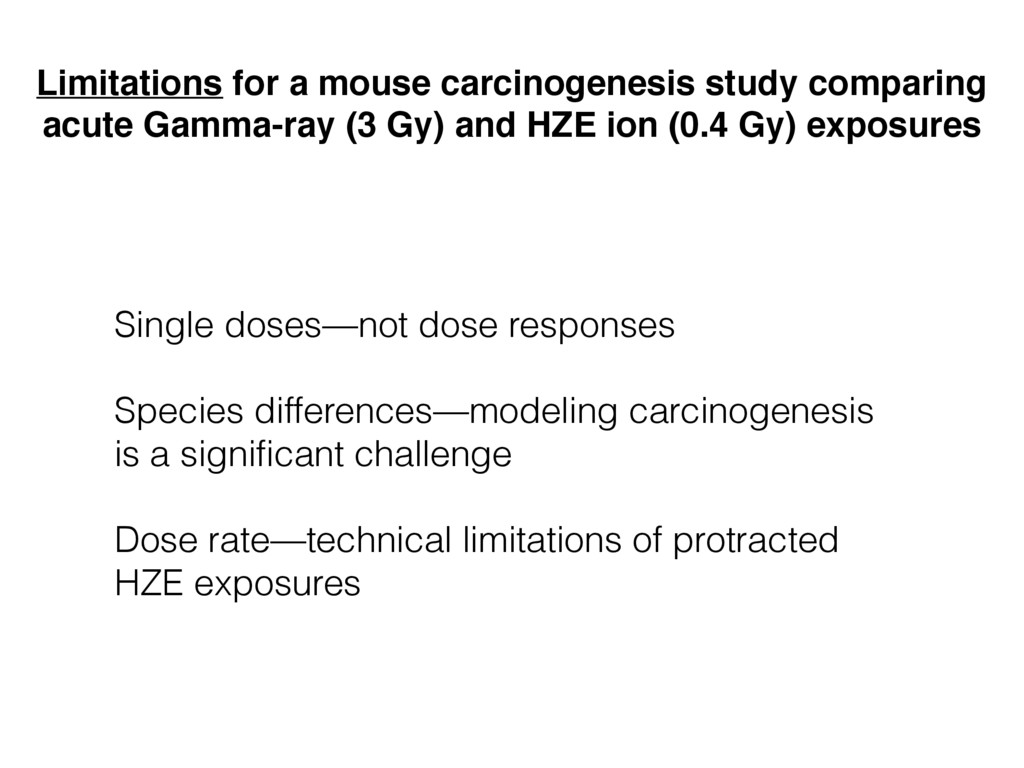
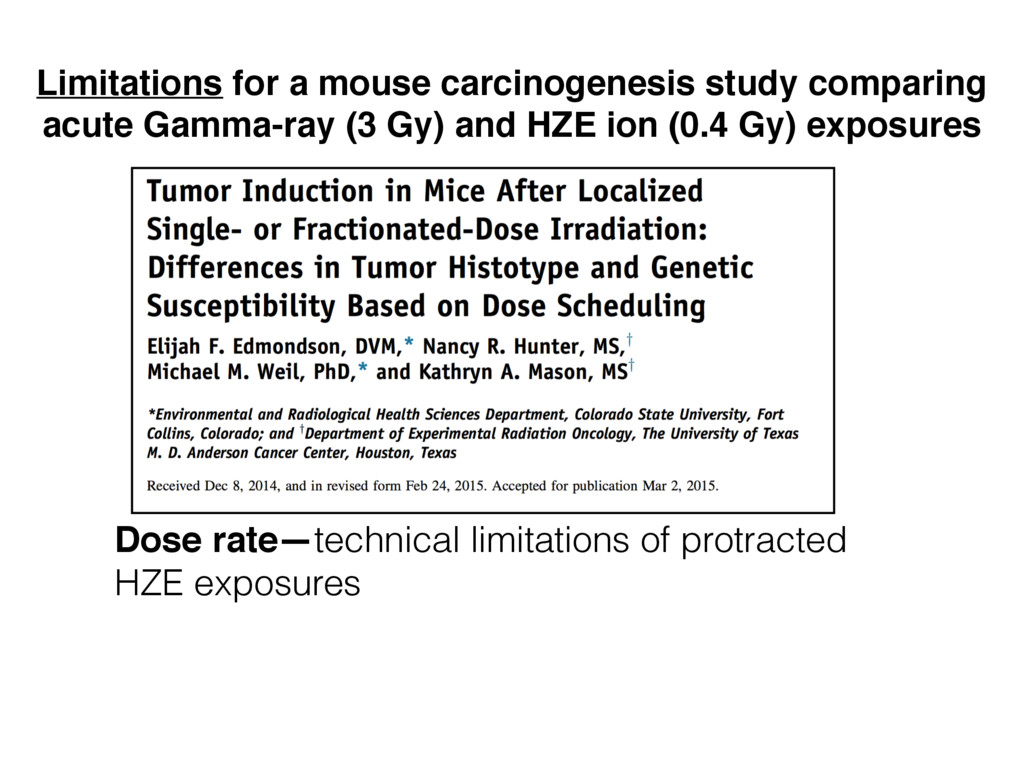
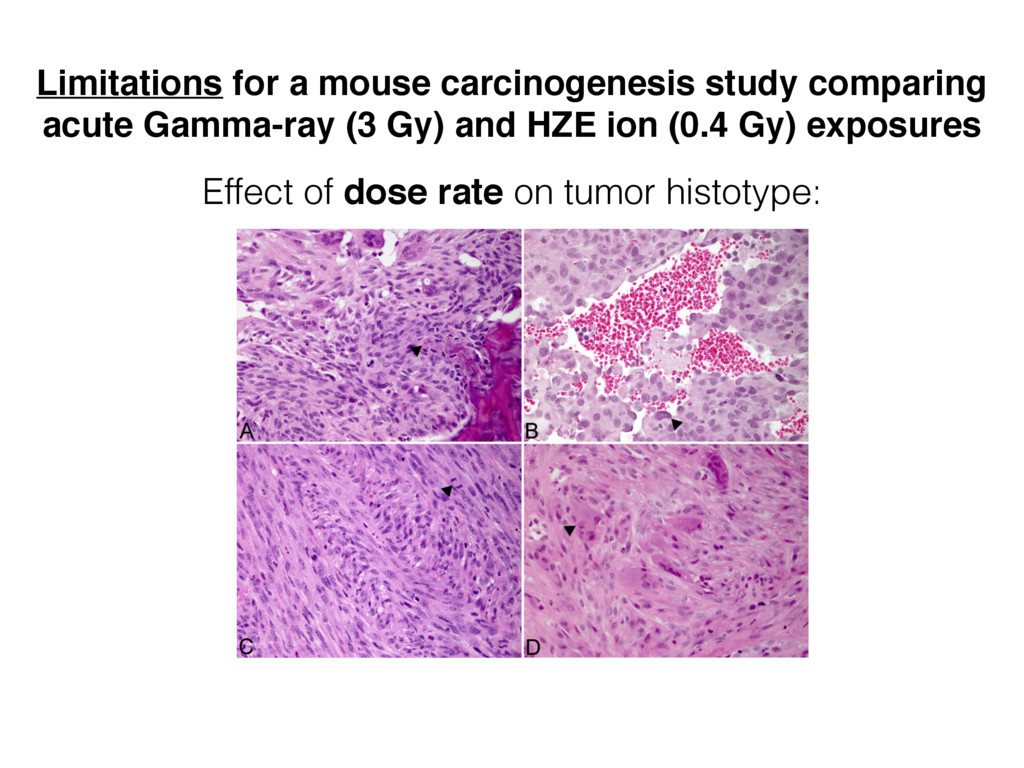
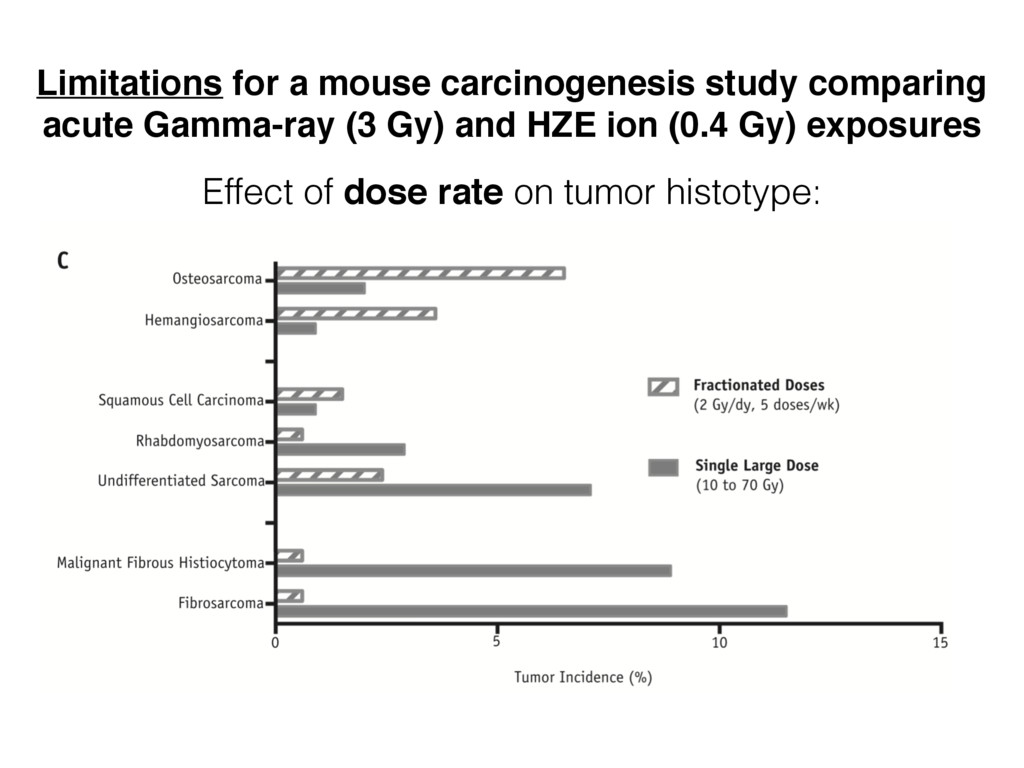
Gy) and HZE ion (0.4 Gy) exposures Single doses—not dose responses Species differences—modeling carcinogenesis is a significant challenge Dose rate—technical limitations of protracted HZE exposures
challenge Dose rate—technical limitations of protracted HZE exposures Limitations for a mouse carcinogenesis study comparing acute Gamma-ray (3 Gy) and HZE ion (0.4 Gy) exposures
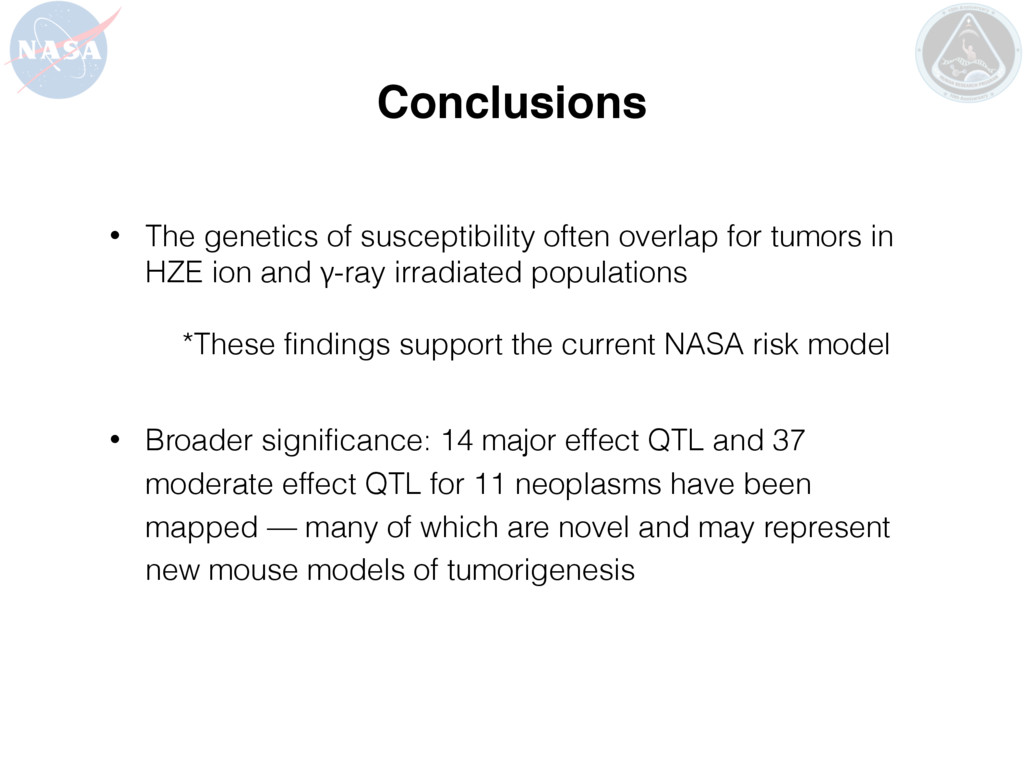
in HZE ion and γ-ray irradiated populations *These findings support the current NASA risk model • Broader significance: 14 major effect QTL and 37 moderate effect QTL for 11 neoplasms have been mapped — many of which are novel and may represent new mouse models of tumorigenesis
10437-15 NIH/ Jackson Labs R01GM070683 Acknowledgements CONTACT: Elijah Edmondson, DVM DACVP [email protected] Committee Michael M. Weil Sue VandeWoude Doug Thamm Deborah Kamstock Christin Olver Colorado State University Weil Lab Chrissy Fallgren Elvin Garcia Paula Genik Todd Bass Debra Kamstock Jackson Labs Churchill Lab Daniel M. Gatti Oregon Health Science University John Belknap Columbia Norman Kleiman Eric Hall M.D. Anderson Cancer Center Kathy Mason Nancy Hunter
10437-15 NIH/ Jackson Labs R01GM070683 Acknowledgements CONTACT: Elijah Edmondson, DVM DACVP [email protected] Committee Michael M. Weil Sue VandeWoude Doug Thamm Deborah Kamstock Christin Olver Colorado State University Weil Lab Chrissy Fallgren Elvin Garcia Paula Genik Todd Bass Debra Kamstock Jackson Labs Churchill Lab Daniel M. Gatti Oregon Health Science University John Belknap Columbia Norman Kleiman Eric Hall M.D. Anderson Cancer Center Kathy Mason Nancy Hunter CODE: github.com/ elijahedmondson/ SLIDES: speakerdeck.com/ elijahedmondson/
10437-15 NIH/ Jackson Labs R01GM070683 Acknowledgements CONTACT: Elijah Edmondson, DVM DACVP [email protected] Committee Michael M. Weil Sue VandeWoude Doug Thamm Deborah Kamstock Christin Olver Colorado State University Weil Lab Chrissy Fallgren Elvin Garcia Paula Genik Todd Bass Debra Kamstock Jackson Labs Churchill Lab Daniel M. Gatti Oregon Health Science University John Belknap Columbia Norman Kleiman Eric Hall M.D. Anderson Cancer Center Kathy Mason Nancy Hunter CODE: github.com/ elijahedmondson/ SLIDES: speakerdeck.com/ elijahedmondson/
![Elijah Edmondson, DVM DACVP [email protected] Weil Lab, CSU Genomic mapping](https://files.speakerdeck.com/presentations/554198d5e25e4f7b9b3dd2e716cf1a45/slide_0.jpg)