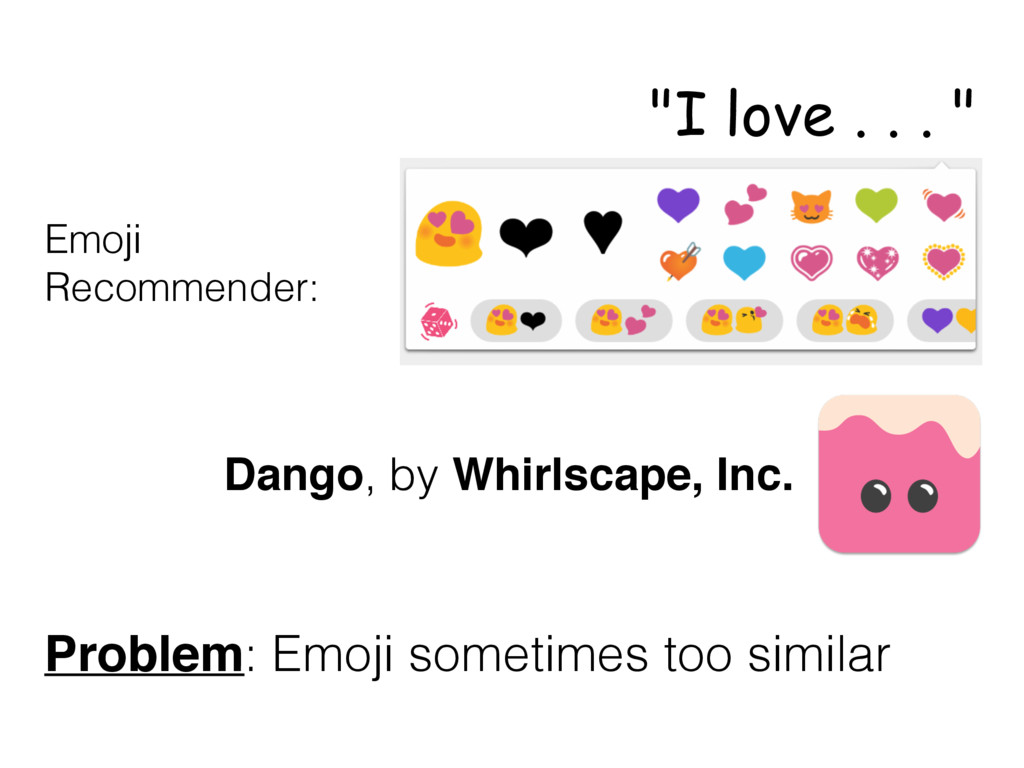
As an Insight Data Science Fellow, I recently worked with Whirlscape, Inc. to increase the diversity of results displayed by their emoji recommender app, Dango (https://play.google.com/store/apps/details?id=co.dango.emoji.gif&hl=en).
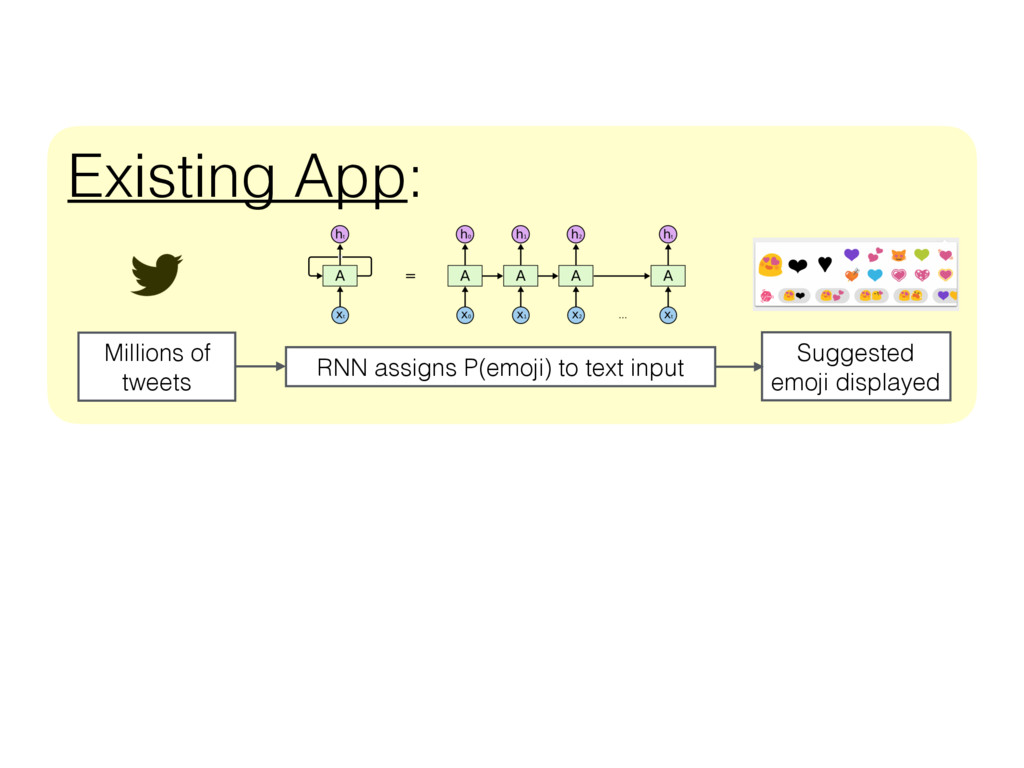
Dango suggests emoji in real-time based on what a user is writing. The recommender is informed by a recurrent neural network that has been trained with millions of tweets containing text and emoji (check out http://karpathy.github.io/2015/05/21/rnn-effectiveness/ for a brief introduction to RNNs). When given a new text input, the trained model uses a softmax classifier to assign a probability to each emoji based on the text , and only the most probable (highest ranked) emoji are displayed to the user by the app.
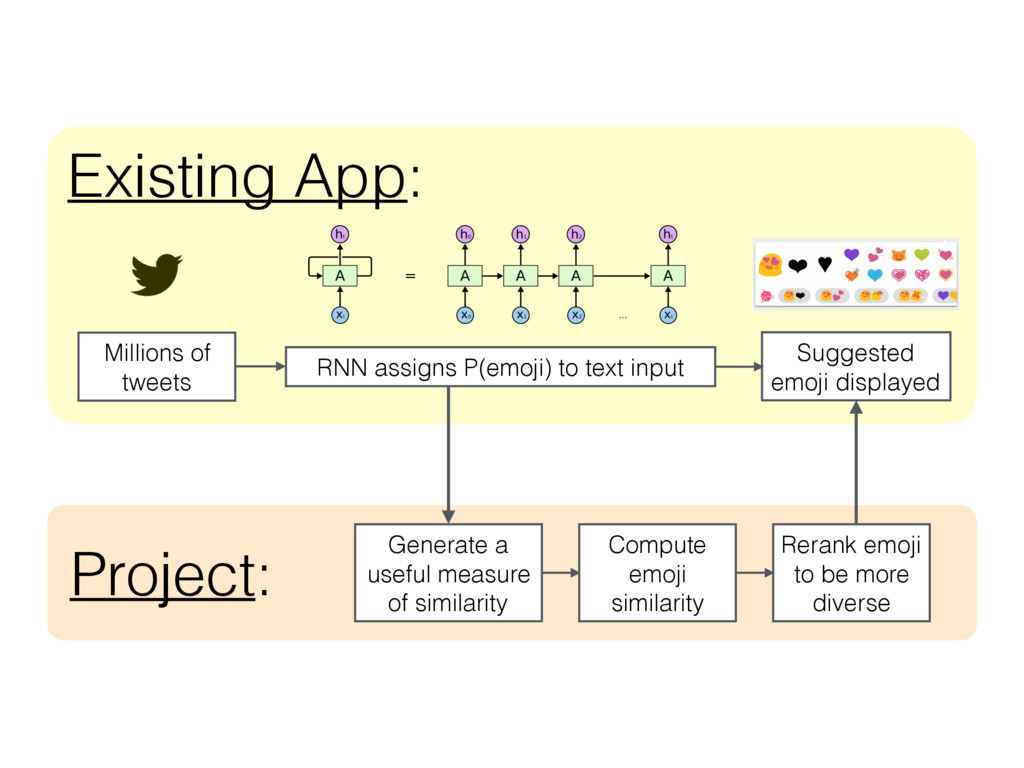
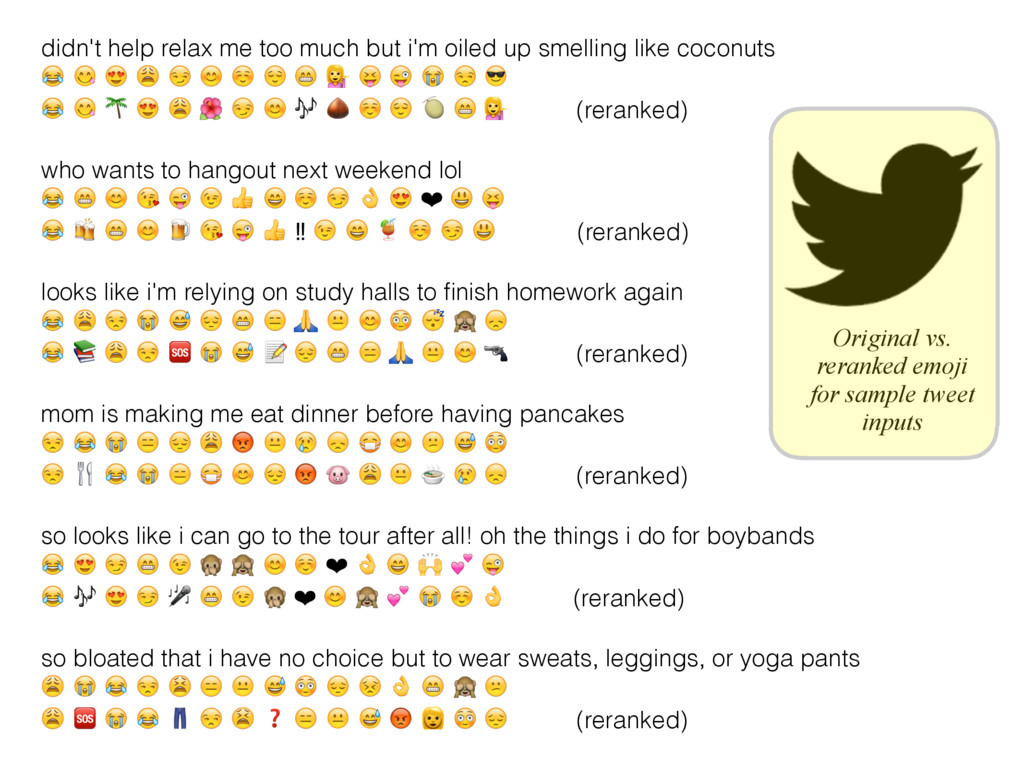
It's a great app, and the performance of the RNN is very impressive, but sometimes the most probable emoji for a given text input are very similar to one another, and so the menu displayed to the user is too redundant (e.g., all hearts, all clocks, or all smiley faces). To address this problem, I sought to establish a useful measure of similarity between recommended items (emoji), and then use this similarity measure to improve the diversity of items that are displayed to the user.
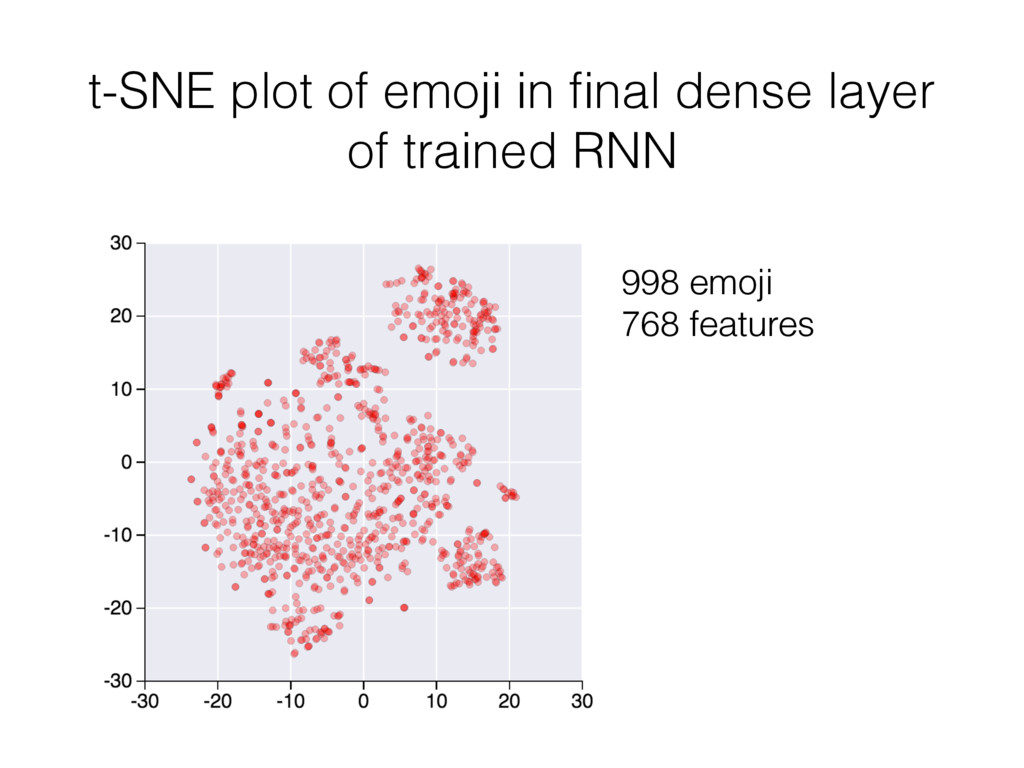
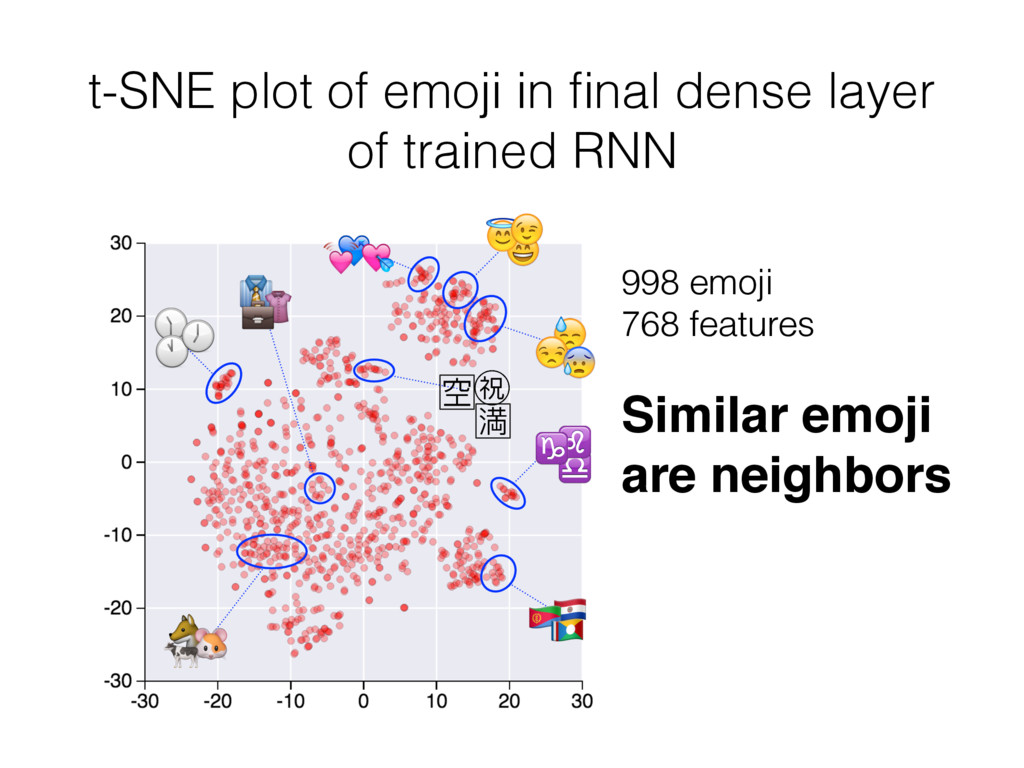
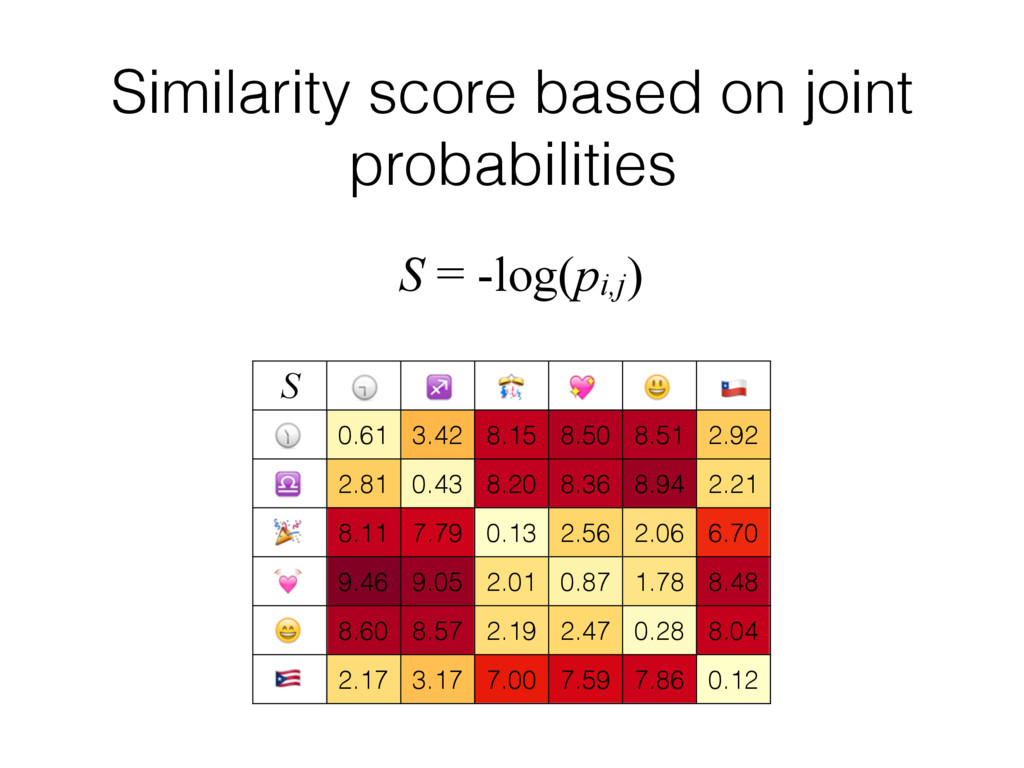
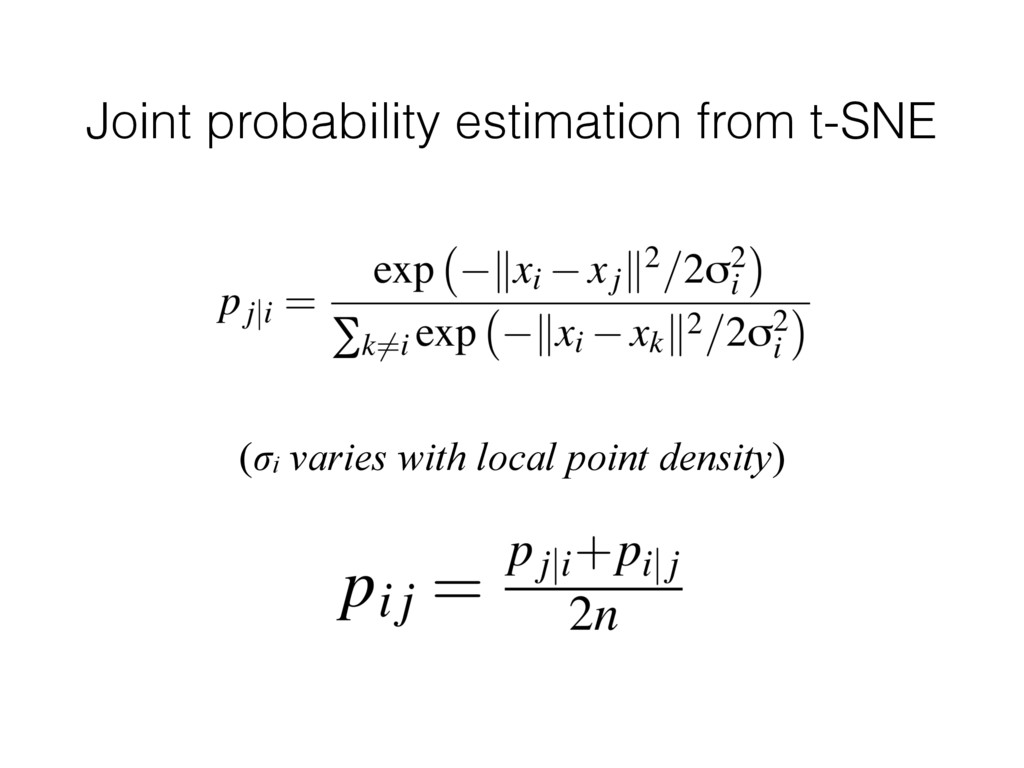
Importantly, I observed that in the high-dimensional feature space of the trained RNN's final dense layer, similar emoji are located near to one another. I observed this by visualizing 2-dimensional t-SNE renderings of the final dense layer feature space. The t-SNE algorithm estimates pairwise joint probabilities between all points in a dataset using Gaussian kernel functions centered about each point. To quantify the degree of similarity between all pairs of emoji, I used this same approach to estimating their joint probabilities, and used the negative log of the joint probability as a convenient and effective similarity score (similarity S=0 for joint probability P=1; S=1 for P=0.1; S=2 for P=0.01; and so on).
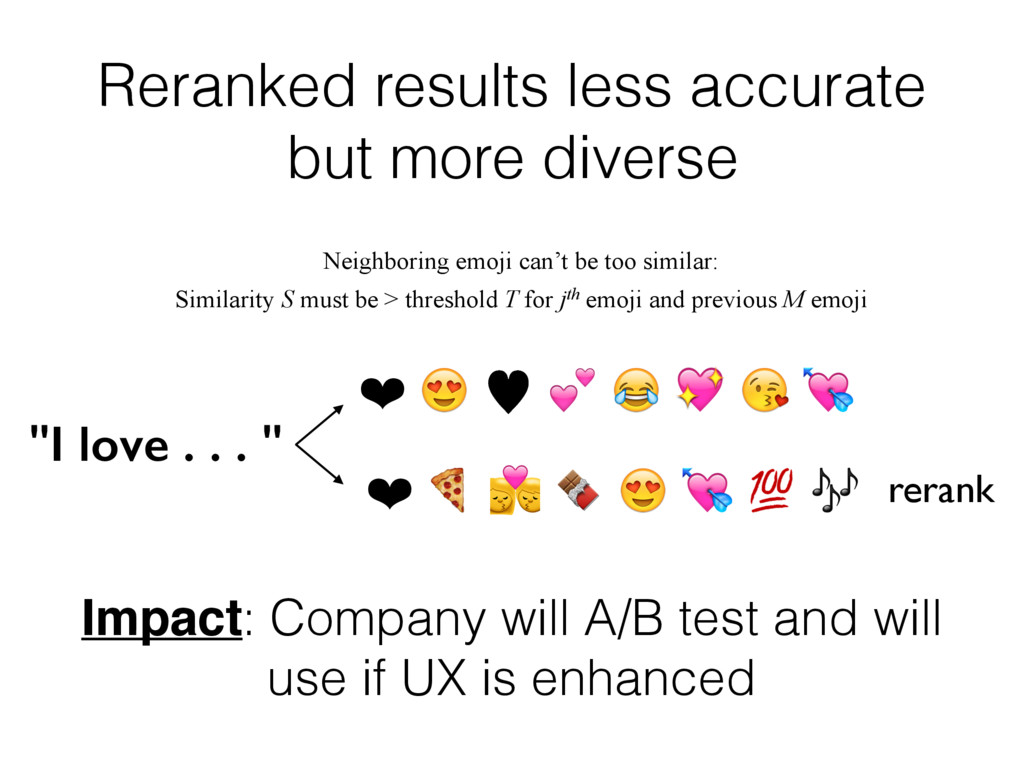
I next used this similarity score to modify the original ranking by demoting any emoji that was too similar to those preceding it in the original ranking. This reranking reduces the model's accuracy in the sense that it is no longer optimized to predict the most probable emoji for a given user input. However, increasing the diversity of the displayed items can improve user experience by providing the user with a more interesting set of options to choose from.
The modified ranking will ultimately need to be validated with A/B tests. It will be particularly important to measure how frequently users presented with the "reranked" menu select emoji that would not have been displayed in the original menu, and how frequently users presented with the original menu select emoji that would not have been displayed in the "reranked" menu.
The approach described here, for measuring similarity between items in a recommender system's inventory, should generalize to arbitrarily large, unlabeled inventories, provided that a suitable model (such as a neural network) has already been trained to predict items in the inventory. This circumvents the need for additional supervised learning or specialized knowledge to differentiate between similar vs. diverse sets of items and may prove useful for diversification of other recommender systems.