Upgrade to Pro — share decks privately, control downloads, hide ads and more …

Tidal Energy

Erasto
February 25, 2021

Tidal Energy

None

Erasto

February 25, 2021
Tweet

Other Decks in Education

Transcript

  1. Ocean Engineering 195 (2020) 106675 Available online 18 November 2019

    0029-8018/© 2019 Elsevier Ltd. All rights reserved. Energy capture evaluation of tidal current turbines arrays in Uldolmok strait, South Korea Manh Hung Nguyen a,c,*, Haechang Jeong b, Hong Ha Tran c, Jin-soon Park d, Changjo Yang a a Division of Marine Engineering, Mokpo National Maritime University, 91 Haeyangdaehak–ro, Mokpo, 58628, Republic of Korea b Graduate School, Department of Marine Engineering, Mokpo National Maritime University, 91 Haeyangdaehak–ro, Mokpo, 58628, Republic of Korea c Vietnam Maritime University, 484 Lach Tray, Ngo Quyen, Hai Phong, 180000, Viet Nam d Coastal Development Research Center, Korea Institute of Ocean Science & Technology, 385 Haeyang-ro, Busan, 49111, Republic of Korea A R T I C L E I N F O Keywords: Uldolmok strait Tidal array optimization Wake interactions Tidal current turbines A B S T R A C T This paper presents a quantitative method for evaluating tidal energy extraction in Uldolmok Strait located in the southwestern part of the Korean Peninsula, which is well known for having an impressively fast tidal current speed, up to 6 m/s. The advantages of this method are expressed by maximizing the power captured by all the turbines deployed in a tidal farm and by optimizing the array layout size with twelve different configurations. The energy yield of the proposed designs is evaluated based on flow data for the hydrodynamic model used, impacts of sea depth, device installation constraints, and wake effects between the turbines on the farm. The results show that staggered layouts achieve higher efficiency for energy extraction than centered arrangements in all cases. Moreover, an array configuration with 48 turbines is least efficient for tidal farming as it suffers the highest energy losses caused by the wake effects in comparison with other designs. When considering the op­ timum energy yield and cost of energy for tidal farming, the small-scale farm could be the most satisfactory selection because it ensures the capital cost of the entire tidal project as well as minimizes the negative effects on the marine environments in Uldolmok. 1. Introduction Recently, the demand for new renewable energy sources has been rising due to growing concerns about climate change, a global reduction in greenhouse effects and dependence on fossil fuels from human power consumption. Among the new renewable energy sources, tidal power has many advantages because of its higher energy density and reli­ ability, which makes it highly attractive from a grid management perspective. For renewable electricity production, tidal turbines are a competitive and promising option due to the increasing cost of energy. However, any projects of tidal farms installed with many tidal energy converters (TEC) must be considered carefully, especially minimizing the costs of turbine installation and subsea cabling. Moreover, the optimization of tidal turbine arrangement on a farm to obtain the highest tidal energy extraction is a complicated and challenging process. Where to deploy the tidal turbines within a real site and how to optimize a tidal farm performance should be considered carefully. In other words, finding an ideal layout is crucial because it could considerably affect the amount of energy captured and determine the economic feasibility of a tidal project. Due to the difficulties in installing the observation equipment inside the real tidal farms, carrying out an evaluation of the effectiveness of these farms using the scaled-down models in the experimental flumes or numerical methods could be seen as a feasible solution. Myers et al. (2005a, 2005b) and Mycek et al. (2014a, 2014b) have conducted several scaled experimental tests. This assessment approach of tidal array per­ formance in the experimental flumes has highlighted advantages, such as relatively accurate replication of fluid-turbine interaction and the ambient turbulence intensity effect on the stream turbines in the layout. Nevertheless, testing the tidal stream array in the flumes exists several limitations on the quantity of the turbines installed and the Reynolds number resemblance (Ottavio et al., 2016). The numerical method or Computational Fluid Dynamics (CFD) is a substitutive solution in this case (Kolekar et al., 2015; Goundar et al., 2013; Lee et al., 2012; Jo et al., 2010). Building the tidal turbines based on Blade Element Momentum Theory (BEMT) or Actual Disk Theory (ADT) can be evaluated as initially common methods for the purpose of tidal farm optimization (Whelan et al., 2009; Masters et al., 2011; Harrison et al., 2010; Malki * Corresponding author. Vietnam Maritime University, 484 Lach Tray, Ngo Quyen, Hai Phong, Viet Nam. E-mail address: [email protected] (M.H. Nguyen). Contents lists available at ScienceDirect Ocean Engineering journal homepage: www.elsevier.com/locate/oceaneng https://doi.org/10.1016/j.oceaneng.2019.106675 Received 24 November 2018; Received in revised form 19 October 2019; Accepted 2 November 2019
  2. Ocean Engineering 195 (2020) 106675 2 et al., 2014; Bai

    et al., 2013; Hunter et al., 2015). It can be said that these methods have not fully considered other important factors of the sur­ rounding environment, especially the variation of tidal flow direction, water surface elevation or complexity of seabed topography. Therefore, the researchers have been developing and applying other tools to the tidal farming process to give more comprehensive and efficient assessments. A few quantitative studies, which have similar approaches to the wind farm applications (Javier et al., 2010; Chen et al., 2013; Pillai et al., 2017), have aimed to investigate ideal array layouts for the greatest power generation. For example, a study has been conducted using TELEMAC for a tidal current turbine farm in Paimpol-Br� ehat (Pham et al., 2009). This project optimized layouts based on different constraints such as the natural conditions of the site (uneven beds and water flow), sea surface and ground clearance features, the spacing between devices and tidal current direction. However, the study did not mention losses in tidal energy extraction due to wake effects in the proposed array layouts. There has also been a study done on energy extraction via tidal turbines in an idealized channel implemented in the Regional Ocean Modeling System (ROMS) by Thyng et al. (2013). This study’s methodology allowed to produce a more realistic result and assessed the impact of tidal turbines on the hydrographical system. However, the power assessment methodologies used mainly focused on turbine effects on flow features and site characterization, without per­ forming a detailed evaluation of the energy yield of the proposed arrays to optimize power extraction. Besides that, Funke et al. (2014) carried out a study on tidal array layout optimization using an adjoint approach. In their work, configurations for tidal turbine farms were formulated as optimization problems constrained by partial differential equations describing the flow. However, tidal layout optimization using gradient-based adjoint models can be difficult due to complexity, as they involve differentiating to find the solution of a partial differential equation. Martin et al. (2018) have investigated the flow characteristics of tidal turbine arrays using a three-dimensional OpenFOAM model. The wake formations of all the turbines in the tidal arrays have well con­ structed in this study; however, further improvements of the wake characteristic prediction are required. In summary, each method to simulate the tidal array layouts and optimize the power generation of the tidal farm as mentioned above has its own strong points and existing drawbacks so far. However, those studies have considerably contributed to the development of tidal energy harvest in the future. Uldolmok Strait is famous for its strong tidal flows, with a maximum current speed of over 6 m/s, measured using ADCP since 2002 by Kang et al. (2006). Byun et al. (2013) have also evaluated Uldolmok as one of the highest annual energy density sites in the southwestern part of the Korean peninsula according to the results of a study on tidal current energy resource estimates. This channel is located between Jindo Island and Haenam County. In addition, the Uldolmok Strait has an average depth of 15–20 m, and the width of the narrowest part is about 250 m (Lee et al., 2009), as shown in Fig. 1. In this paper, we present a nu­ merical method for optimizing turbine arrangement within the tidal farms of Uldolmok and maximizing power extraction of tidal turbines in an array configuration based on a finite-element coastal ocean model that provides tidal currents across sites. Twelve different designs for tidal farm layouts, including six centered and six staggered formations have been constructed based on tidal device installation constraints, tidal device characteristics, ambient turbulence intensities, and power laws via a reference location, tidal stream speed and direction, and water depth. In this study for tidal array layout optimization in Uldol­ mok, a large number of layout configurations with different numbers of turbines have been designed and tested. The array designs presented are the most typical patterns selected to compare tidal energy extraction. Fig. 1. Location and bathymetry topography in Uldolmok. M.H. Nguyen et al.
  3. Ocean Engineering 195 (2020) 106675 3 Annual energy yield is

    used to evaluate the power output extracted from the turbines in the tidal farms. Energy yield also takes into account energy loss due to wake effects, which helps evaluate more accurately the annual energy yield of the various array layouts. The energy yield of the selected array designs has been compared so that an optimal tidal array configuration for the Uldolmok Strait can be found. 2. Optimization process In this study, a comprehensive assessment of tidal farming optimi­ zation for the Uldolmok Strait has been carried out using commercial code software, TidalFarmer, which is an array planning and analysis tool used to predict the energy capture of a turbine array. The power gen­ eration prediction for a tidal farm is derived by evaluating turbines’ interactions and the potential effect an array layout will have on energy yield. This evaluation has been achieved through the development of rationalized modeling methods, which involves reducing incredibly complex interactions between tidal turbines and the surrounding flow field into a series of distinct physical processes (namely, coastal basin, array scale, and device scale) that can be simplified and modeled. Fig. 2 diagrams the energy yield analysis used to optimize tidal farming. Total array energy extracted is the sum of all individual turbines (Nguyen et al., 2016) and expressed as follows: Earray ¼ X Ndir k¼1 X Nv i¼1 X Nt j¼1 Pj ik :fik ; (1) where Earray is the total energy output extracted by the farm. Definitions of the remaining terms in equation (1) are interpreted as below: - Pj ik is the average power output, fik is the frequency of occurrence of the power output in the specified period; - j is a turbine index, Nt is the total number of turbines in the farm; - i is a tidal stream velocity index concerning the speed bin (for example 1–5 m/s) under consideration, Nv is the total number of tidal speeds in the long-term flow velocity distribution for each flow direction; - k is a flow direction index, Ndir is the total number of flow speed directions. As depicted in Fig. 2, a two-dimensional depth-averaged flow field extracted from the tidal modeling model, has been being extrapolated to generate a model with a three-dimensional flow field. This model has been designed in the frequency region through a binning process by adding the tidal flow field results from a hydrodynamic model into speed bins. The simulation process of a tidal farming optimization used in this paper is similar to that presented by Nguyen et al. (2016) for tidal farming in Jangjuk Channel, South Korea. After interpolating the 3-D flow field, a combination of several important input parameters is executed, such as the incident flow characteristics (ambient turbulence intensity, boundary layer height, tidal flow speeds and direction during flood tides and ebb tides) and wake prediction models. In order to correlate the spatial variability of the flow speed across a site with the long term frequency distribution to perform an energy yield calculation, the long term resource data must be added. The long term resource data (or long term reference points) contains the speed bin centers, the bin widths and then a list of the probability frequency for each direction and flow speed bin. This probability for all directions and all speed bins sums to unity. The ambient flow for a tidal stream is considered as turbulent, therefore the eddy viscosity in the wake cannot be wholly described by the shear contribution and an ambient term is required (ambient tur­ bulence intensity). This could be the rotor averaged (or swept area) turbulence intensity or the average turbulence over a multiple of the rotor diameter. Then, information on the turbine characteristics, every turbine’s coordinates and installation constraints of these turbines considering a reduction of grid connection costs and negative in­ teractions between the turbines in a specific array design should be added. Finally, an energy yield extracted from all the turbines will be obtained throughout this process. By analyzing the energy production, the researchers and the project’s investors could evaluate the array performance of the present arrangement which is effective or not. This optimization process can be viewed as a fairly comprehensive approach to serving the tidal projects currently. When analyzing energy yield production of the tidal arrays, two main energy calculations for layout optimization were performed to allow for assessment of the efficiency of the proposed array layout de­ signs, including gross and net energy yield calculations. The former was considered in a scenario where all turbines experienced bathymetry induced local speed changes without the upstream turbines’ wake effect. Fig. 2. Diagram of energy yield calculation for an array. M.H. Nguyen et al.
  4. Ocean Engineering 195 (2020) 106675 4 The latter was calculated

    in the same situation, adding the effect of wake losses. There are three models included in the TidalFarmer tool in order to resolve the wake deficits downstream of operational devices. These are the Park model, two-dimensional (2-d) eddy viscosity model, three- dimensional (3-d) eddy viscosity model. The eddy viscosity wake model is a calculation of the velocity deficit field using a finite-difference so­ lution to the thin shear layer equations of the Reynolds Averaged Navier- Stokes equations in axisymmetric coordinates. In the case of the 3- d eddy viscosity model, the non-axisymmetric development of a tur­ bine wake makes it unfeasible to use a cylindrical coordinate system; instead, a Cartesian coordinate system is proposed. In this study, the ‘Park model’ developed by Jensen et al. (1986) has been used to simulate wake effects, which provides a semi-empirical description of wake flow on the assumption that a wake is axisymmetric and unbounded. The development of wakes was influenced by free stream conditions as well as interactions with other turbine wakes within the flow field. In addi­ tion, there were two other calculations for energy yield assessment, including baseline energy yield and net energy yield with wake and blockage effects. Baseline energy yield was predicted for all turbines experiencing the same flow regime as at the reference location, where power-weighted speed was calculated using input power-law profiles. For net energy with wake and blockage effects, all turbines within the site-experienced bathymetry inducing local speed changes, where wake losses were calculated and local blockage effects were modeled. Admittedly, maximizing the energy yield of a particular tidal farm was a visible challenge while still ensuring the optimization of the cost of energy. Hence, the aim of this quantitative method was to produce re­ sults that feed directly into calculations for the cost of energy optimization. Key assumptions and limitations of the numerical model consist of: - The thrust coefficient and wake decay rate are suitable parameters that can be used to determine the recovery rate of the centreline flow speed. - Park model assumes axial symmetry of the wake, however, the wake flow will transition to a shallow water wake. - The blockage effect can be modeled purely by an increase in thrust and power coefficient and is achieved through the use of the Blockage model. - The initial velocity deficit at the start of the far wake position is a function of the thrust coefficient and turbulence intensity. - The flowing shape at the near wake boundary can be approximated by a Gaussian curve. The current assumptions made within the numerical tool used in this research imply that the effect of energy extraction on the global flow is small and does not significantly alter the 2-d bathymetry-driven flow field. Effectively, this assumes that the momentum extracted by each turbine is small in comparison to the energy in the surrounding flow. There will be a reduction in the momentum due to the extraction of energy and thus a resulting drop in free-surface elevation downstream to accommodate this extraction. However, on a micro-scale the energy extracted by the turbine will be replenished from the across-stream flow and the effect on the downstream flow will be small. 3. Input data and setup parameters 3.1. Pre-processing: site-specific tidal prediction The requirements for site-specific tidal flow field prediction include two modeling methods: long-term prediction of the temporal variation in tidal flow at the site and a model for spatial variation of flow. Pre- processing methods were used to convert the results from a flow solver into spatial flow fields for each flow state. These were then analyzed to calculate the resulting energy yield. It was assumed that the momentum extracted was solely due to the energy extraction of the devices and not blockage effects that may have diverted flow upstream. For small arrays, it has been shown that this assumption is valid. For larger arrays, it may have been necessary to reduce the mass flux through the array to capture the two-scale mixing problem. 3.1.1. Tidal modeling To investigate the characteristics of the tide and tidal current depth- averaged numerical modeling, two-dimensional tidal modeling using an ADCIRC model was constructed around the Uldolmok Strait. Tidal cur­ rents in this area are extremely high because of the narrow channel width and relatively shallow depth. Tidal amplitudes of the dominant, principal semi-diurnal tide M2 and principal diurnal tide K1 in Uldolmok have an average of 1.2 m and 0.31 m, respectively, as observed by Kang et al. (2012) and Yum et al. (2003). The maximum tidal range can be as large as approximately 4 m. A fine unstructured grid resolution was used for the hydrodynamic model with element size varying from 20 m at the narrowest part of the channel to 100 m for sections near the ocean, as shown in Fig. 3. The hydrodynamic model used consists of about 95,000 elements and 50,000 nodes in the horizontal plane. Bottom friction and a friction factor increase were set to 0.004 and 0.3333, respectively. The wave continuity coefficient was set to 0.005, and a value for the lateral viscosity of 4 m2/s was used. An open boundary condition for the model was specified near the Uldolmok Strait using eight harmonic tidal constituents (K1, M2, N2, O1, S2, P1, Q1 and K2). River inflows, as well as density-induced and wind- driven currents, were not considered in this study. Tidal modeling data for the Uldolmok Strait was validated against observations over one month. A comparison of depth-averaged current speed in the ADCP data observed in 2002 by Kang et al. (2006) at T1 and calculations from the present study is illustrated in Fig. 4. Other comparisons of depth-averaged current speeds and tidal ranges for validation between the numerical results of the present study and the observed data were carried out; however, they are not shown in this paper. 3.1.2. Time-series tidal energy resource calculation This resource calculation determined kinetic energy flux across the site as predicted using the current speed in a hydrodynamic model. Then, these results indicated the best tidal energy resource when considering the position of the given tidal stream energy farm. Carballo et al. (2009) and Blunden et al. (2006) presented a function of energy density (Ed, Wh/m2) over a specified period (T): Ed ¼ Z T 0 Pd dt ; (2) where: Pd is power density (W) of a tidal stream, representing the kinetic energy flux per unit square meter. Fig. 5 shows the time-series energy density map for the Uldolmok Strait based on equation (2). The results show that the highest energy density is concentrated near the narrowest part, with over 40 kW/m2. Fig. 3. Unstructured grids around Uldolmok Strait. M.H. Nguyen et al.
  5. Ocean Engineering 195 (2020) 106675 5 3.1.3. Flow field data

    Flow fields relate three-dimensional currents through the array, which are essential for tidal farming optimization in the Uldolmok Strait. Input data included long-term resources and observed power law and turbulence intensity profiles. Many studies have been conducted using different power laws due to the impact of seabed surface rough­ ness, such as the 1/7th power law, 1/10th power law, and logarithm power law (Harrison et al., 2010). Tidal flow characteristics at Uldolmok Strait were investigated by Ko et al. (2017). The tidal current data were measured using an Acoustic Doppler Current Profiler (model: WHWS ADCP 600 kHz). According to conclusions of that research, the power-law exponent (n) of tidal current was approximately 9.3 during ebb and 10.75 during the flood, as shown in Fig. 7. In order to extrap­ olate a depth-averaged flow field model into three-dimensions, the power-law and turbulence intensity at different flow speed values are required. The turbulence intensity input is a depth-averaged value for each direction and flow speed value. The approach adopted for the turbulence intensity parameters is to divide the depth-averaged current speed by the flow profile through the vertical and then multiply by the turbulence intensity. This gives a profile that mimics the turbulence intensity profile observed at real sites. Table 1 presents a summary of turbulence intensity inputs for the TidalFarmer based on the data collected by Ko et al. (2017). Long-term resource information and the tidal ellipse at a long-term reference point are shown in Fig. 6. Along the Uldolmok Strait, the tidal rise is almost symmetric in terms of magnitude and direction. The (a) Depth-averaged stream velocity (b) Water surface elevation Fig. 4. Validation of the depth-averaged speed and tidal range from ADCP data observed in 2002 (Obs.) to the present study’s results (Cal.). Fig. 5. Energy density map in Uldolmok. M.H. Nguyen et al.
  6. Ocean Engineering 195 (2020) 106675 6 flow is bi-directional with

    two main directions: around 135� clockwise from the North during ebb tides (i.e., South-East) and around 315� during high tides (i.e., North-West), which means ebb and flood states produce nearly opposite angles. In addition, the numerical model showed that velocity was not uniform over the zone and can vary a great deal within distances of only hundreds of meters. 3.2. Array design and turbine installation constraints 3.2.1. Tidal stream device parameters These variables describe a single tidal stream device, which can be of arbitrary definition. The parameters consist of the device geometry, such as hub height, rotor diameter as well as performance. Due to the limi­ tations on the complexity of bathymetry as mentioned in above (the averaged water depth is about 15–20 m) while considering the viability of a tidal farming project, a turbine with a 0.5 MW power output scale was used, and device geometry parameters were set as shown in Table 2. The turbine with three blades using S814 foil (Fig. 8) was designed based on BEMT (Blade Element – Momentum Theory) and developed by the authors at the Ocean Fluid Machinery Lab of Mokpo National Maritime University. The turbine was numerically tested at various TSRs (Tip- speed ratio) and compared to other models (Fig. 8a) conducted by Bahaj et al. (2007), Tian et al. (2016), and Hu et al. (2017). For this purpose, a commercial CFD code, ANSYS 17.0 was used. Fig. 9 illustrates a com­ parison of power coefficient, power output and torque between the authors’ design and other studies. In general, the present model showed a similar trend of power coefficient (CP) compared with the others. More Table 1 Turbulence intensity (TI, %) inputs for the numerical analysis. Velocity (m/s) TI (%) in Flood tides TI (%) in Ebb tides 0 0 0 0.3 42.5 41.3 0.5 35.1 32.8 1 18.8 19.2 1.5 15.2 14.4 1.8 13.6 13.2 2 12.5 12.8 2.5 11.1 10.6 3 10.4 10.5 3.5 10.2 9.8 4 9.6 9.5 4.5 8.9 8.3 Fig. 6. Tidal ellipse and flow speed probability at a long-term reference point at the narrowest part in Uldolmok. Fig. 7. Measured data of the power-law exponent (n) compared to the depth- averaged velocity in Uldolmok Strait by Ko et al. (2017). Table 2 Turbine design parameters. Parameters Value Rated power output [kW] 500 Rotor outer diameter [m] 8.46 Device hub height [m] 9.3 Rated flow speed [m/s] 3.5 Rated tip speed ratio 5 Rotational speed [rpm] 39.5 Cut-in flow speed [m/s] 1 Cut-out flow speed [m/s] 7 M.H. Nguyen et al.
  7. Ocean Engineering 195 (2020) 106675 7 specifically, the CP curve

    rises up quickly from TSR 3. The highest CP was obtained at TSR 5, about 43%, corresponding to 530 kW power output (Fig. 9b). After that, the CP curve falls down gradually up to TSR 9. 3.2.2. Device installation constraints Device installation conditions defined the primary constraints such that deployment of tidal stream energy converters was realistic when considering the expected energy yield of a layout, as described in Fig. 10. The planning area for turbine installation has a relatively small width, about 60 m. Thus, the number of turbines deployed in the lateral direction is a maximum of four when the lateral spacing is fixed at 2D (D is a rotor diameter). With this respect, minimum lateral spacing is set between 2 and 2.5D. If a device violated a constraint check, it was eliminated for the energy yield calculation. Table 3 shows the device installation constraints used for this study. The minimum lateral and longitudinal distances will be applied to a fixed value depending on tidal farm sizes. 3.2.3. Array layout configurations Regarding the tidal farm size based on the total energy captured, there are two scenarios used in this study, including the farms with energy yield Earray � 5 MW (small size) and 5 MW < Earray � 30 MW (medium size). For large-scale farms (Earray > 30 MW), it is unsatisfac­ tory due to the limitations of the seabed and terrain features in the Uldolmok Strait. According to the turbine characteristics and device installation constraints as listed in Tables 2 and 3, respectively, six scenarios for the small-scale tidal farm layouts were designed, including three centered layouts (as shown in Fig. 12a to c) and three staggered layouts (Fig. 12d to f). Efforts were made to minimize the period needed for testing each design to ensure that an optimum configuration for a tidal array layout Fig. 8. A three-dimensional model of a tidal current turbine used for the study with 500 kW rated power output scale. (a) Comparison of CP between the present model and other studies (b) Variation of power output and torque against TSR of the present model Fig. 9. Performance characteristics of the 500 kW power scale tidal current turbine used for tidal farming in Uldolmok Strait. Fig. 10. Device installation constraint on a tidal farm. Table 3 Turbine installation constraints. Parameters Value Minimum tip clearance [m] 5 Minimum lateral spacing [D] 2–2.5 Minimum longitudinal spacing [D] 5–10 Minimum depth for deployment [m] 18.5 Maximum depth for deployment [m] 23 Maximum slop [deg.] 80 Yawing strategy Free M.H. Nguyen et al.
  8. Ocean Engineering 195 (2020) 106675 8 was found. Tables 4

    and 5 illustrate array design configurations for all simulation cases in this study. As recommended by Myers et al. (2005), the most favorable lateral and longitudinal distances between two adjacent turbines in an array are 3D and 15D, respectively. However, for the complexity of some real sites’ terrain, this suggestion can be reconsidered to ensure the feasibility of the whole project. Indeed, the Uldolmok Strait is a highlighted instance. For this reason, the spacing between two adjacent devices within the farm was chosen to maintain a minimum spacing from 2.5D laterally and 10D longitudinally so that none of the turbines were placed near the wake of an upstream device as shown in Fig. 11. The turbines are placed perpendicular to the tidal flow direction. For the medium-scale farm, six array configurations were proposed, consisting of 18, 36 and 48 turbines with the same design parameters of the small-scale farms, except the minimum lateral spacing and longi­ tudinal spacing of 2D and 5D between two adjacent turbines, respec­ tively, instead of 2.5D and 10D as inputted for the small-scale farms. This selection is based on the geographical features of the Uldolmok Strait as mentioned above. To solve to the problem of wake interactions between turbines in the tidal array, this paper utilizes a Park model (Jensen et al., 1986; Jensen, 1983) for determining the wake deficit and its effects on the downstream turbines, expressed by a factor called “wake decay constant”. A detailed assessment of this factor’s value and a comparison of the tidal array performance between the Park and Eddy Viscosity models were analyzed by Nguyen et al. (2017). In the present study, the Park model was selected for the wake prediction because it has been commonly used since the 1980s and is simple, robust and rather accurate in the case of calculating the wake losses on an annual energy yield (Alfredo et al., Table 4 Small-scale array configurations (Earray � 5 MW). Layout index Number of turbines Row � turbine Longitudinal (D) � lateral (D) A 4 2 � 2 10 � 2.5 B 6 2 � 3 10 � 2.5 C 8 2 � 4 10 � 2.5 Table 5 Medium-scale array configurations (5 MW < Earray � 30 MW). Layout index Number of turbines Row � turbine Longitudinal (D) � lateral (D) D 18 3 � 6 10 � 2 E 36 3 � 12 10 � 2 F 48 3 � 16 10 � 2 (a) For the small-scale farms (b) For the medium-scale farms Fig. 11. Diagram of turbine arrangements in the array layout. M.H. Nguyen et al.
  9. Ocean Engineering 195 (2020) 106675 9 2016). 4. Results and

    discussion 4.1. Evaluation of energy absorption 4.1.1. For the small-scale array layouts In this study, an energy yield calculation was used to estimate the power output of devices installed in a particular area in the Uldolmok Strait with known flow characteristics and mapped bathymetry data. This energy yield calculation can be used to obtain estimates for an idealized energy calculation, spatial variability across a site, and adverse impacts of wake flow. Increases in speed and net energy yield for all the tidal turbines within a farm were used to evaluate the energy yield capability of a tidal farm. Energy yield due to increases in speed was considered as gross energy, which is the sum of the energy yield of all turbines without wake effects. On the contrary, net energy yield can be considered as a wake energy yield, including the impact of wake effects on tidal power generation. Fig. 13 Fig. 14 compares the net energy yields calculated from all array layouts, between centered and staggered formations. The horizontal axis shows the layout indices from layouts A to C for both centered and staggered configurations. As seen in Fig. 14, it is evident that staggered arrangements show a higher efficiency for tidal energy extraction than centered ones in all cases of tidal array layouts. Differences in the net energy yield between the two configurations throughout layouts A to C were about 5.3%, 8%, and 7.1%, respectively. It can be concluded that centered formations produce smaller energy yields than staggered de­ signs because the turbines deployed in a centered arrangement may suffer increased energy losses due to wake effects by upstream devices. An analysis of energy yield losses owing to wake effects was conducted and is illustrated in Fig. 15. Moreover, the relative superiority of annual energy yield from a staggered formation may be derived from the deployment of turbines benefited by high tidal energy density at the narrowest area in Uldolmok. As illustrated in Fig. 5 of the tidal energy resource assessment, the narrowest part of the Uldolmok Strait has much higher energy density than other locations. Therefore, turbines deployed to this area will harness more tidal current energy as well. In this case, to form staggered arrangements, turbines No.1 and No.5 in the first row of layout B and turbines No.3 and No.7 in the first row of layout C were positioned closer to the highest energy density site. Thus, in addition to lower energy yield losses from wake effects, these turbines in the Fig. 12. Small-scale tidal farms in the Uldolmok Strait. Fig. 13. Medium-scale tidal farm in the Uldolmok Strait. M.H. Nguyen et al.
  10. Ocean Engineering 195 (2020) 106675 10 staggered arrangement generated more

    power than those in the centered layout. The energy losses will be discussed further in the turbines’ wake interaction analysis. Fig. 15 compares total energy yield losses (%) due to wake effects and device installation constraints among all array configurations. This loss has been calculated depending on net energy yield (or wake energy yield) for all turbines in the tidal farm and gross energy yield without wake effects. As seen in Fig. 15, the arrangement of tidal turbines in centered layouts causes higher power losses than in staggered designs. The maximum energy loss for staggered layout A with four turbines was about 2.1% of the total annual energy yield achieved by this farm, corresponding to an approximately four times smaller loss than that of centered layout A with the same number of turbines. It can be said that centered layout A showed the lowest performance in this study since it has the highest energy losses due to wake effects. The discrepancy in energy production of layouts B and C was 3.41% and 1.93%, respec­ tively. This also means that when deploying more turbines, the energy losses induced by wake effects in staggered arrangements were slightly smaller than those of centered designs were. In general, the efficiency of power extraction by different array configurations can also be evaluated based on the average unit extractable power per turbine. Fig. 16 shows a comparison of net energy yield per device (due to wake effects) among all array layout configu­ rations. It can be concluded that the average unit extractable power output of staggered arrangements is slightly higher than that of centered arrays. The results also indicate that staggered layout B with six turbines shows a greater unit extractable power than others. However, it can be seen in Figs. 14–16 that the annual energy yield of layout C in staggered formation is about 2 and 1.6 times higher than that of layouts A and B, respectively, although energy losses due to wake effects in this arrangement are greater than others. In other words, the design with eight turbines can be regarded as better than other formations when considering optimization of energy yield for the small-scale farms in Uldolmok. This design can produce high tidal energy extraction with a high density of tidal stream devices. Table 6 shows a comparison of individual turbines’ performance (energy yield, GWh/yr) in layout B with 6 turbines between the centered and staggered configurations. As shown in Fig. 12, the turbines No.1, No.4 and No.5 of the centered layout B are positioned in the same co­ ordinates as the turbines No.1, No.3, and No.5 of the staggered layout B, respectively. The results indicate that the individual turbines’ perfor­ mance in the staggered is over 40% increase in net energy yield compared to the turbines located in the same position in the centered layout. The reason is that the turbines in the staggered layout, in this case, are benefited by small effects of wake developments from the up­ stream turbines in both flood and ebb tides. 4.1.2. For the medium-scale array layouts Fig. 17 shows a comparison of the annual gross and net energy yields between the centered and staggered formations for the medium-scale farms. The statistical data from Fig. 17 indicates that the gross energy yield of the centered layouts is almost similar to that of the staggered arrangements. It means that the locations of the tidal turbines within both the centered and staggered layouts have the same tidal energy resources. Besides that, the net energy produced by the layout D is identical between the centered and staggered formations. Nevertheless, in the cases of the layouts E and F, the net energy yield of the centered configurations is about 3 GWh/yr lower than that of the staggered for­ mations. In other words, it is inferred that the wake flows of the up­ stream turbines impact on the downstream turbines in the centered layouts much more than those in the staggered designs. Concerning the energy losses in Fig. 18, the arrangement of tidal turbines in the centered layouts causes higher losses of power produc­ tion than that in the staggered designs in most cases, especially when deploying more turbines in the Uldolmok Strait. The maximum energy losses of the centered 48-turbine farm are up to 35.3% of the total annual energy yield achieved by this farm, corresponding to approximately 1.4 and 1.1 times higher than that of the centered 18-turbine and 36-turbine layouts, respectively. As well, Fig. 19 shows that the energy yields Fig. 15. Energy losses induced by wake effects in the small-scale farm. Fig. 16. Comparison of average unit extractable power (GWh/yr). Table 6 Comparison of individual turbines’ net energy yield (GWh/yr) of layout B with 6 turbines. Turbine index Centered layout B Staggered layout B No.1 1.733 2.44 No.2 1.12 1.09 No.3 1.524 1.544 No.4 1.053 0.595 No.5 1.439 2.113 No.6 0.92 0.686 Fig. 14. Comparison of the net energy yield between the centered and stag­ gered layouts of the small-scale farms. M.H. Nguyen et al.
  11. Ocean Engineering 195 (2020) 106675 11 extracted per device of

    the layouts E and F are much lower than that of the layout D. In brief, the layout D with 18 turbines installed in centered and staggered formations can be seen as the most effective configuration for the medium-scale farms in the Uldolmok Strait. 4.2. Analysis of the turbines’ wake interactions An analysis of the wake interactions of all the turbines in the array- scale was carried out for the layouts A, B, C and F as shown in Figs. 20–23. Looking at the wake visualizations, it is clearly seen that the wakes induced by the upstream turbines of the centered formation from the layout A to layout F superimpose on the downstream turbines, especially in the farms with a larger number of turbines. This phenom­ enon results in poor energy production of the downstream turbines. In other words, the total energy captured by the centered layouts, in this case, would be remarkably decreased. On the contrary, for the staggered layouts, the effects of the upstream turbines’ wake on the downstream devices are virtually avoided. It interprets the higher energy yield of the Fig. 17. Comparison of the gross and net energy yields between the centered and staggered layouts. Fig. 18. Energy losses induced by wake effects. M.H. Nguyen et al.
  12. Ocean Engineering 195 (2020) 106675 12 staggered layouts compared to

    the centered layouts as analyzed in Section 4.1 above. Also seen from visualizations of wake prediction in Figs. 20–23, it is obvious that the turbines’ wake in ebb tides has more curved shapes than that in flood tides. This feature is partly caused by the hydrody­ namic characteristics of the tidal stream in the Uldolmok Strait as featured by Kang et al. (2012). Along with the relatively complicated bathymetry topography, solving the problem of layout optimization of the tidal array in the Uldolmok Strait could be more difficult without considering the wake interactions between turbines. Indeed, the analytical method as presented in this paper supports appreciably the optimization process of the tidal array configurations by means of reducing the time in finding positions of the downstream turbine to avoid the wakes of the upstream turbines. As a result, the energy pro­ duction of the array would be maximized. Relating to the medium-scale farms (including 48 turbines) in Fig. 23, it shows that the superimposition of the upstream wake flows on the downstream turbines is much visibly stronger than that in the case of the small-scale farms. Comparing the extractable power per device (GWh/yr), the layout F with 48 turbines is about 30% and 38% lower than the layout A with 4 turbines and the layout C with eight turbines, respectively. In other words, with a large number of turbines deployed in the Uldolmok Strait, the energy losses caused by the wake effects can be evaluated as a noteworthy problem of optimizing the tidal array layout in the Uldolmok Strait. Because the structural loads on the turbine blades increases, the fatigue life of the turbines would be noticeably decreased. Consequently, the capital cost of the tidal project increases due to expansions of the operation and maintenance costs. Moreover, environmental problems (sediment transports, marine life) in this area are significantly affected as well. For those reasons, when considering the layout optimization of tidal arrays in the Uldolmok Strait, the small- scale farms could be the most satisfactory selection. To obtain visualizations of accurate wake interactions between tur­ bines and total power extracted in tidal farms as presented above, the inputted data for the energy yield calculation tool should be carefully considered. It means that the reliability and accuracy of the flow char­ acteristics (including tidal speed variations, turbulence intensity, and power-law values) and turbine specification data affected significantly the results of the tidal farming optimization. Therefore, it can be seen that the preparation of inputted data and the optimization process of the approach used in this paper were relatively more complicated than other methods that analyzed fully calculations of turbine performance and flow field interactions around the turbines. In addition, the method showed the improvement of tidal array performance (energy yield) by manually changing the positions of turbines on the farm. It can be said that the optimization of tidal farms, in this paper, required much experience and the intuitional selection of turbine location was difficult to form better configurations of the tidal farms. Consequently, the optimization process could be time-consuming. Such a manual manner of array optimization could also be considered as a drawback of the method used in this study. However, the purpose of the numerical tool in the paper is to provide the tidal stream energy industry with a comprehensive and definitive detailed assessment of the potential en­ ergy capture of tidal arrays within the geometric and environmental constraints of the site. By combining the characteristics of tidal energy devices to be placed within the array, the resource at the site in terms of a temporal and spatial flow field, and other site-specific characteristics which may impact on device interactions, the optimization approach of the present study could give a comprehensive and definitive detailed Fig. 19. Comparison of average unit extractable power (GWh/yr). Fig. 20. Visualizations of wake prediction of the layout A with 4 turbines during flood and ebb tides. M.H. Nguyen et al.
  13. Ocean Engineering 195 (2020) 106675 13 assessment of the potential

    energy capture of tidal arrays. 5. Conclusions In this paper, to study the effect of different turbine array configu­ rations on extractable tidal energy at a real site, a fine unstructured-grid hydrodynamic model combined with an array planning and analysis tool was applied to the Uldolmok Strait, South Korea. Conclusions are given as follows: 1. The current analytical method used supports appreciably the opti­ mization process of the tidal array configurations by means of reducing the time in finding positions of the downstream turbine to avoid the wakes of the upstream turbines. As a result, the energy production of the array would be maximized. 2. Staggered array layouts show a greater performance for tidal energy extraction than the centered arrangements, as they produce higher annual energy yield, lower energy losses due to wake effects, and higher unit extractable power than the centered formations. Fig. 21. Visualizations of wake prediction of the layout B with 6 turbines during flood and ebb tides. Fig. 22. Visualizations of wake prediction of the layout C with 8 turbines during flood and ebb tides. M.H. Nguyen et al.
  14. Ocean Engineering 195 (2020) 106675 14 3. Array configuration with

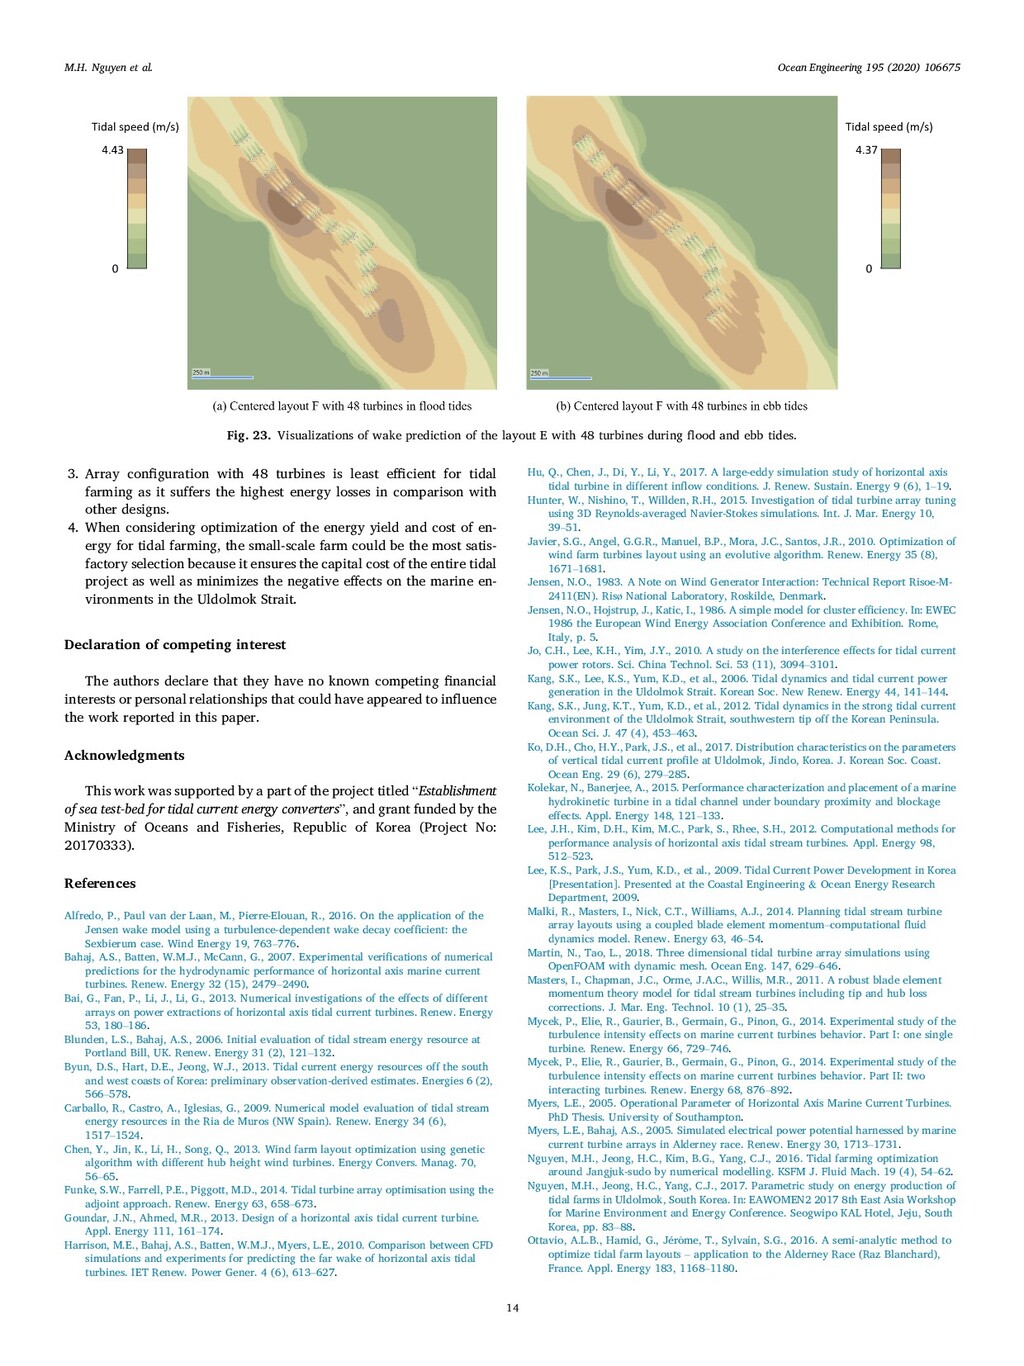
    48 turbines is least efficient for tidal farming as it suffers the highest energy losses in comparison with other designs. 4. When considering optimization of the energy yield and cost of en­ ergy for tidal farming, the small-scale farm could be the most satis­ factory selection because it ensures the capital cost of the entire tidal project as well as minimizes the negative effects on the marine en­ vironments in the Uldolmok Strait. Declaration of competing interest The authors declare that they have no known competing financial interests or personal relationships that could have appeared to influence the work reported in this paper. Acknowledgments This work was supported by a part of the project titled “Establishment of sea test-bed for tidal current energy converters”, and grant funded by the Ministry of Oceans and Fisheries, Republic of Korea (Project No: 20170333). References Alfredo, P., Paul van der Laan, M., Pierre-Elouan, R., 2016. On the application of the Jensen wake model using a turbulence-dependent wake decay coefficient: the Sexbierum case. Wind Energy 19, 763–776. Bahaj, A.S., Batten, W.M.J., McCann, G., 2007. Experimental verifications of numerical predictions for the hydrodynamic performance of horizontal axis marine current turbines. Renew. Energy 32 (15), 2479–2490. Bai, G., Fan, P., Li, J., Li, G., 2013. Numerical investigations of the effects of different arrays on power extractions of horizontal axis tidal current turbines. Renew. Energy 53, 180–186. Blunden, L.S., Bahaj, A.S., 2006. Initial evaluation of tidal stream energy resource at Portland Bill, UK. Renew. Energy 31 (2), 121–132. Byun, D.S., Hart, D.E., Jeong, W.J., 2013. Tidal current energy resources off the south and west coasts of Korea: preliminary observation-derived estimates. Energies 6 (2), 566–578. Carballo, R., Castro, A., Iglesias, G., 2009. Numerical model evaluation of tidal stream energy resources in the Ria de Muros (NW Spain). Renew. Energy 34 (6), 1517–1524. Chen, Y., Jin, K., Li, H., Song, Q., 2013. Wind farm layout optimization using genetic algorithm with different hub height wind turbines. Energy Convers. Manag. 70, 56–65. Funke, S.W., Farrell, P.E., Piggott, M.D., 2014. Tidal turbine array optimisation using the adjoint approach. Renew. Energy 63, 658–673. Goundar, J.N., Ahmed, M.R., 2013. Design of a horizontal axis tidal current turbine. Appl. Energy 111, 161–174. Harrison, M.E., Bahaj, A.S., Batten, W.M.J., Myers, L.E., 2010. Comparison between CFD simulations and experiments for predicting the far wake of horizontal axis tidal turbines. IET Renew. Power Gener. 4 (6), 613–627. Hu, Q., Chen, J., Di, Y., Li, Y., 2017. A large-eddy simulation study of horizontal axis tidal turbine in different inflow conditions. J. Renew. Sustain. Energy 9 (6), 1–19. Hunter, W., Nishino, T., Willden, R.H., 2015. Investigation of tidal turbine array tuning using 3D Reynolds-averaged Navier-Stokes simulations. Int. J. Mar. Energy 10, 39–51. Javier, S.G., Angel, G.G.R., Manuel, B.P., Mora, J.C., Santos, J.R., 2010. Optimization of wind farm turbines layout using an evolutive algorithm. Renew. Energy 35 (8), 1671–1681. Jensen, N.O., 1983. A Note on Wind Generator Interaction: Technical Report Risoe-M- 2411(EN). Risø National Laboratory, Roskilde, Denmark. Jensen, N.O., Hojstrup, J., Katic, I., 1986. A simple model for cluster efficiency. In: EWEC 1986 the European Wind Energy Association Conference and Exhibition. Rome, Italy, p. 5. Jo, C.H., Lee, K.H., Yim, J.Y., 2010. A study on the interference effects for tidal current power rotors. Sci. China Technol. Sci. 53 (11), 3094–3101. Kang, S.K., Lee, K.S., Yum, K.D., et al., 2006. Tidal dynamics and tidal current power generation in the Uldolmok Strait. Korean Soc. New Renew. Energy 44, 141–144. Kang, S.K., Jung, K.T., Yum, K.D., et al., 2012. Tidal dynamics in the strong tidal current environment of the Uldolmok Strait, southwestern tip off the Korean Peninsula. Ocean Sci. J. 47 (4), 453–463. Ko, D.H., Cho, H.Y., Park, J.S., et al., 2017. Distribution characteristics on the parameters of vertical tidal current profile at Uldolmok, Jindo, Korea. J. Korean Soc. Coast. Ocean Eng. 29 (6), 279–285. Kolekar, N., Banerjee, A., 2015. Performance characterization and placement of a marine hydrokinetic turbine in a tidal channel under boundary proximity and blockage effects. Appl. Energy 148, 121–133. Lee, J.H., Kim, D.H., Kim, M.C., Park, S., Rhee, S.H., 2012. Computational methods for performance analysis of horizontal axis tidal stream turbines. Appl. Energy 98, 512–523. Lee, K.S., Park, J.S., Yum, K.D., et al., 2009. Tidal Current Power Development in Korea [Presentation]. Presented at the Coastal Engineering & Ocean Energy Research Department, 2009. Malki, R., Masters, I., Nick, C.T., Williams, A.J., 2014. Planning tidal stream turbine array layouts using a coupled blade element momentum–computational fluid dynamics model. Renew. Energy 63, 46–54. Martin, N., Tao, L., 2018. Three dimensional tidal turbine array simulations using OpenFOAM with dynamic mesh. Ocean Eng. 147, 629–646. Masters, I., Chapman, J.C., Orme, J.A.C., Willis, M.R., 2011. A robust blade element momentum theory model for tidal stream turbines including tip and hub loss corrections. J. Mar. Eng. Technol. 10 (1), 25–35. Mycek, P., Elie, R., Gaurier, B., Germain, G., Pinon, G., 2014. Experimental study of the turbulence intensity effects on marine current turbines behavior. Part I: one single turbine. Renew. Energy 66, 729–746. Mycek, P., Elie, R., Gaurier, B., Germain, G., Pinon, G., 2014. Experimental study of the turbulence intensity effects on marine current turbines behavior. Part II: two interacting turbines. Renew. Energy 68, 876–892. Myers, L.E., 2005. Operational Parameter of Horizontal Axis Marine Current Turbines. PhD Thesis. University of Southampton. Myers, L.E., Bahaj, A.S., 2005. Simulated electrical power potential harnessed by marine current turbine arrays in Alderney race. Renew. Energy 30, 1713–1731. Nguyen, M.H., Jeong, H.C., Kim, B.G., Yang, C.J., 2016. Tidal farming optimization around Jangjuk-sudo by numerical modelling. KSFM J. Fluid Mach. 19 (4), 54–62. Nguyen, M.H., Jeong, H.C., Yang, C.J., 2017. Parametric study on energy production of tidal farms in Uldolmok, South Korea. In: EAWOMEN2 2017 8th East Asia Workshop for Marine Environment and Energy Conference. Seogwipo KAL Hotel, Jeju, South Korea, pp. 83–88. Ottavio, A.L.B., Hamid, G., J� er^ ome, T., Sylvain, S.G., 2016. A semi-analytic method to optimize tidal farm layouts – application to the Alderney Race (Raz Blanchard), France. Appl. Energy 183, 1168–1180. Fig. 23. Visualizations of wake prediction of the layout E with 48 turbines during flood and ebb tides. M.H. Nguyen et al.
  15. Ocean Engineering 195 (2020) 106675 15 Pham, C.T., Martin, V.A.,

    2009. Tidal current turbine demonstration farm in Paimpol- Br� ehat (Brittany): tidal characterization and energy yield evaluation with Telemac. In: EWTEC 2009 8th European Wave and Tidal Energy Conference. Uppsala, Sweden, pp. 181–188. Pillai, A.C., John, C., Lars, J., Mahdi, K., Sami, B., 2017. Application of an offshore wind farm layout optimization methodology at Middelgrunden wind farm. Ocean Eng. 139, 287–297. Thyng, K.M., Roc, T., 2013. Tidal current turbine power capture and impact in an idealised channel simulation. In: EWTEC 2013 10th European Wave and Tidal Energy Conference. Aalborg University, Denmark, pp. 111–121. Tian, W., Song, B., Pyakurel, P., VanZwieten, J.H., et al., 2016. Numerical simulations of a horizontal axis water turbine designed for underwater mooring platforms. Int. J. Nav. Archit. Ocean Eng. 8 (1), 73–82. Whelan, J.I., Graham, J.M.R., Peir� o, J., 2009. A free-surface and blockage correction for tidal turbines. J. Fluid Mech. 624, 281–291. Yum, K.D., So, J.K., Sok, K.K., Song, W.O., 2003. Nonlinear characteristics along the Uldolmok Strait off the southwestern tip of the Korean peninsula. Ocean Polar Res. 25 (1), 89–106. M.H. Nguyen et al.