Upgrade to Pro
— share decks privately, control downloads, hide ads and more …
Speaker Deck
Features
Speaker Deck
PRO
Sign in
Sign up for free
Search
Search
PostgreSQL at low level: stay curious!
Search
Sponsored
·
SiteGround - Reliable hosting with speed, security, and support you can count on.
→
Dmitry Dolgov
September 26, 2019
Technology
44
0
Share
Embed
Copy iframe code
Copy JS code
Copy link
Start on current slide
PostgreSQL at low level: stay curious!
Dmitry Dolgov
September 26, 2019
More Decks by Dmitry Dolgov
See All by Dmitry Dolgov
presentation.pdf
erthalion
0
110
PostgreSQL + Linux Kernel = Friendship
erthalion
0
130
NoSQL best practices for PostgreSQL
erthalion
1
520
Other Decks in Technology
See All in Technology
AIペネトレーションテスト・ セキュリティ検証「AgenticSec」紹介資料
laysakura
2
7.7k
5分でわかる Amazon Connect_20260608
hwangbyeonghun
0
140
本当の”仕事”を手放せる未来が見えた
mu7889yoon
0
200
product engineering with qa
nealle
0
100
『AIに負けない』より『AIと遊ぶ』」〜ワクワクが最強のテスト・QA学習戦略_公開用
odan611
1
200
AI Agentをシステムに組み込む前にゆるく向き合ってみる
hayama17
0
180
toB プロダクトから見たWAF
tokai235
0
260
AWS Security Hub CSPMの成功・失敗体験
cmusudakeisuke
0
610
認証認可だけじゃない! ID管理の構成要素と ライフサイクルを意識しよう
ritou
1
360
週末にループ・エンジニアリングの理解を深めるためのスライド
nagatsu
0
690
水を運ぶ人としてのリーダーシップ
izumii19
4
1.1k
AWS Summit の片隅で、体育座りしながらコミュニティがにぎわう理由を考えた
k_adachi_01
2
300
Featured
See All Featured
WENDY [Excerpt]
tessaabrams
11
38k
It's Worth the Effort
3n
188
29k
Save Time (by Creating Custom Rails Generators)
garrettdimon
PRO
32
3.6k
JavaScript: Past, Present, and Future - NDC Porto 2020
reverentgeek
52
6k
Building Experiences: Design Systems, User Experience, and Full Site Editing
marktimemedia
0
540
[SF Ruby Conf 2025] Rails X
palkan
2
1.1k
Building AI with AI
inesmontani
PRO
1
1.1k
What the history of the web can teach us about the future of AI
inesmontani
PRO
1
620
Bash Introduction
62gerente
615
220k
Become a Pro
speakerdeck
PRO
31
6k
コードの90%をAIが書く世界で何が待っているのか / What awaits us in a world where 90% of the code is written by AI
rkaga
62
44k
ラッコキーワード サービス紹介資料
rakko
1
3.8M
Transcript
POSTGRESQL AT LOW LEVEL STAY CURIOUS! DMITRY DOLGOV 26-09-2019
patroni & postgres-operator 1
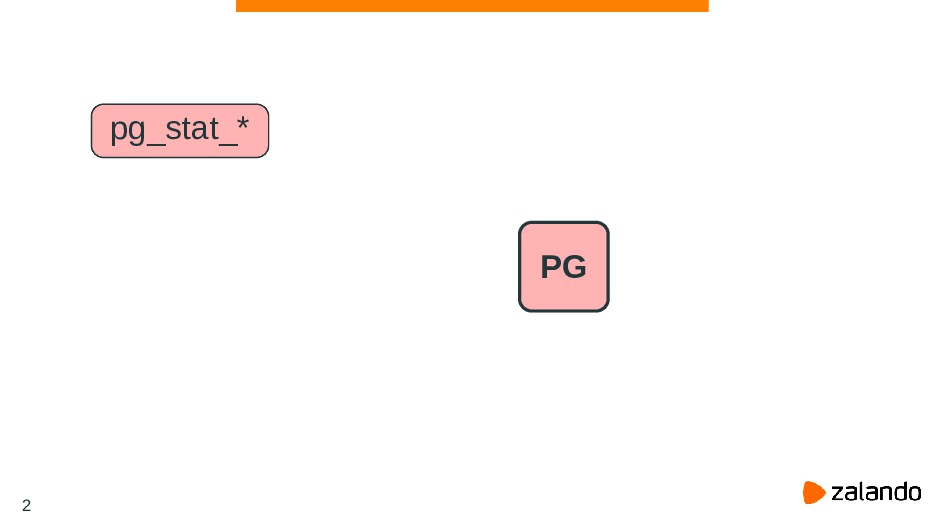
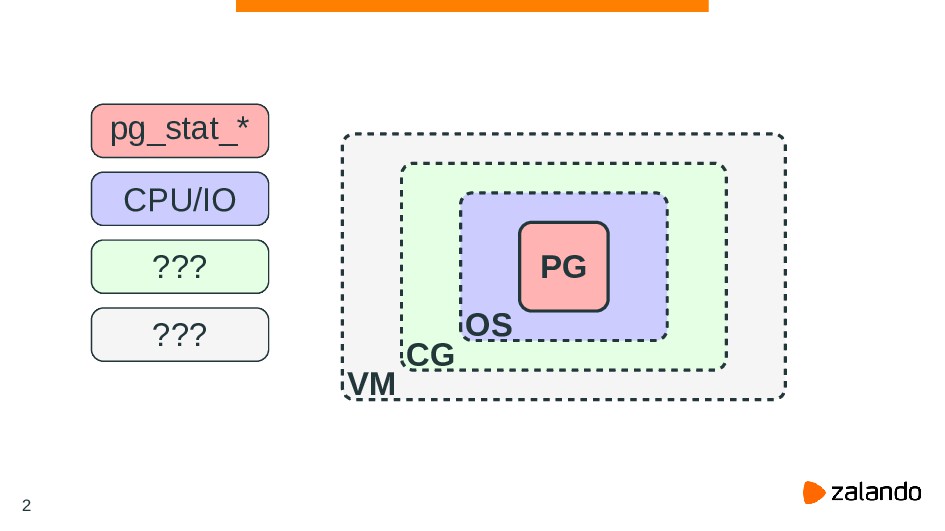
K8S PG pg_stat_* 2
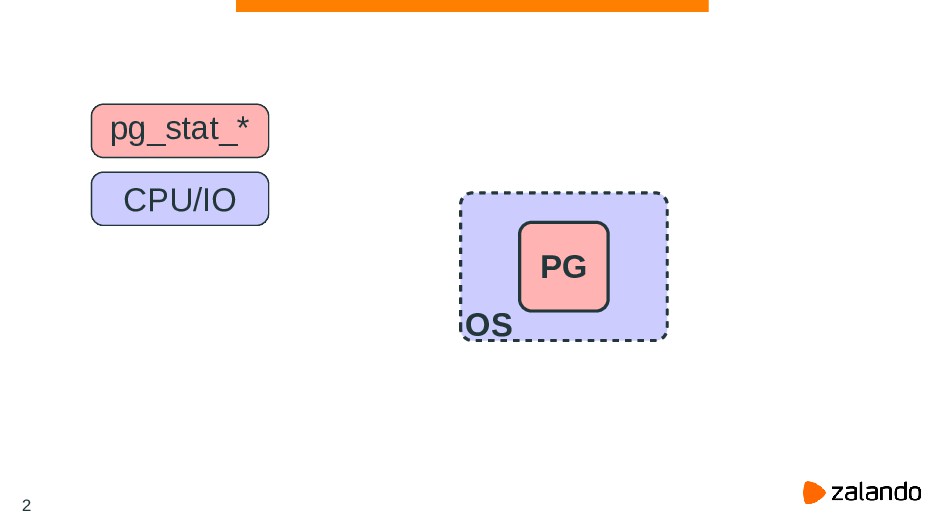
K8S OS PG pg_stat_* CPU/IO 2
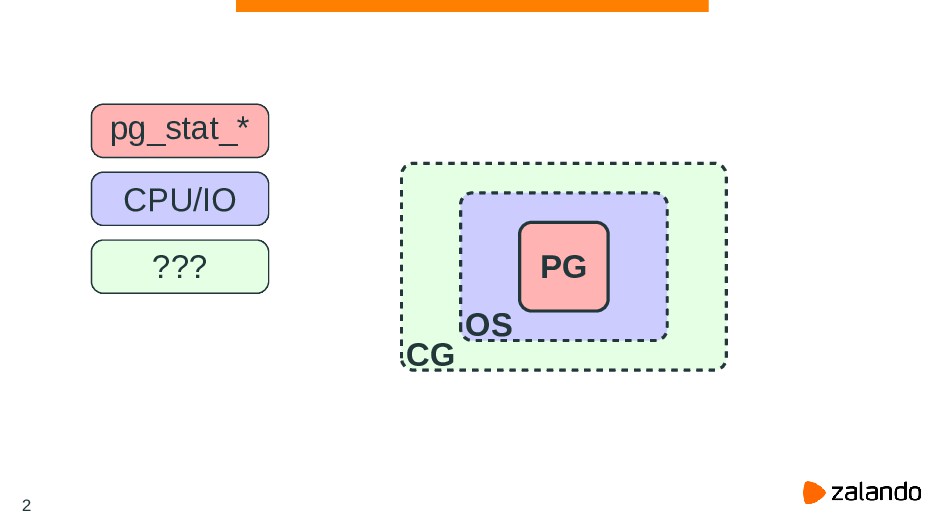
K8S CG OS PG pg_stat_* CPU/IO ??? 2
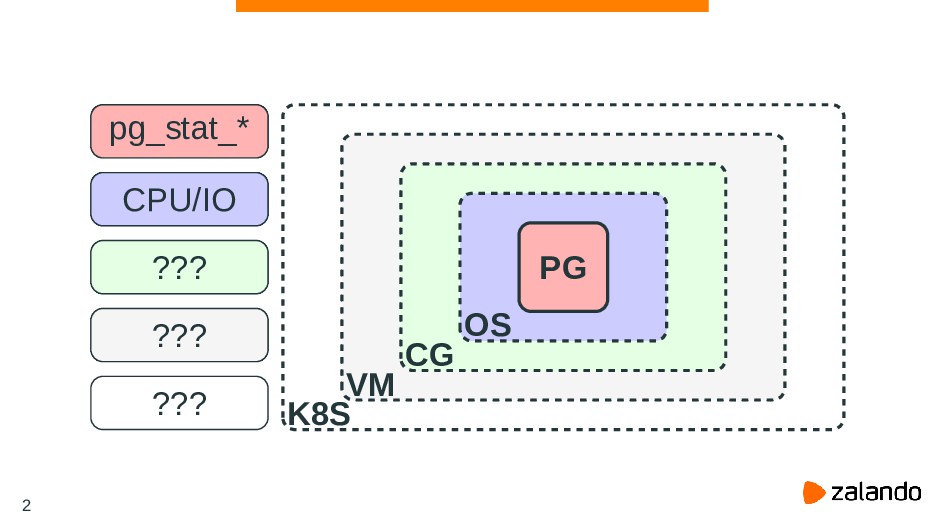
K8S VM CG OS PG pg_stat_* CPU/IO ??? ??? 2
K8S VM CG OS PG pg_stat_* CPU/IO ??? ??? ???
2
3
Plan? 4
A bit chaotic dailymail.co.uk 4
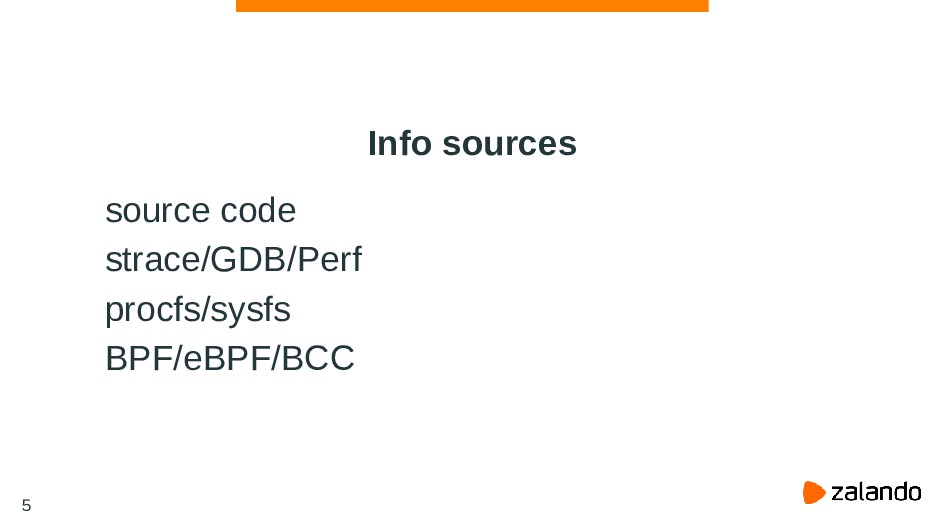
Info sources source code strace/GDB/Perf procfs/sysfs BPF/eBPF/BCC 5
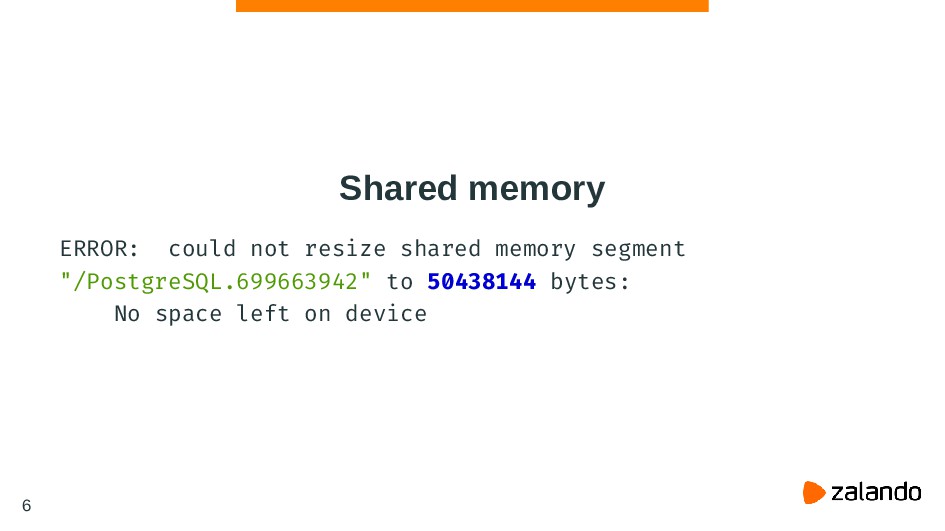
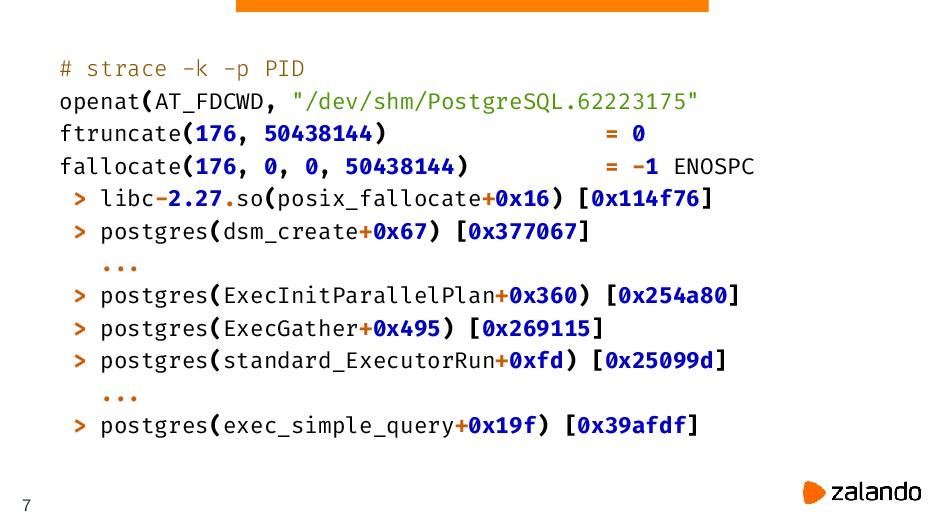
Shared memory ERROR: could not resize shared memory segment "/PostgreSQL.699663942"
to 50438144 bytes: No space left on device 6
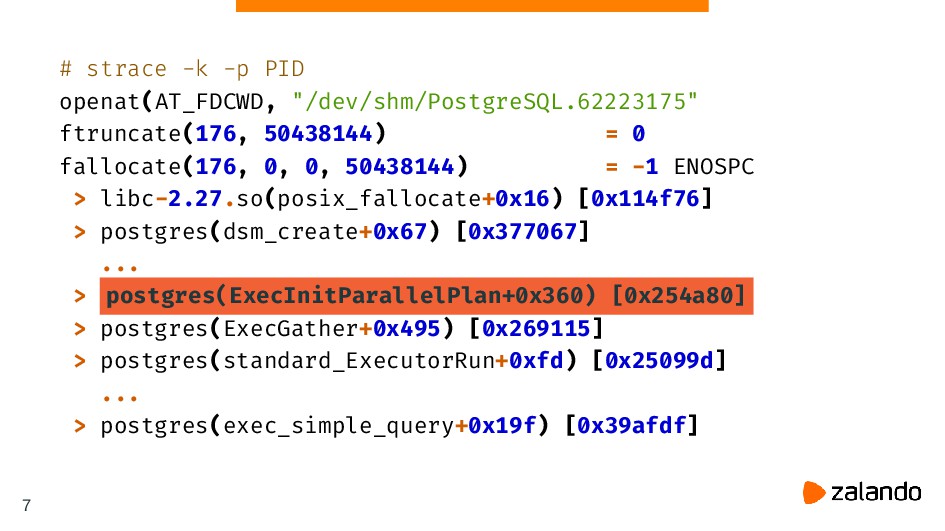
# strace -k -p PID openat(AT_FDCWD, "/dev/shm/PostgreSQL.62223175" ftruncate(176, 50438144) =
0 fallocate(176, 0, 0, 50438144) = -1 ENOSPC > libc-2.27.so(posix_fallocate+0x16) [0x114f76] > postgres(dsm_create+0x67) [0x377067] ... > postgres(ExecInitParallelPlan+0x360) [0x254a80] > postgres(ExecGather+0x495) [0x269115] > postgres(standard_ExecutorRun+0xfd) [0x25099d] ... > postgres(exec_simple_query+0x19f) [0x39afdf] 7
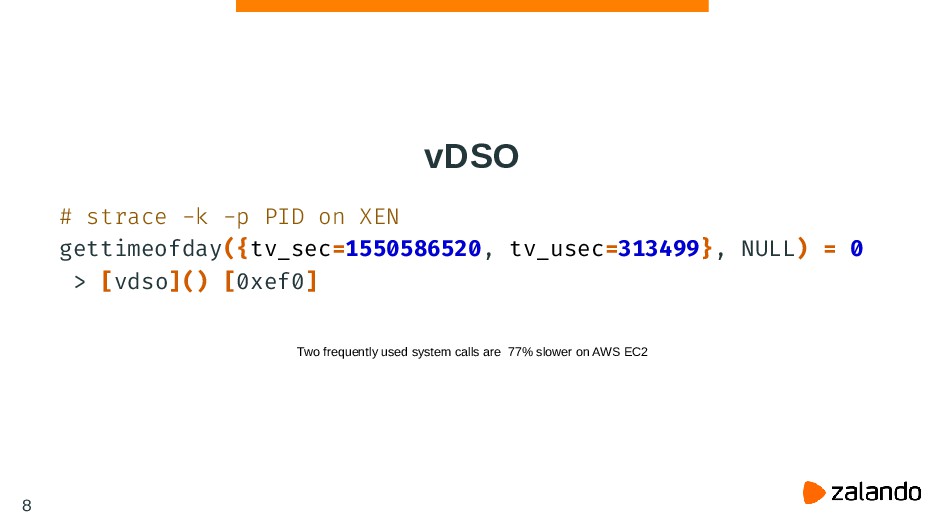
vDSO # strace -k -p PID on XEN gettimeofday({tv_sec=1550586520, tv_usec=313499},
NULL) = 0 > [vdso]() [0xef0] Two frequently used system calls are 77% slower on AWS EC2 8
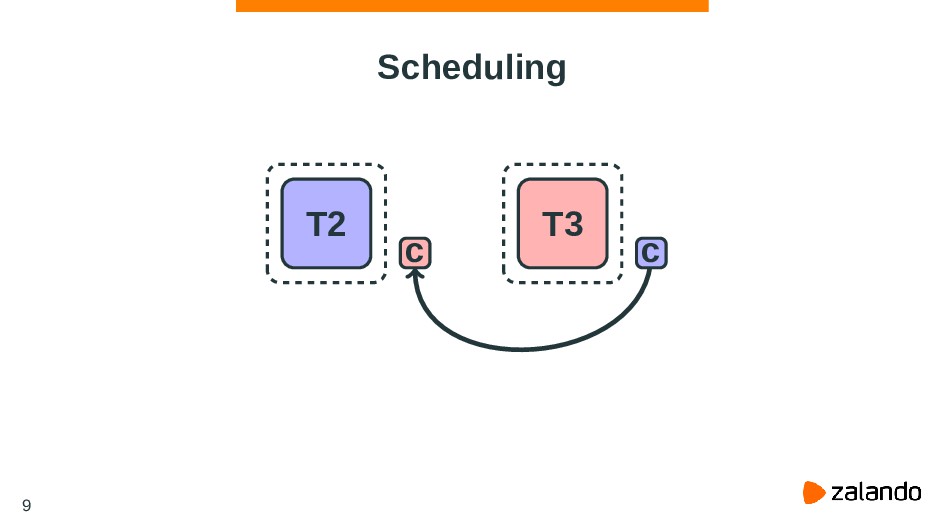
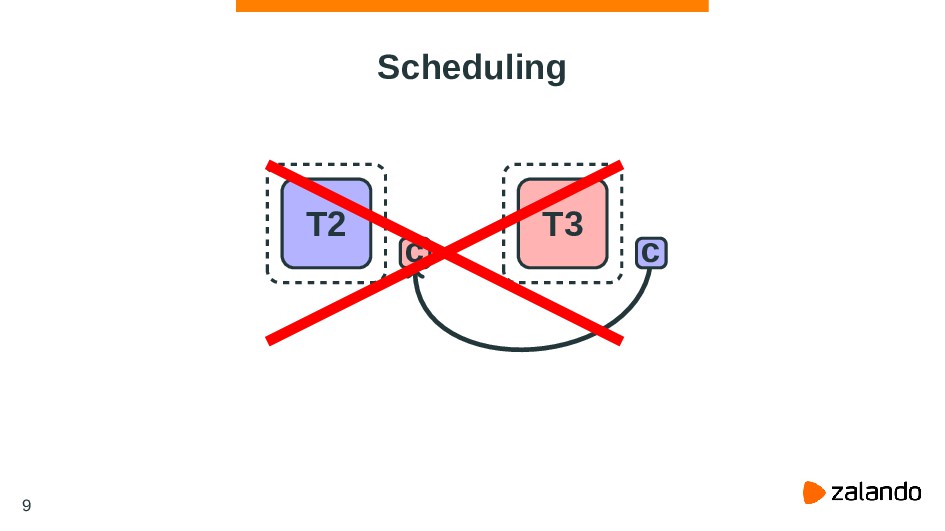
Scheduling T2 c T3 c 9
Scheduling T2 c T3 c 9
Andres Freund: New intel MDS vulnerability mitigations cause measurable slowdown
10
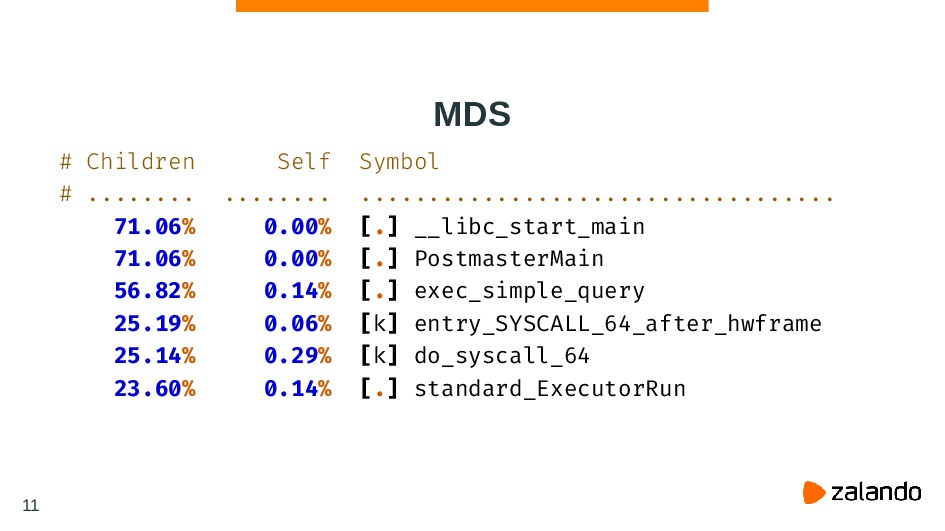
MDS # Children Self Symbol # ........ ........ ................................... 71.06%
0.00% [.] __libc_start_main 71.06% 0.00% [.] PostmasterMain 56.82% 0.14% [.] exec_simple_query 25.19% 0.06% [k] entry_SYSCALL_64_after_hwframe 25.14% 0.29% [k] do_syscall_64 23.60% 0.14% [.] standard_ExecutorRun 11
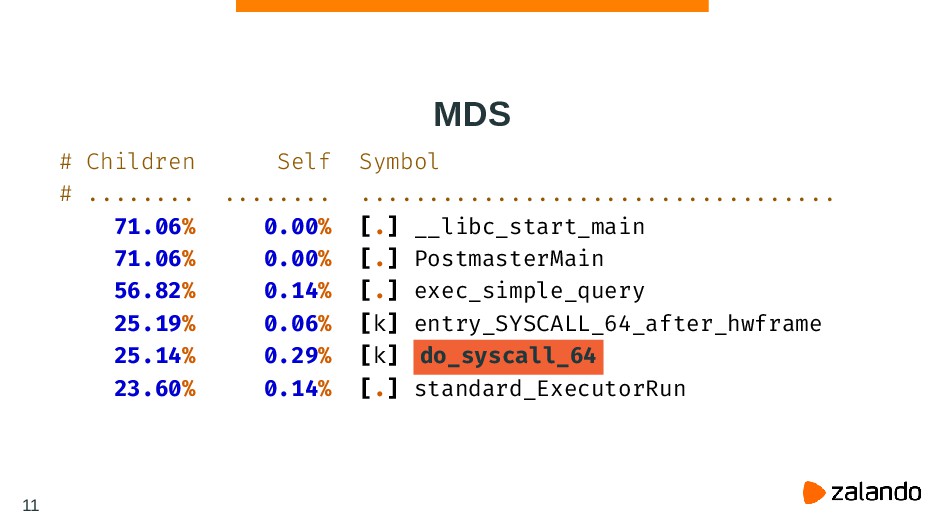
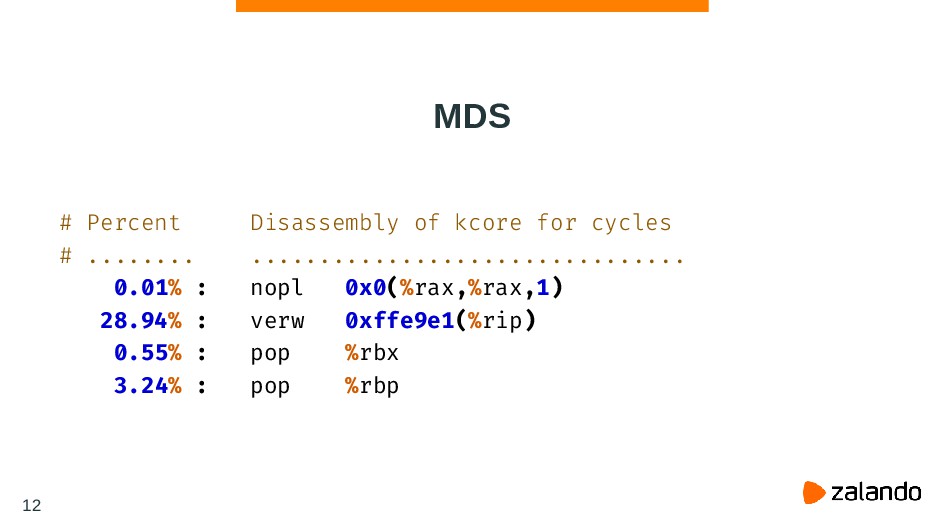
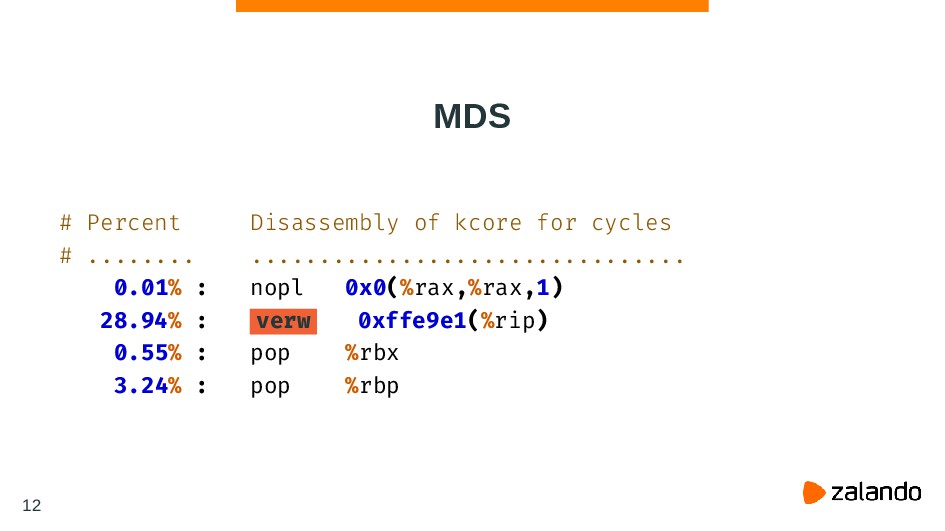
MDS # Percent Disassembly of kcore for cycles # ........
................................ 0.01% : nopl 0x0(%rax,%rax,1) 28.94% : verw 0xffe9e1(%rip) 0.55% : pop %rbx 3.24% : pop %rbp 12
MDS # Percent Disassembly of kcore for cycles # ........
................................ 0.01% : nopl 0x0(%rax,%rax,1) 28.94% : verw 0xffe9e1(%rip) 0.55% : pop %rbx 3.24% : pop %rbp 12
MDS # Overhead Symbol # ........ ................................... 25.19% [k] native_safe_halt
13
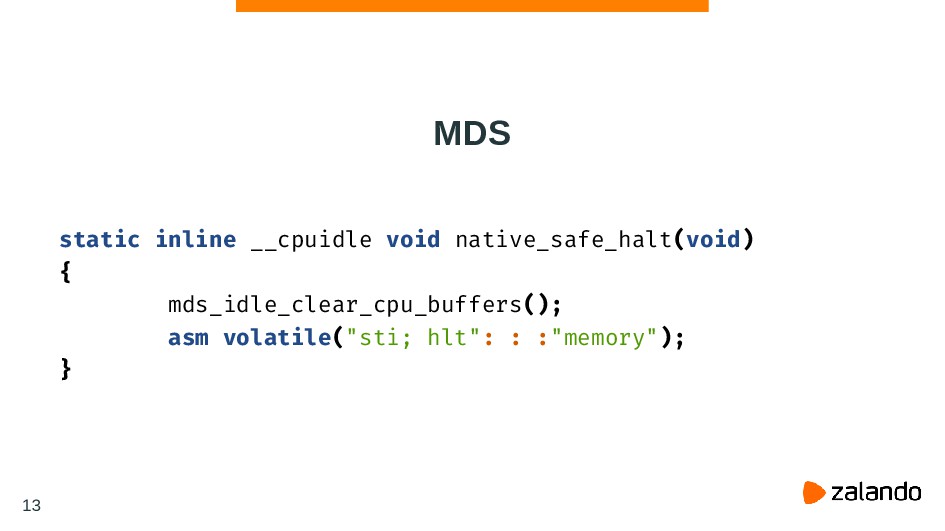
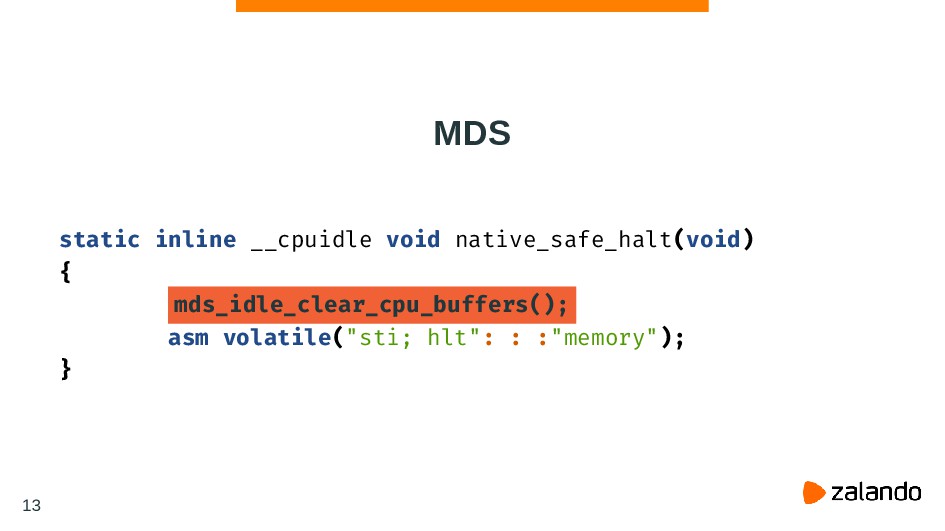
MDS static inline __cpuidle void native_safe_halt(void) { mds_idle_clear_cpu_buffers(); asm volatile("sti;
hlt": : :"memory"); } 13
MDS static inline __cpuidle void native_safe_halt(void) { mds_idle_clear_cpu_buffers(); asm volatile("sti;
hlt": : :"memory"); } 13
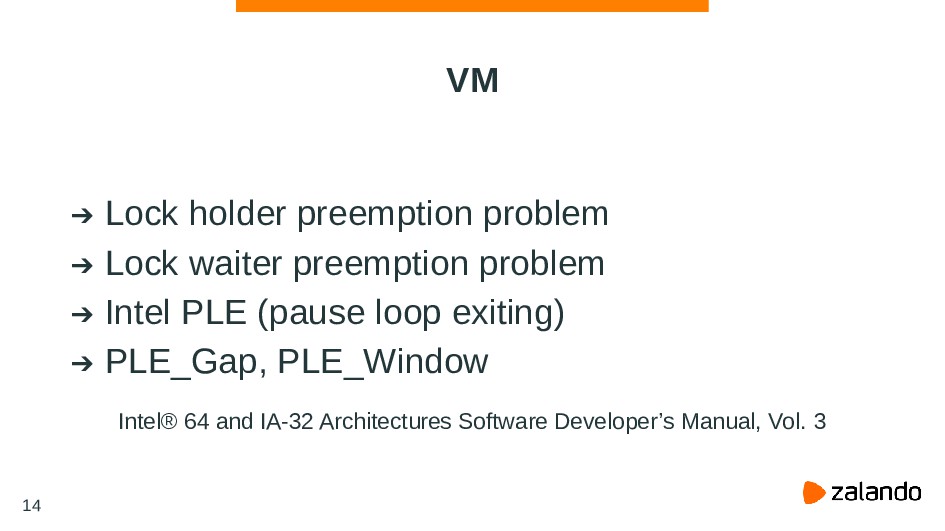
VM Lock holder preemption problem Lock waiter preemption problem Intel
PLE (pause loop exiting) PLE_Gap, PLE_Window Intel® 64 and IA-32 Architectures Software Developer’s Manual, Vol. 3 14
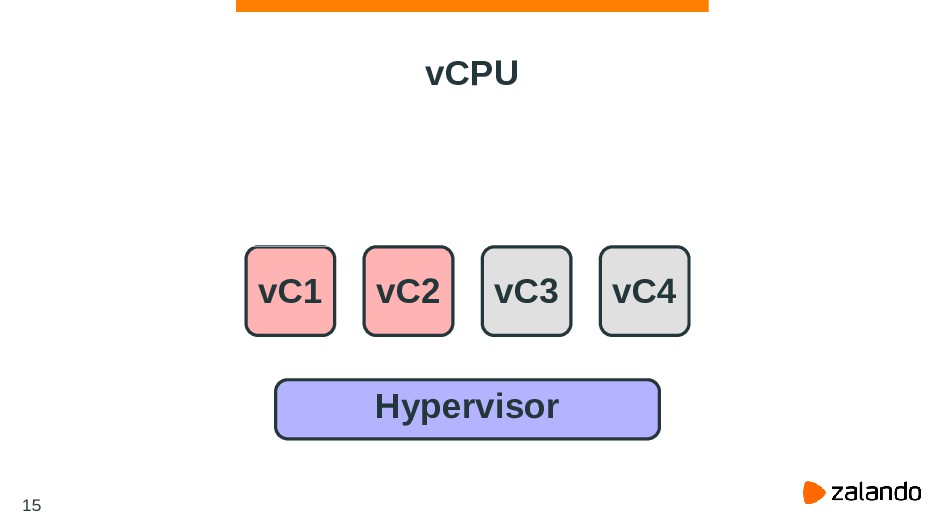
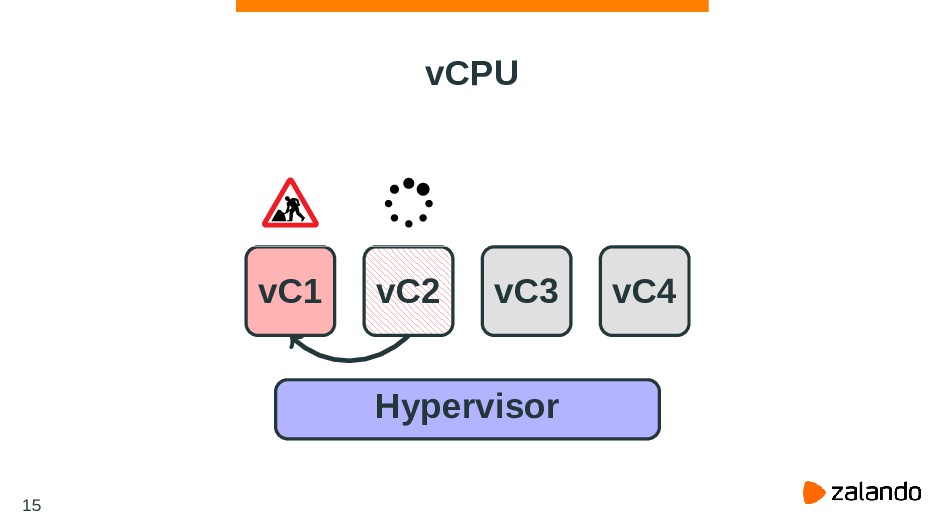
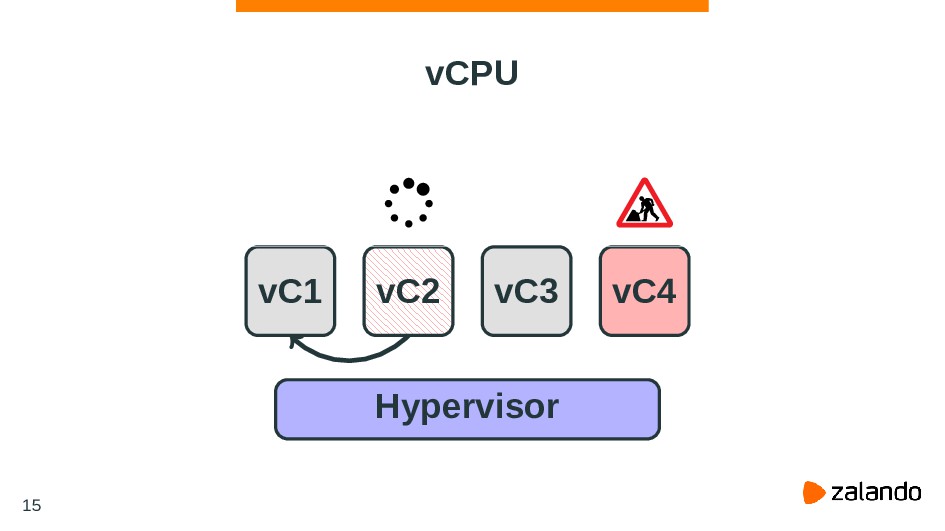
vCPU Hypervisor vC1 vC2 vC3 vC4 15
vCPU Hypervisor vC1 vC2 vC3 vC4 15
vCPU Hypervisor vC1 vC2 vC3 vC4 15
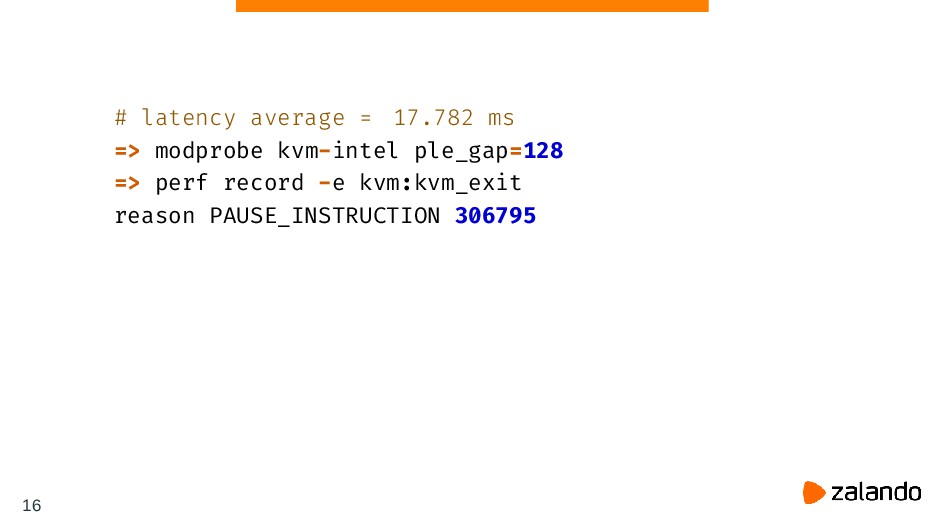
# latency average = 17.782 ms => modprobe kvm-intel ple_gap=128
=> perf record -e kvm:kvm_exit reason PAUSE_INSTRUCTION 306795 16
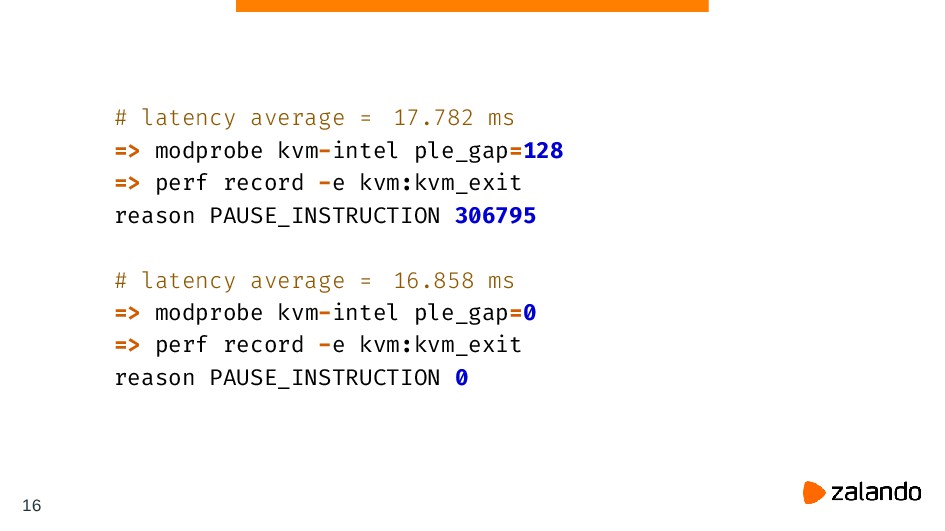
# latency average = 17.782 ms => modprobe kvm-intel ple_gap=128
=> perf record -e kvm:kvm_exit reason PAUSE_INSTRUCTION 306795 # latency average = 16.858 ms => modprobe kvm-intel ple_gap=0 => perf record -e kvm:kvm_exit reason PAUSE_INSTRUCTION 0 16
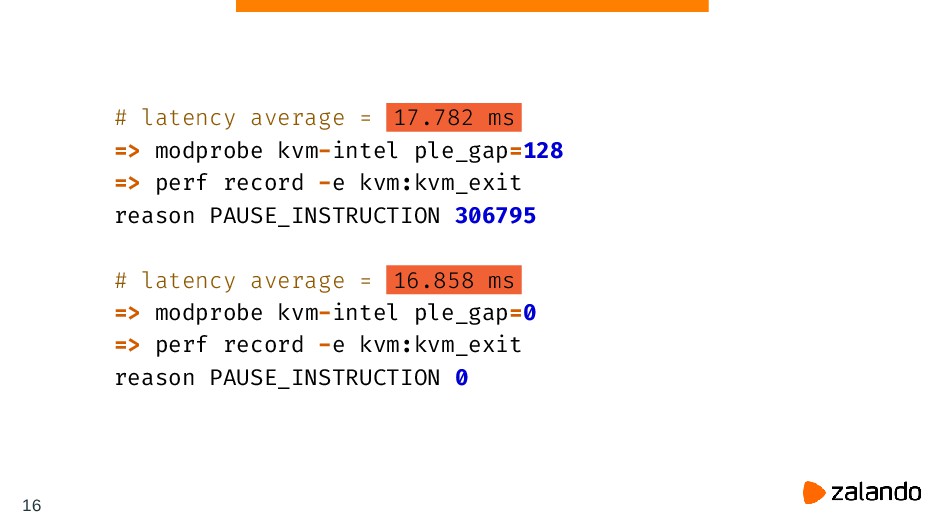
# latency average = 17.782 ms => modprobe kvm-intel ple_gap=128
=> perf record -e kvm:kvm_exit reason PAUSE_INSTRUCTION 306795 # latency average = 16.858 ms => modprobe kvm-intel ple_gap=0 => perf record -e kvm:kvm_exit reason PAUSE_INSTRUCTION 0 16
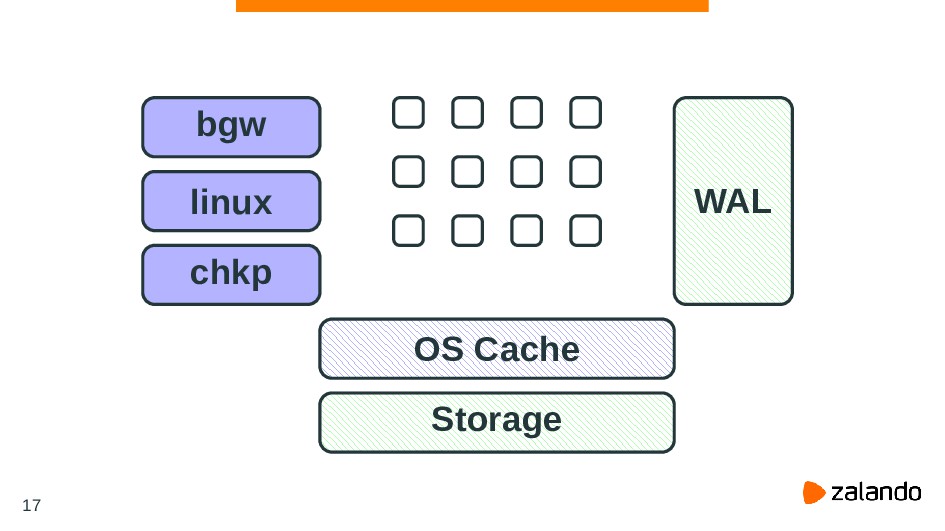
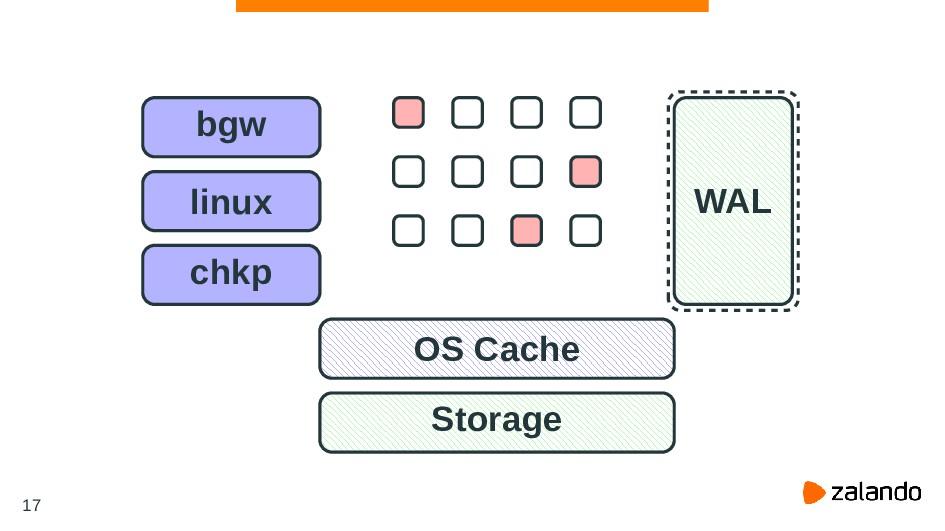
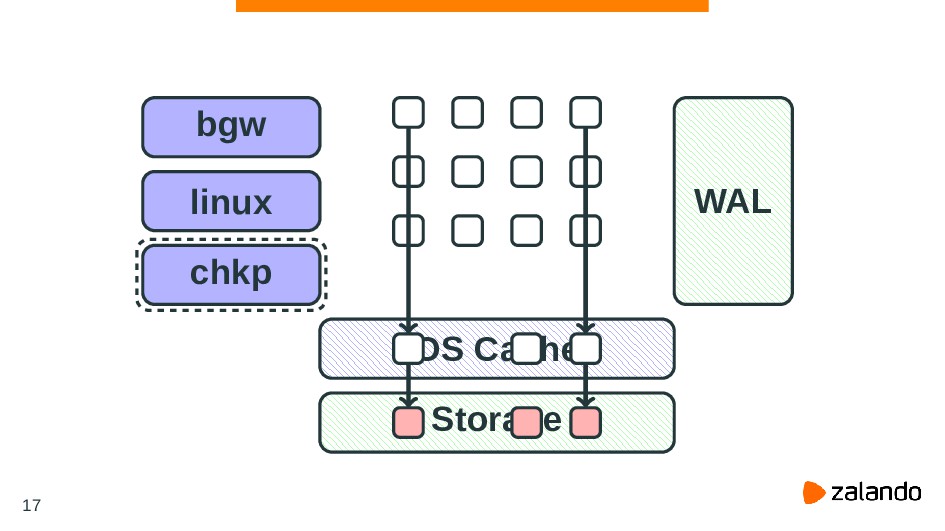
OS Cache Storage WAL bgw linux chkp 17
OS Cache Storage WAL bgw linux chkp 17
OS Cache Storage WAL bgw linux chkp 17
OS Cache Storage WAL bgw linux chkp 17
OS Cache Storage WAL bgw linux chkp 17
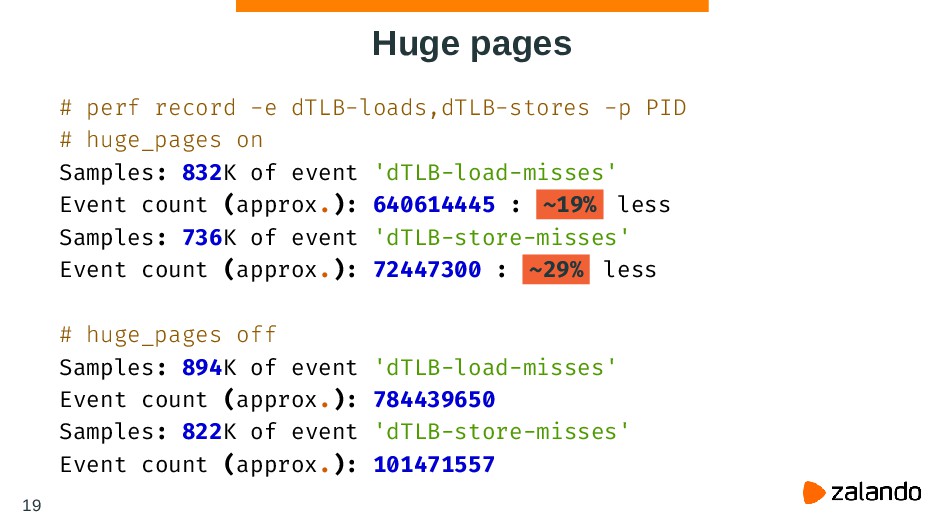
Huge pages transparent vs classic TLB misses are faster and
less frequent 18
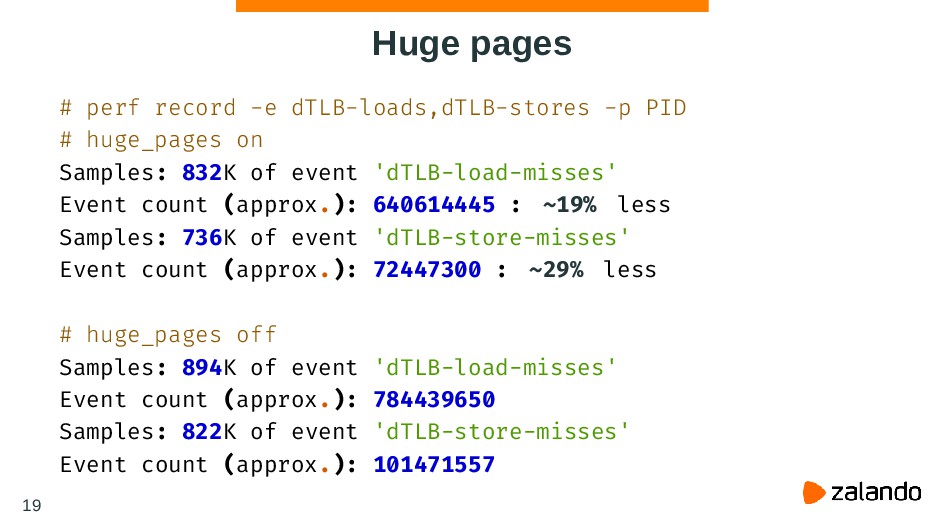
Huge pages # perf record -e dTLB-loads,dTLB-stores -p PID #
huge_pages on Samples: 832K of event 'dTLB-load-misses' Event count (approx.): 640614445 : ~19% less Samples: 736K of event 'dTLB-store-misses' Event count (approx.): 72447300 : ~29% less # huge_pages off Samples: 894K of event 'dTLB-load-misses' Event count (approx.): 784439650 Samples: 822K of event 'dTLB-store-misses' Event count (approx.): 101471557 19
20
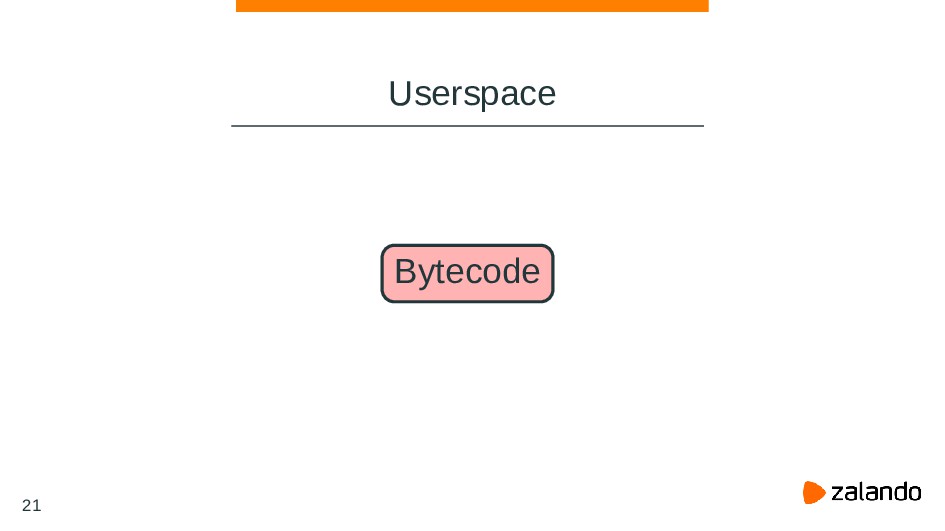
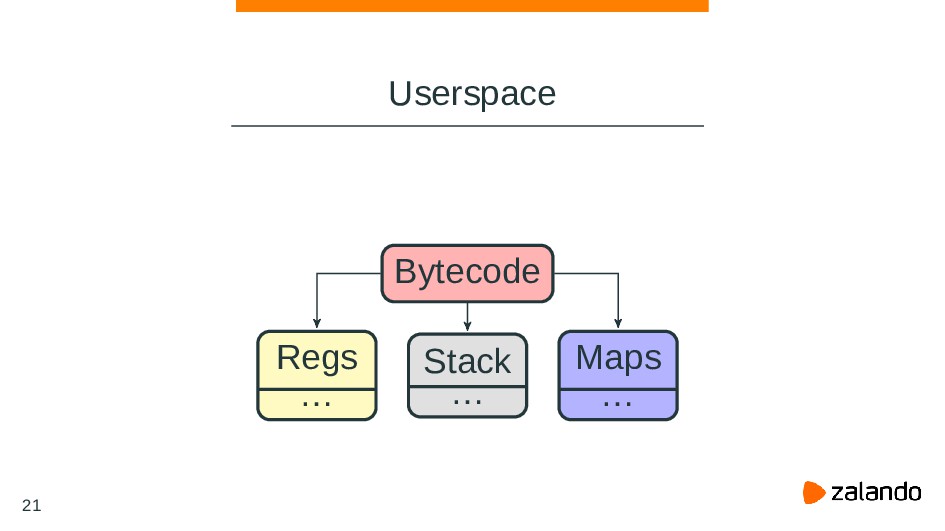
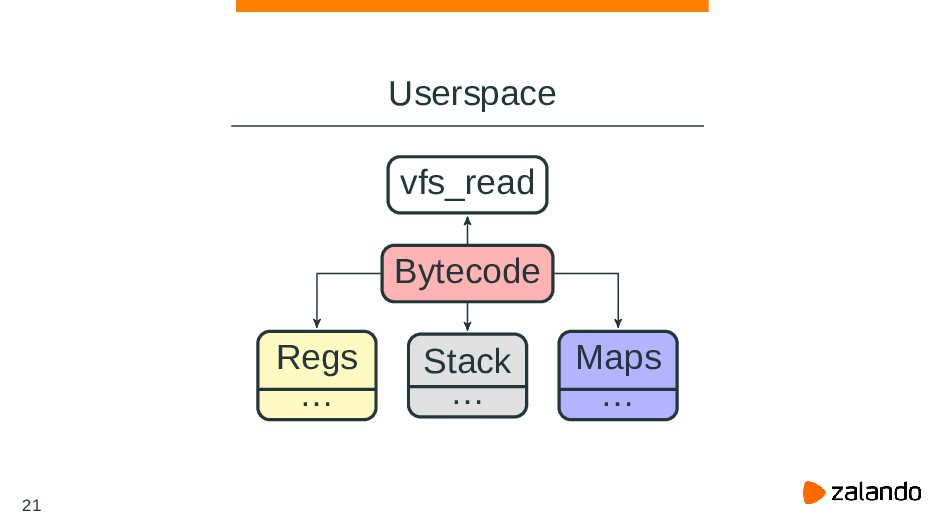
Userspace Bytecode vfs_read Stack … Regs … Maps … 21
Userspace Bytecode vfs_read Stack … Regs … Maps … 21
Userspace Bytecode vfs_read Stack … Regs … Maps … 21
github.com/iovisor/bcc/ github.com/erthalion/postgres-bcc 22
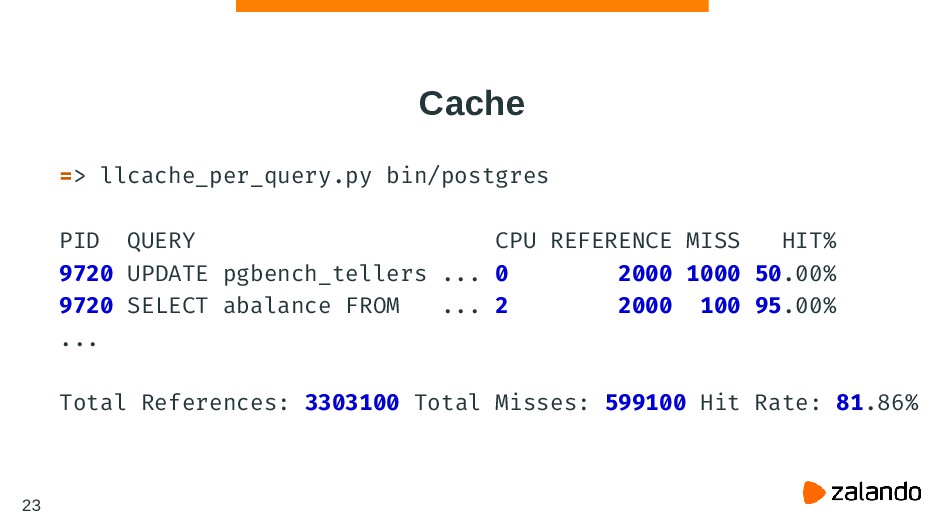
Cache => llcache_per_query.py bin/postgres PID QUERY CPU REFERENCE MISS HIT%
9720 UPDATE pgbench_tellers ... 0 2000 1000 50.00% 9720 SELECT abalance FROM ... 2 2000 100 95.00% ... Total References: 3303100 Total Misses: 599100 Hit Rate: 81.86% 23
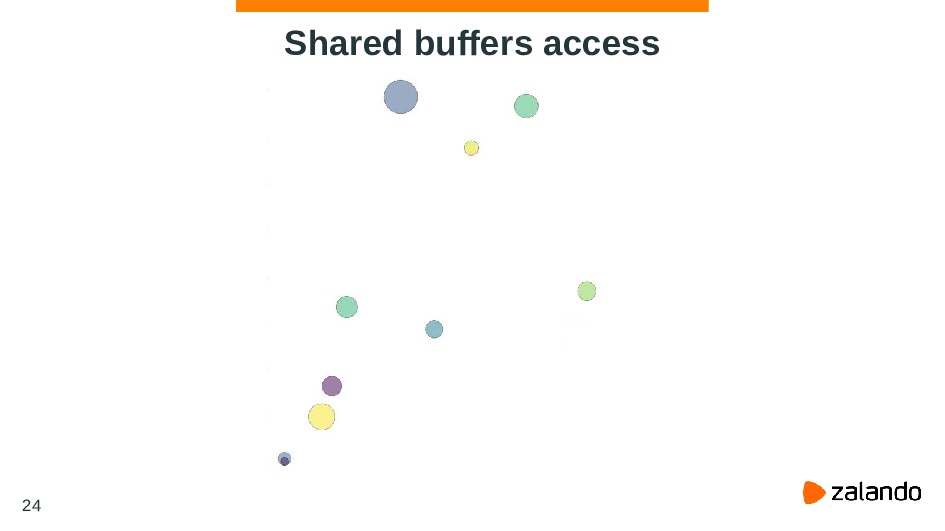
Shared buffers access 24
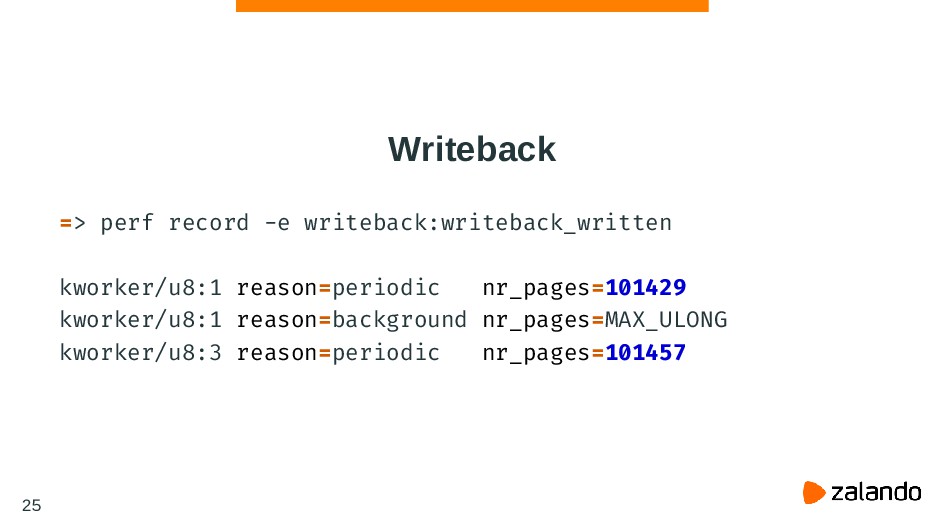
Writeback => perf record -e writeback:writeback_written kworker/u8:1 reason=periodic nr_pages=101429 kworker/u8:1
reason=background nr_pages=MAX_ULONG kworker/u8:3 reason=periodic nr_pages=101457 25
Writeback # pgbench insert workload => io_timeouts.py bin/postgres [18335] END:
MAX_SCHEDULE_TIMEOUT [18333] END: MAX_SCHEDULE_TIMEOUT [18331] END: MAX_SCHEDULE_TIMEOUT [18318] truncate pgbench_history: MAX_SCHEDULE_TIMEOUT 26
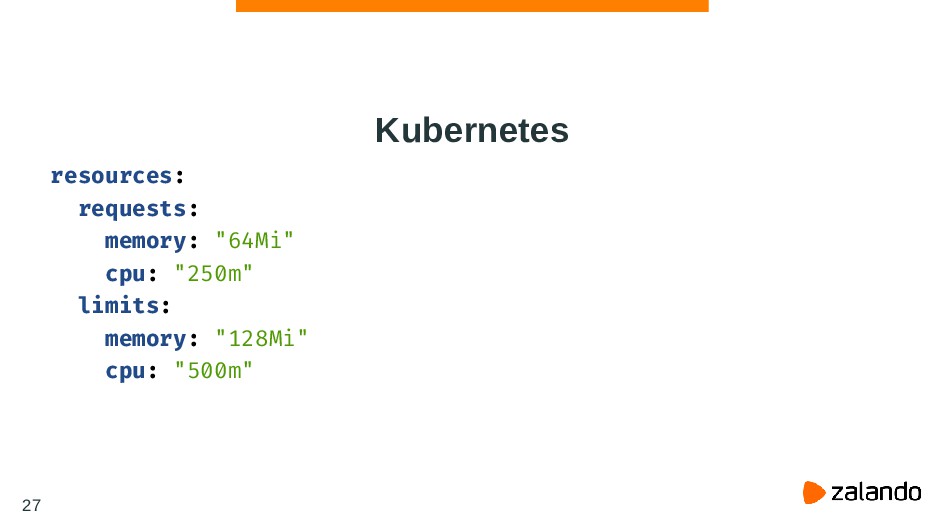
Kubernetes resources: requests: memory: "64Mi" cpu: "250m" limits: memory: "128Mi"
cpu: "500m" 27
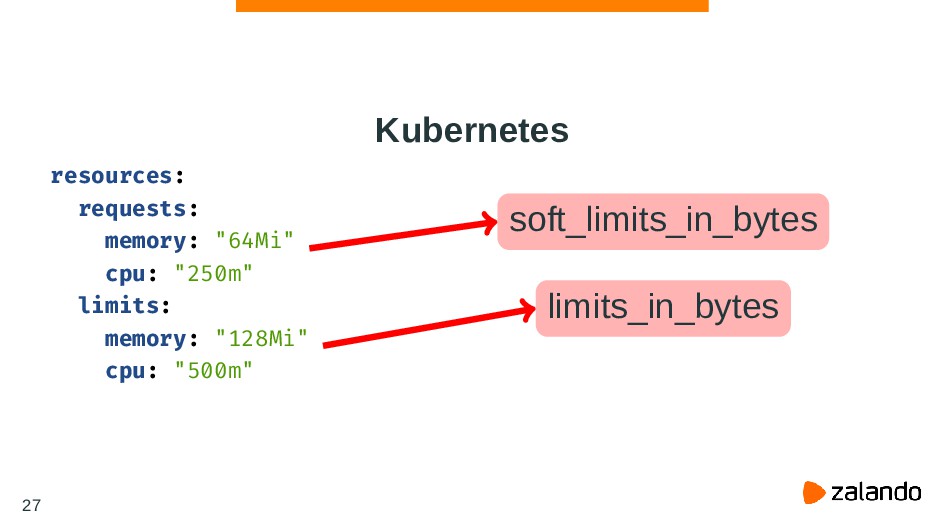
Kubernetes resources: requests: memory: "64Mi" cpu: "250m" limits: memory: "128Mi"
cpu: "500m" soft_limits_in_bytes limits_in_bytes 27
28
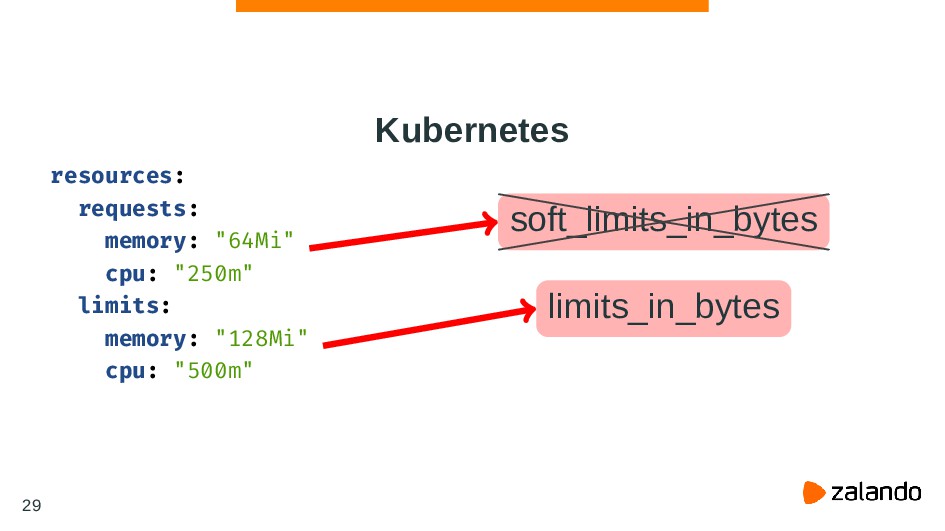
Kubernetes resources: requests: memory: "64Mi" cpu: "250m" limits: memory: "128Mi"
cpu: "500m" soft_limits_in_bytes limits_in_bytes 29
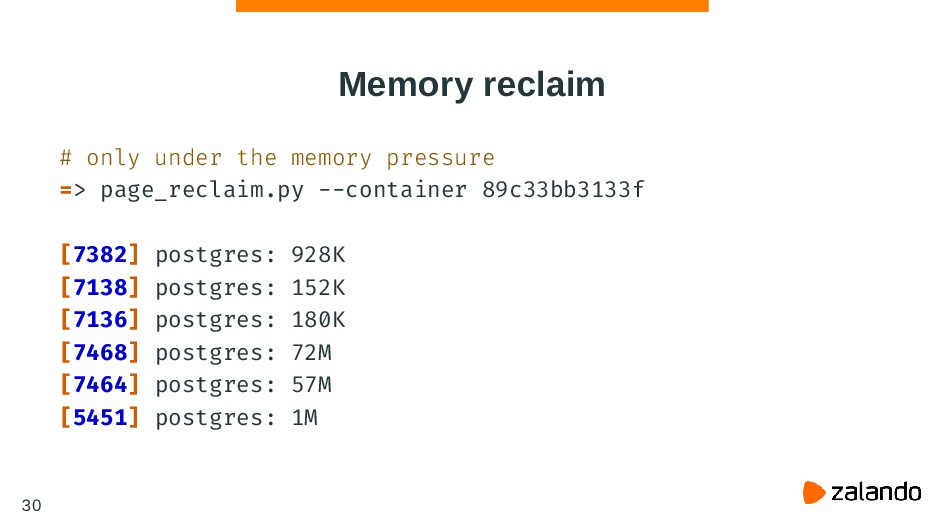
Memory reclaim # only under the memory pressure => page_reclaim.py
--container 89c33bb3133f [7382] postgres: 928K [7138] postgres: 152K [7136] postgres: 180K [7468] postgres: 72M [7464] postgres: 57M [5451] postgres: 1M 30
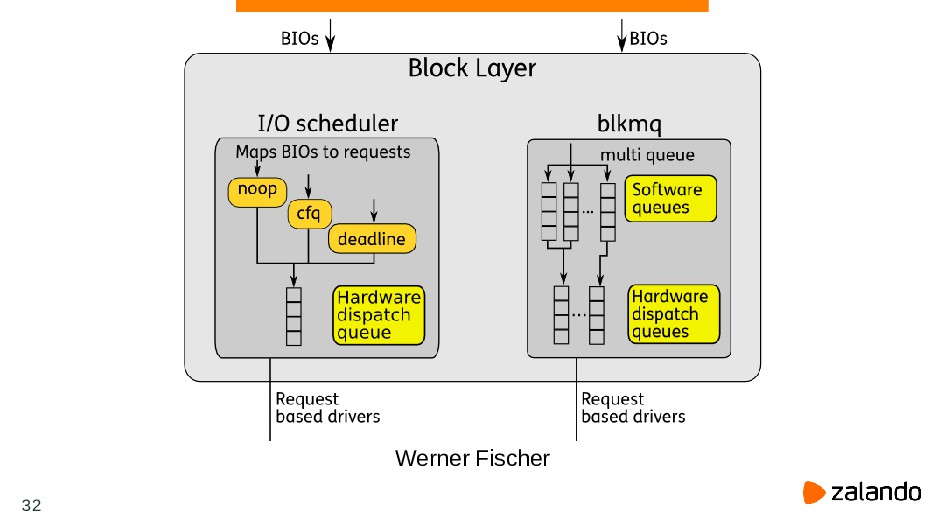
IO scheduler => cat /sys/block/xvdcj/queue/scheduler [mq-deadline] kyber bfq none 31
Werner Fischer 32
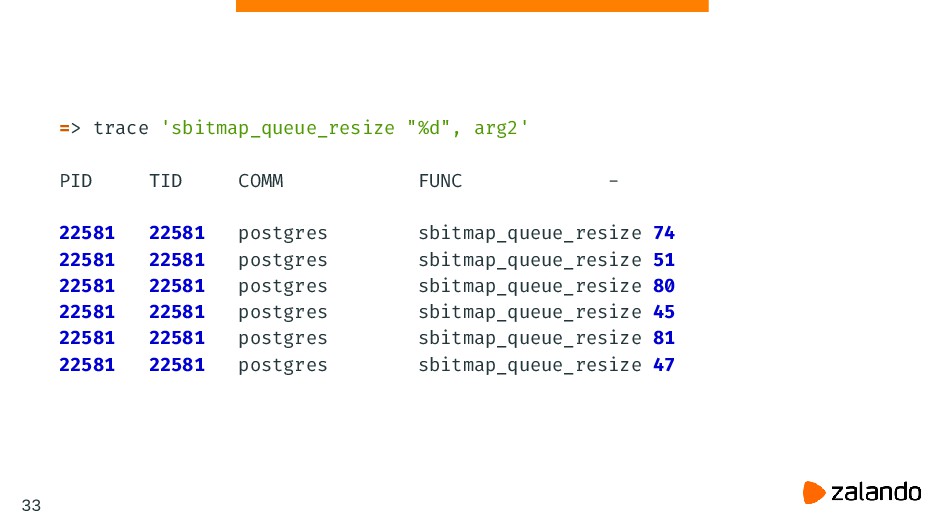
=> trace 'sbitmap_queue_resize "%d", arg2' PID TID COMM FUNC -
22581 22581 postgres sbitmap_queue_resize 74 22581 22581 postgres sbitmap_queue_resize 51 22581 22581 postgres sbitmap_queue_resize 80 22581 22581 postgres sbitmap_queue_resize 45 22581 22581 postgres sbitmap_queue_resize 81 22581 22581 postgres sbitmap_queue_resize 47 33
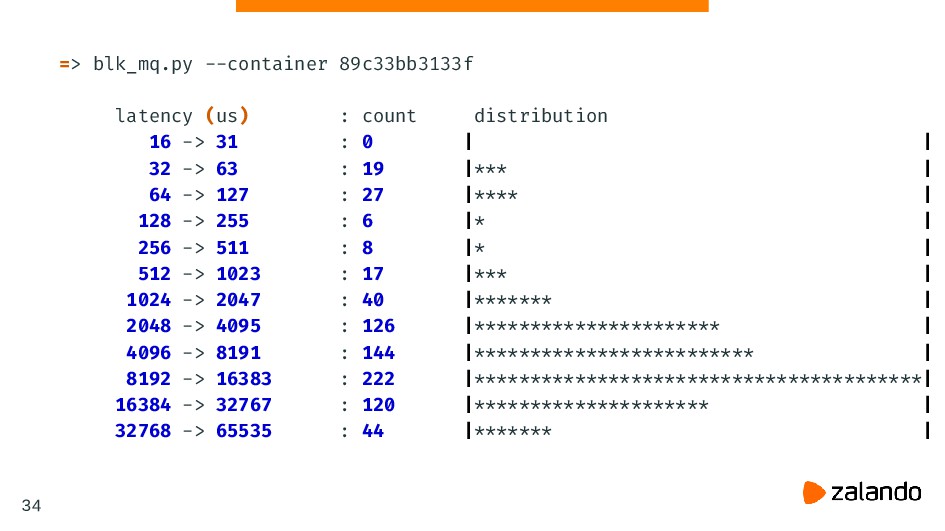
=> blk_mq.py --container 89c33bb3133f latency (us) : count distribution 16
-> 31 : 0 | | 32 -> 63 : 19 |*** | 64 -> 127 : 27 |**** | 128 -> 255 : 6 |* | 256 -> 511 : 8 |* | 512 -> 1023 : 17 |*** | 1024 -> 2047 : 40 |******* | 2048 -> 4095 : 126 |********************** | 4096 -> 8191 : 144 |************************* | 8192 -> 16383 : 222 |****************************************| 16384 -> 32767 : 120 |********************* | 32768 -> 65535 : 44 |******* | 34
35
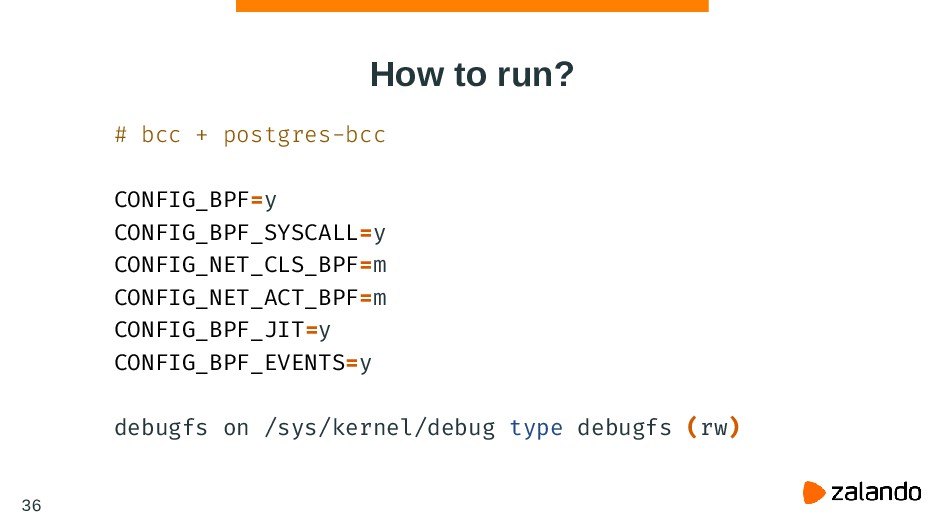
How to run? # bcc + postgres-bcc CONFIG_BPF=y CONFIG_BPF_SYSCALL=y CONFIG_NET_CLS_BPF=m
CONFIG_NET_ACT_BPF=m CONFIG_BPF_JIT=y CONFIG_BPF_EVENTS=y debugfs on /sys/kernel/debug type debugfs (rw) 36
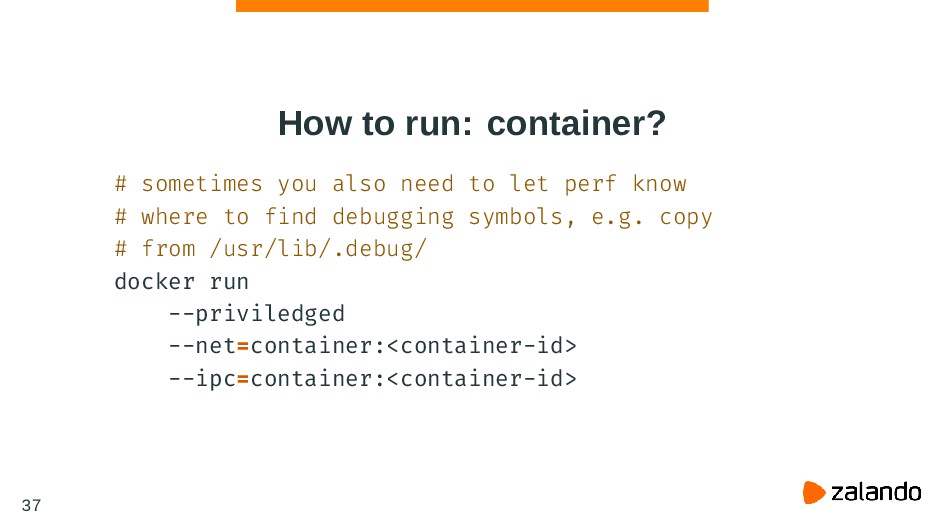
How to run: container? # sometimes you also need to
let perf know # where to find debugging symbols, e.g. copy # from /usr/lib/.debug/ docker run --priviledged --net=container:<container-id> --ipc=container:<container-id> 37
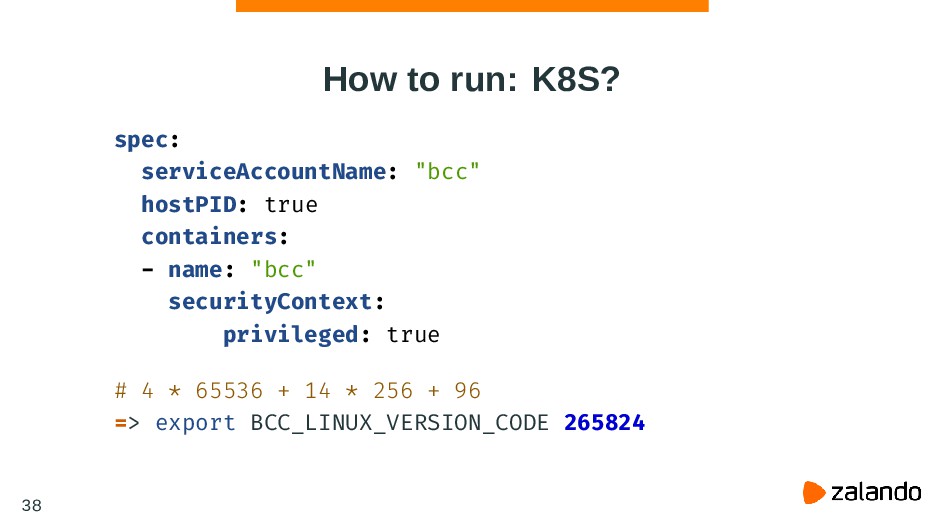
How to run: K8S? spec: serviceAccountName: "bcc" hostPID: true containers:
- name: "bcc" securityContext: privileged: true # 4 * 65536 + 14 * 256 + 96 => export BCC_LINUX_VERSION_CODE 265824 38
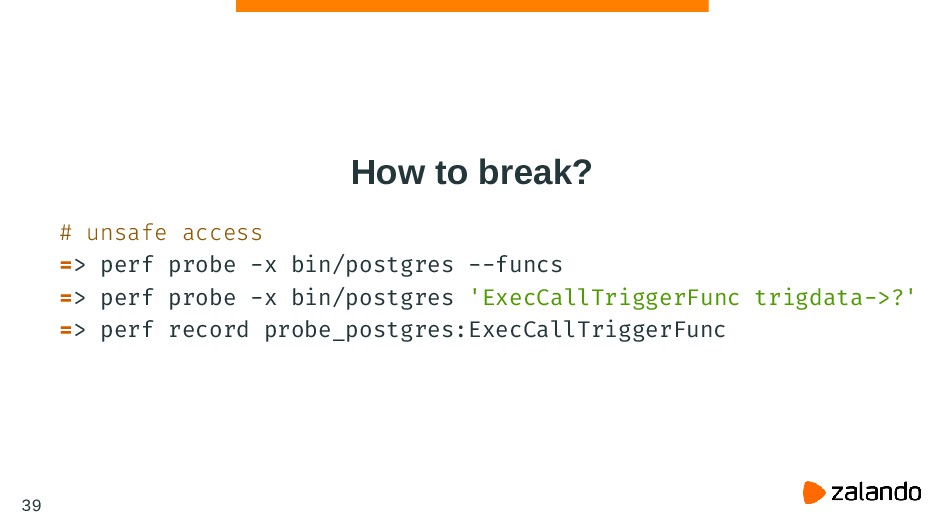
How to break? # unsafe access => perf probe -x
bin/postgres --funcs => perf probe -x bin/postgres 'ExecCallTriggerFunc trigdata->?' => perf record probe_postgres:ExecCallTriggerFunc 39
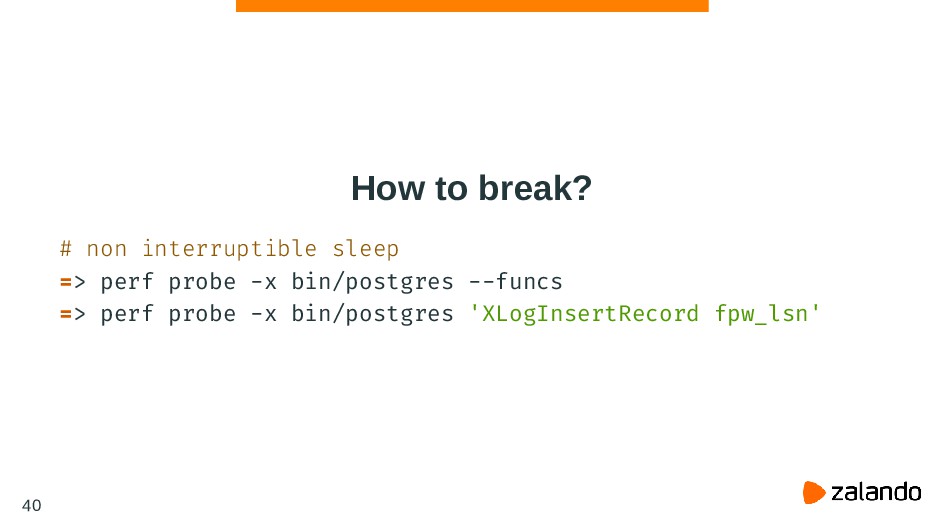
How to break? # non interruptible sleep => perf probe
-x bin/postgres --funcs => perf probe -x bin/postgres 'XLogInsertRecord fpw_lsn' 40
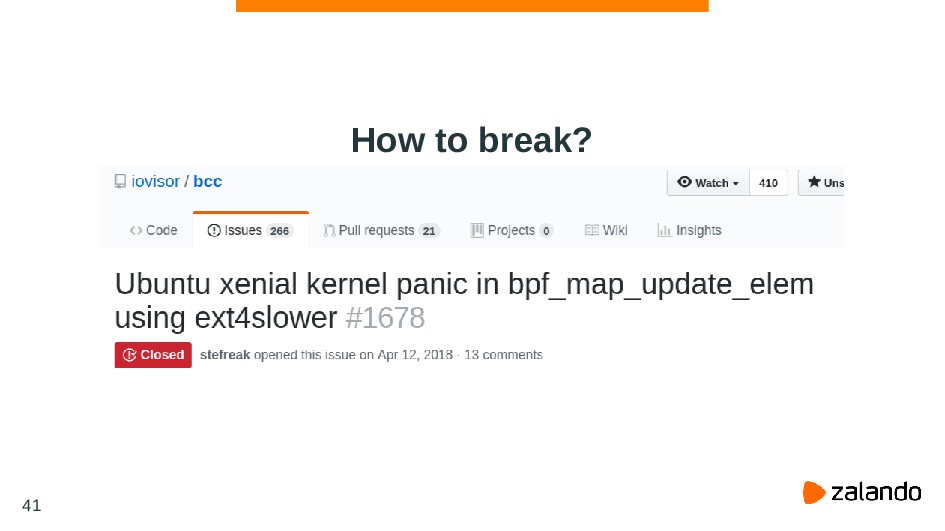
How to break? 41
Questions? github.com/erthalion github.com/erthalion/postgres-bcc @erthalion dmitrii.dolgov at
zalando dot de 9erthalion6 at gmail dot com 42
![MDS # Overhead Symbol # ........ ................................... 25.19% [k] native_safe_halt](https://files.speakerdeck.com/presentations/6f113485233d478693b3e696a6ccfb98/slide_22.jpg)
![Writeback # pgbench insert workload => io_timeouts.py bin/postgres [18335] END:](https://files.speakerdeck.com/presentations/6f113485233d478693b3e696a6ccfb98/slide_48.jpg)
![IO scheduler => cat /sys/block/xvdcj/queue/scheduler [mq-deadline] kyber bfq none 31](https://files.speakerdeck.com/presentations/6f113485233d478693b3e696a6ccfb98/slide_54.jpg)