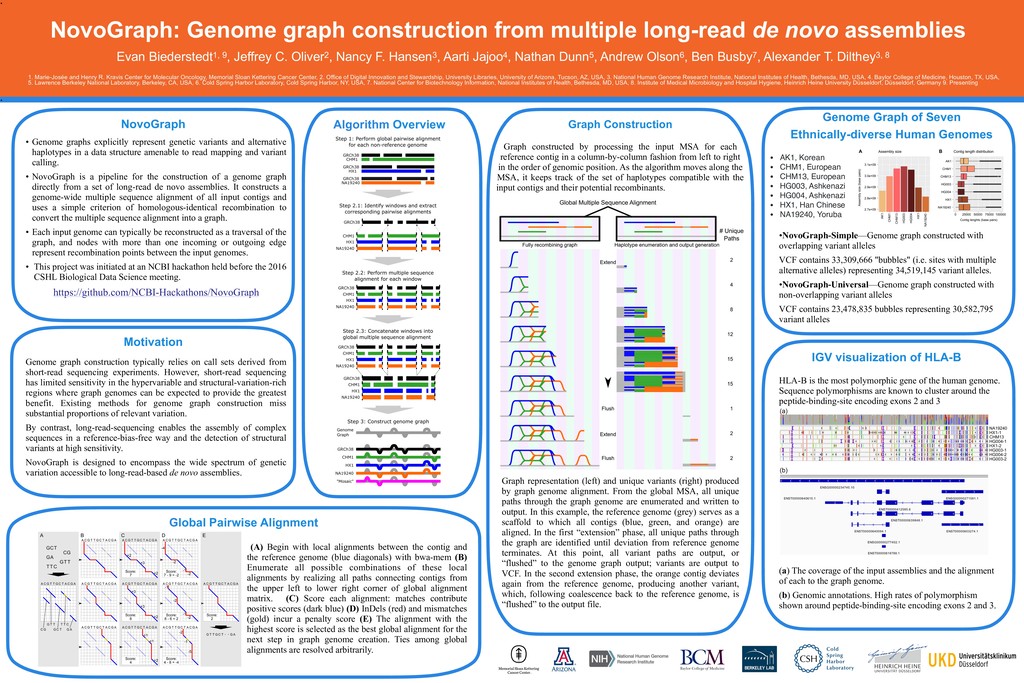
novo assemblies 1. Marie-Josée and Henry R. Kravis Center for Molecular Oncology, Memorial Sloan Kettering Cancer Center, 2. Office of Digital Innovation and Stewardship, University Libraries, University of Arizona, Tucson, AZ, USA, 3. National Human Genome Research Institute, National Institutes of Health, Bethesda, MD, USA, 4. Baylor College of Medicine, Houston, TX, USA, 5. Lawrence Berkeley National Laboratory, Berkeley, CA, USA, 6. Cold Spring Harbor Laboratory, Cold Spring Harbor, NY, USA, 7. National Center for Biotechnology Information, National Institutes of Health, Bethesda, MD, USA, 8. Institute of Medical Microbiology and Hospital Hygiene, Heinrich Heine University Düsseldorf, Düsseldorf, Germany 9. Presenting NovoGraph Graph Construction Graph constructed by processing the input MSA for each reference contig in a column-by-column fashion from left to right in the order of genomic position. As the algorithm moves along the MSA, it keeps track of the set of haplotypes compatible with the input contigs and their potential recombinants. Motivation Global Pairwise Alignment (A) Begin with local alignments between the contig and the reference genome (blue diagonals) with bwa-mem (B) Enumerate all possible combinations of these local alignments by realizing all paths connecting contigs from the upper left to lower right corner of global alignment matrix. (C) Score each alignment: matches contribute positive scores (dark blue) (D) InDels (red) and mismatches (gold) incur a penalty score (E) The alignment with the highest score is selected as the best global alignment for the next step in graph genome creation. Ties among global alignments are resolved arbitrarily. Graph representation (left) and unique variants (right) produced by graph genome alignment. From the global MSA, all unique paths through the graph genome are enumerated and written to output. In this example, the reference genome (grey) serves as a scaffold to which all contigs (blue, green, and orange) are aligned. In the first “extension” phase, all unique paths through the graph are identified until deviation from reference genome terminates. At this point, all variant paths are output, or “flushed” to the genome graph output; variants are output to VCF. In the second extension phase, the orange contig deviates again from the reference genome, producing another variant, which, following coalescence back to the reference genome, is “flushed” to the output file. • Genome graphs explicitly represent genetic variants and alternative haplotypes in a data structure amenable to read mapping and variant calling. • NovoGraph is a pipeline for the construction of a genome graph directly from a set of long-read de novo assemblies. It constructs a genome-wide multiple sequence alignment of all input contigs and uses a simple criterion of homologous-identical recombination to convert the multiple sequence alignment into a graph. • Each input genome can typically be reconstructed as a traversal of the graph, and nodes with more than one incoming or outgoing edge represent recombination points between the input genomes. • This project was initiated at an NCBI hackathon held before the 2016 CSHL Biological Data Science meeting. https://github.com/NCBI-Hackathons/NovoGraph Genome graph construction typically relies on call sets derived from short-read sequencing experiments. However, short-read sequencing has limited sensitivity in the hypervariable and structural-variation-rich regions where graph genomes can be expected to provide the greatest benefit. Existing methods for genome graph construction miss substantial proportions of relevant variation. By contrast, long-read-sequencing enables the assembly of complex sequences in a reference-bias-free way and the detection of structural variants at high sensitivity. NovoGraph is designed to encompass the wide spectrum of genetic variation accessible to long-read-based de novo assemblies. Algorithm Overview (a) The coverage of the input assemblies and the alignment of each to the graph genome. (b) Genomic annotations. High rates of polymorphism shown around peptide-binding-site encoding exons 2 and 3. HLA-B is the most polymorphic gene of the human genome. Sequence polymorphisms are known to cluster around the peptide-binding-site encoding exons 2 and 3 Evan Biederstedt1, 9, Jeffrey C. Oliver2, Nancy F. Hansen3, Aarti Jajoo4, Nathan Dunn5, Andrew Olson6, Ben Busby7, Alexander T. Dilthey3, 8 •NovoGraph-Simple—Genome graph constructed with overlapping variant alleles VCF contains 33,309,666 "bubbles" (i.e. sites with multiple alternative alleles) representing 34,519,145 variant alleles. •NovoGraph-Universal—Genome graph constructed with non-overlapping variant alleles VCF contains 23,478,835 bubbles representing 30,582,795 variant alleles Genome Graph of Seven Ethnically-diverse Human Genomes • AK1, Korean • CHM1, European • CHM13, European • HG003, Ashkenazi • HG004, Ashkenazi • HX1, Han Chinese • NA19240, Yoruba IGV visualization of HLA-B