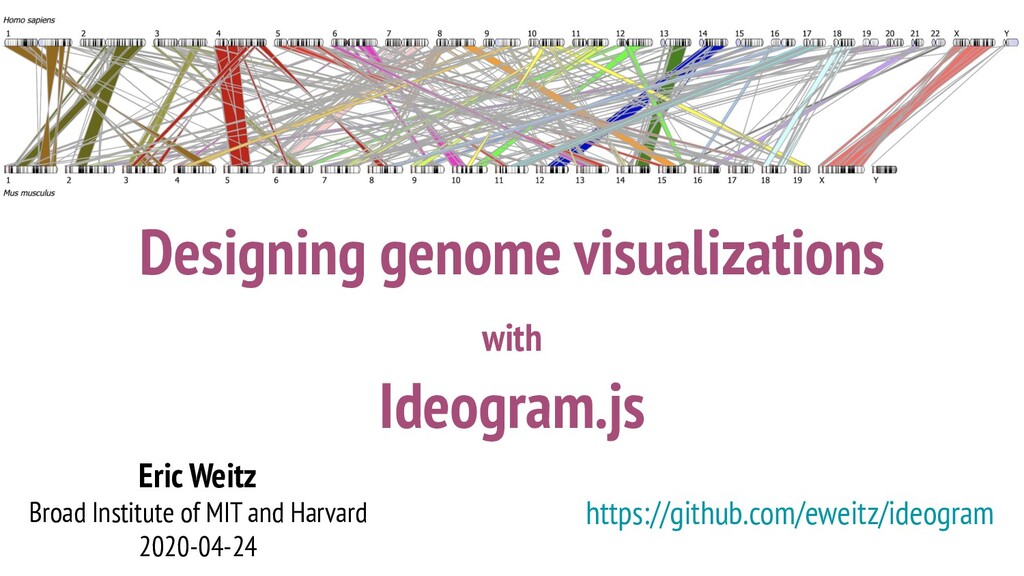
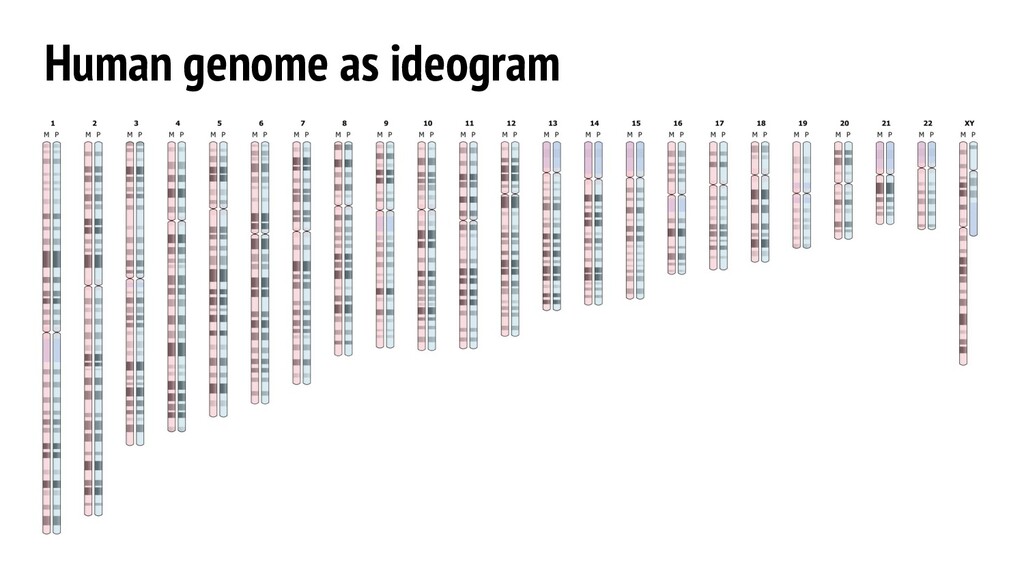
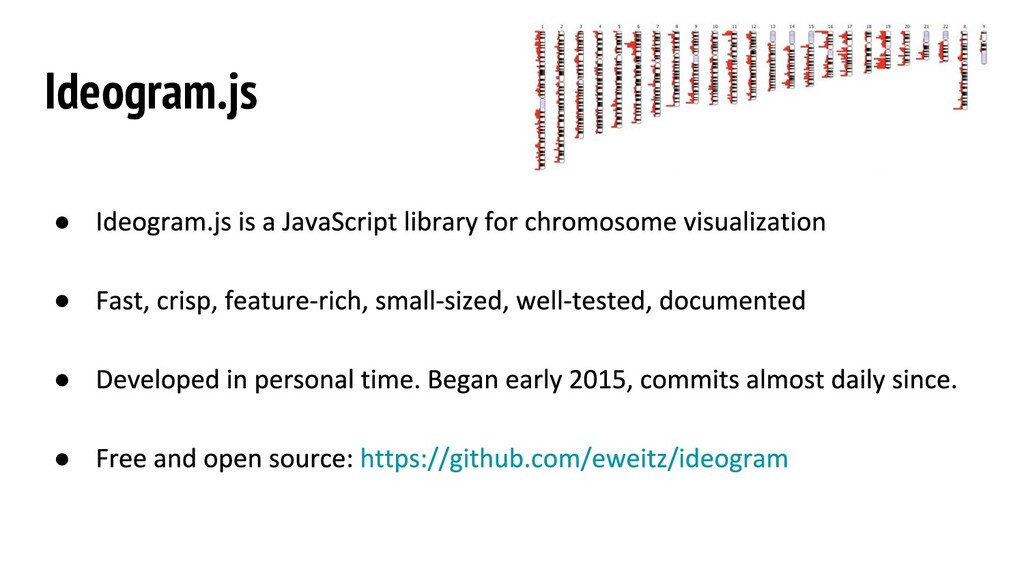
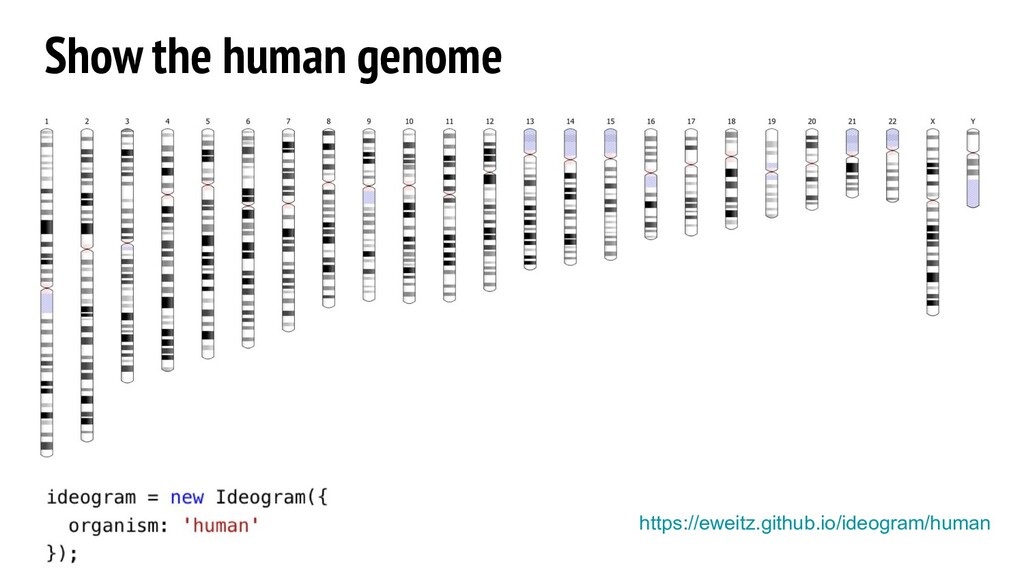
This presentation discusses how to make compelling interactive graphics for genomics using Ideogram.js (https://github.com/eweitz/ideogram), a tool for chromosome visualization on the web.
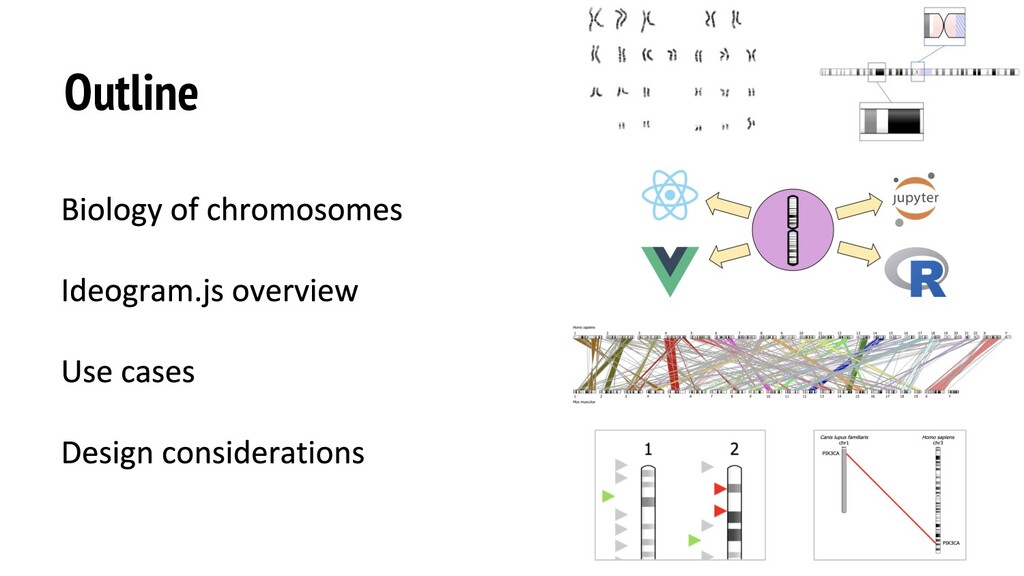
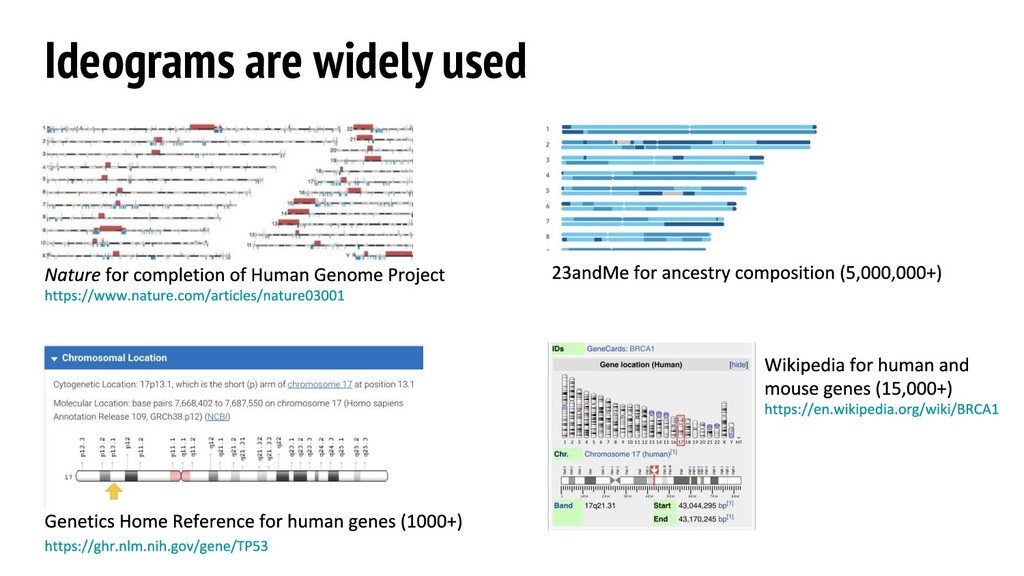
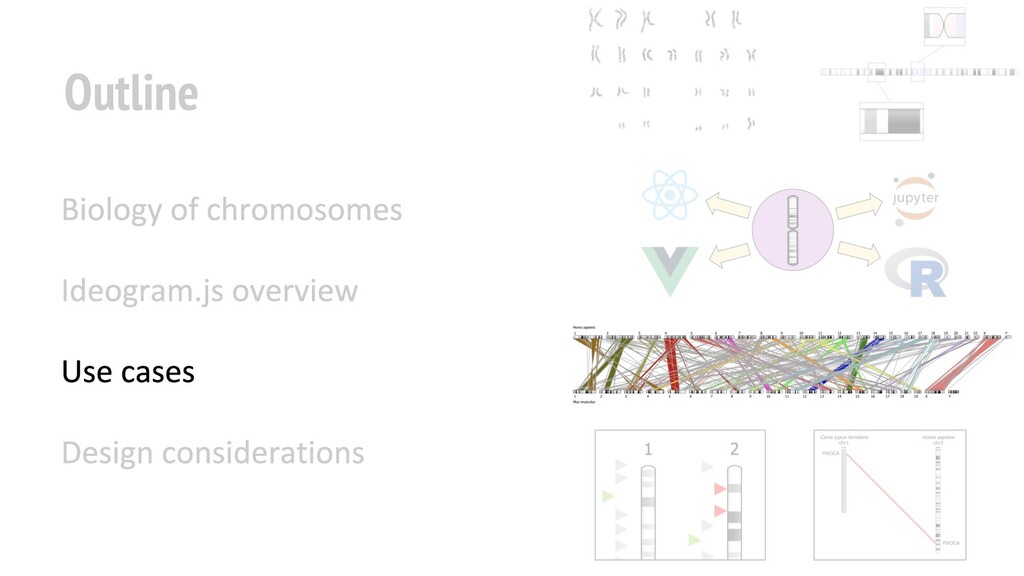
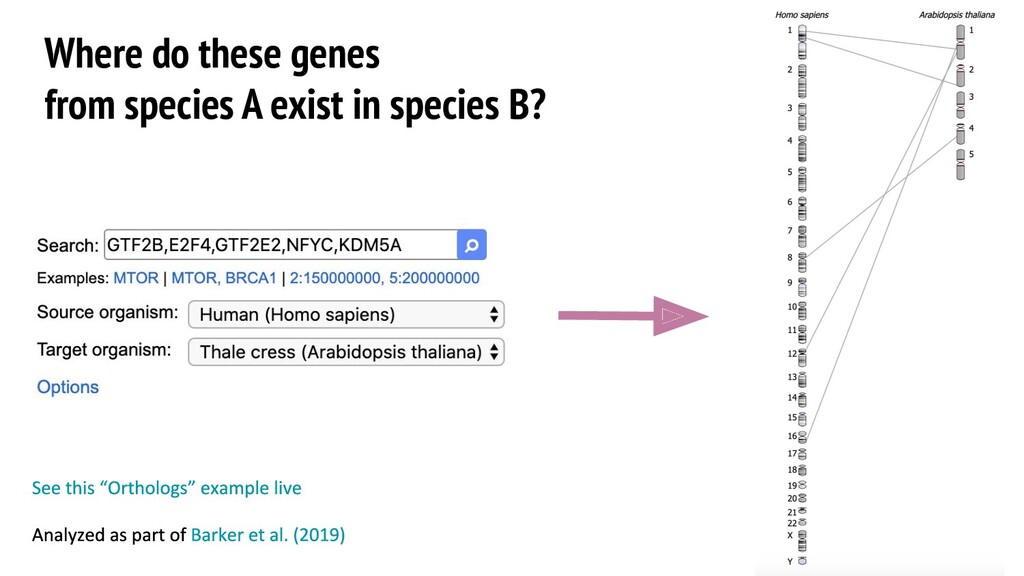
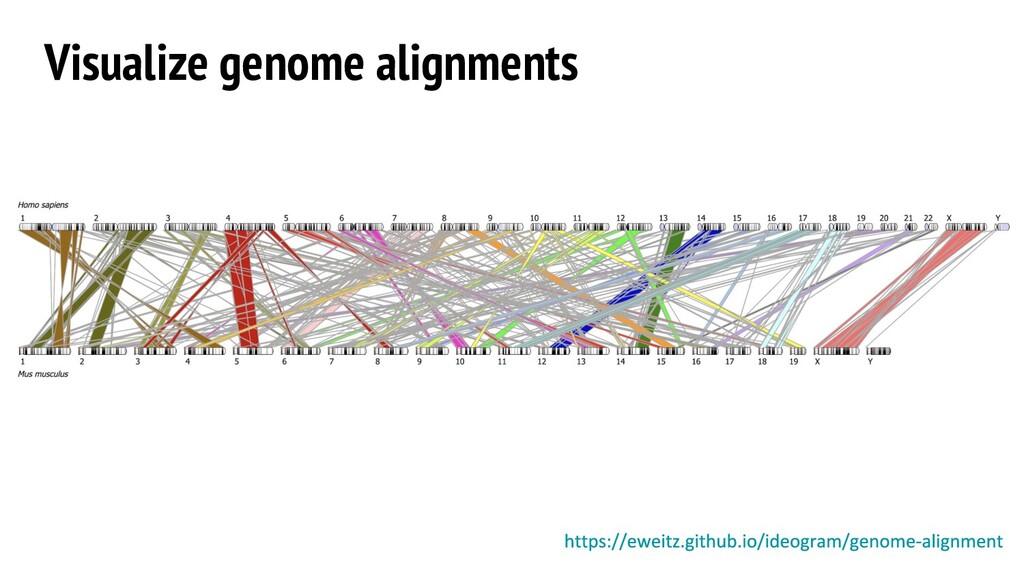
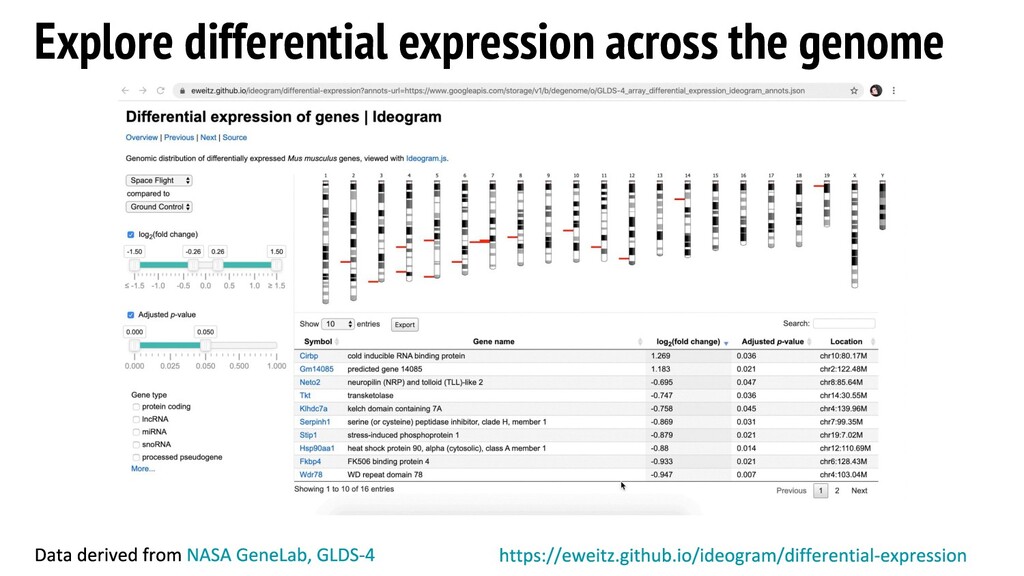
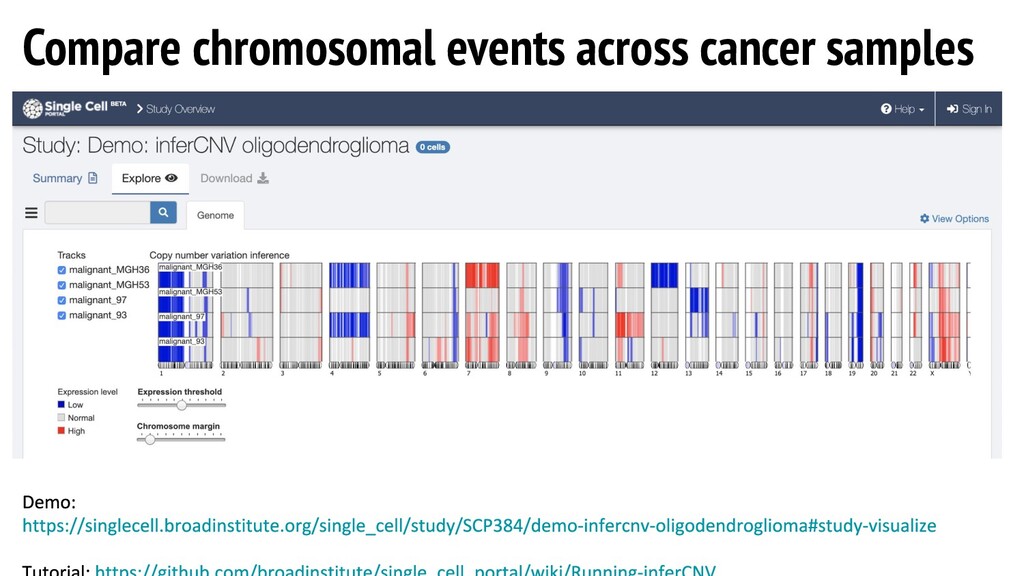
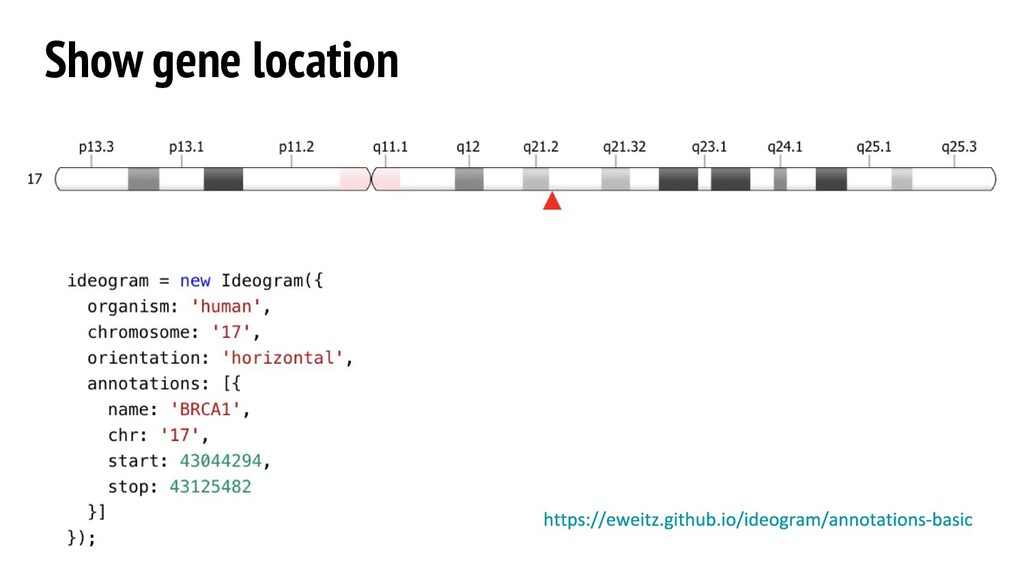
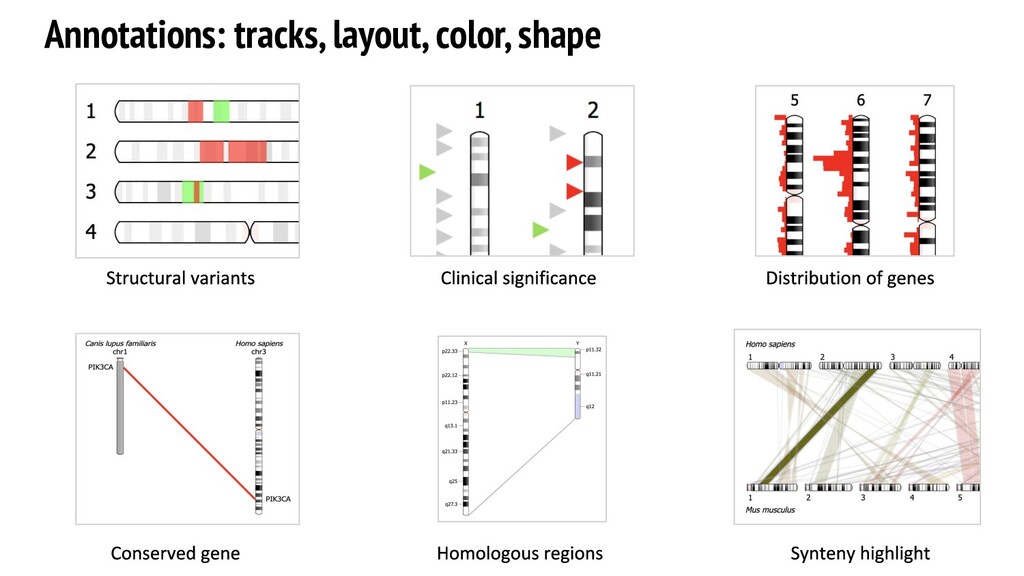
It discusses a range of use cases, and shows you how to: depict clinical variants, compare your genes to a plant’s, show where BRCA1 is, visualize genome alignments, see how cancer wreaks genomic havoc, explore how space flight affects gene expression, and more.
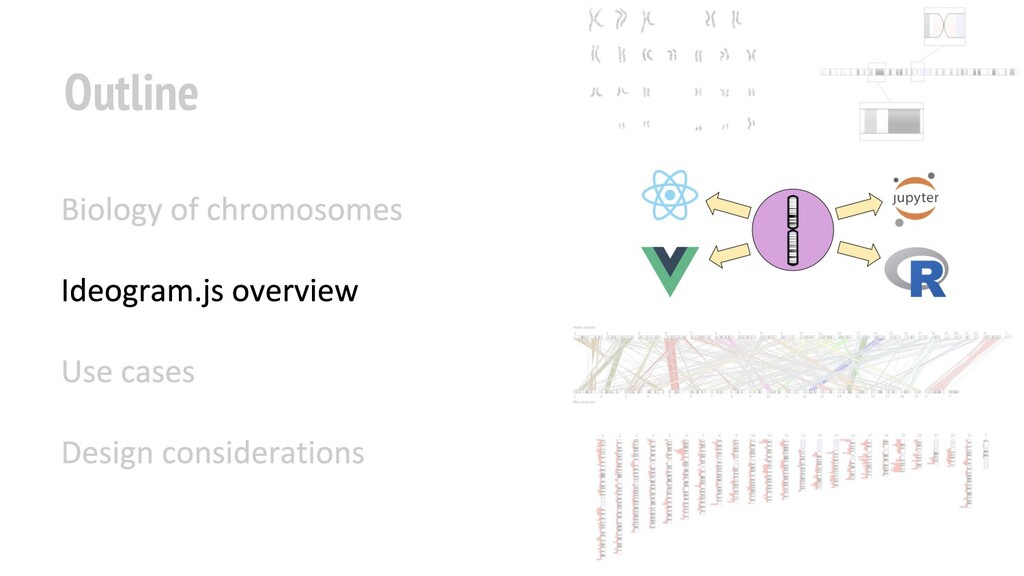
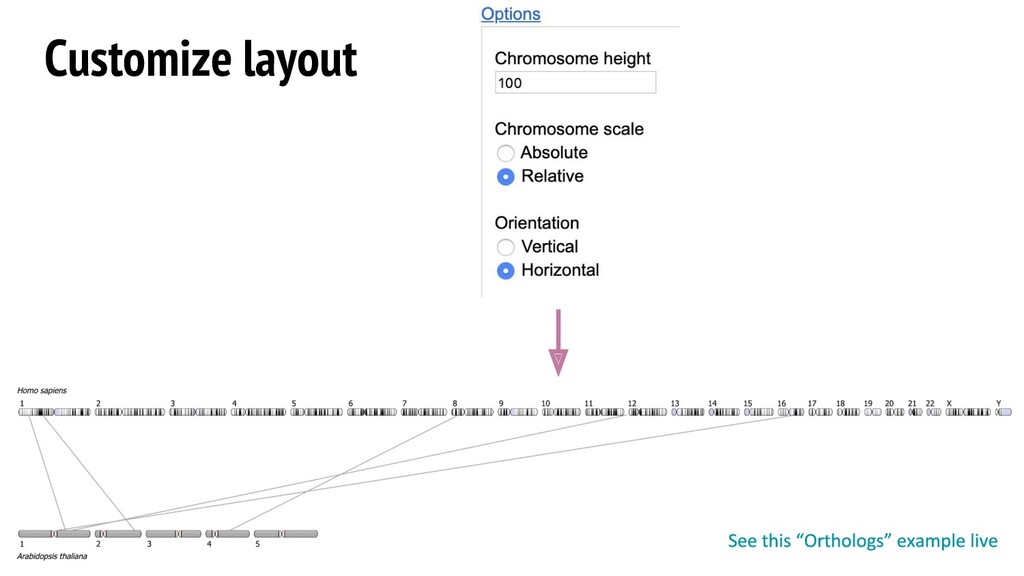
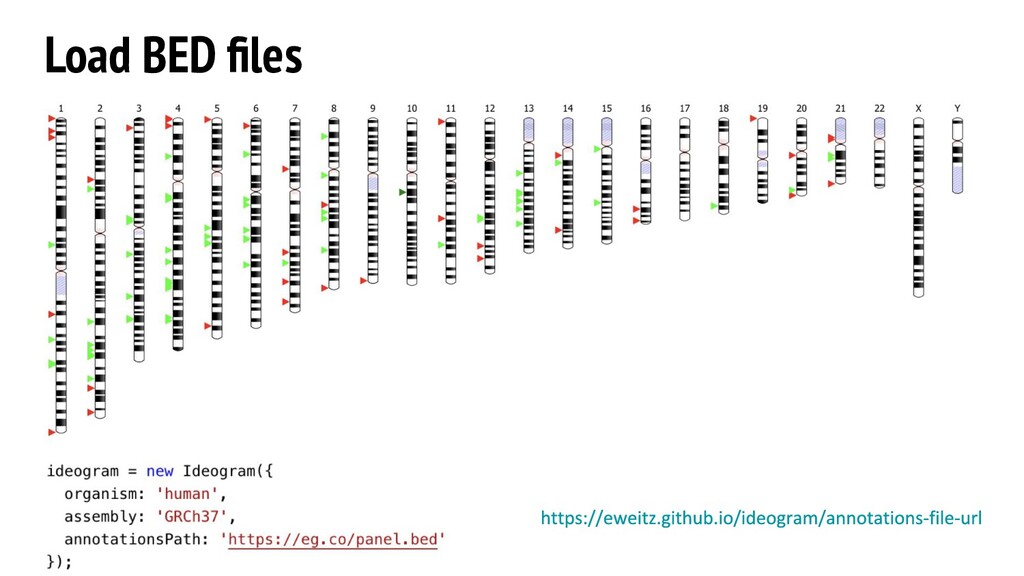
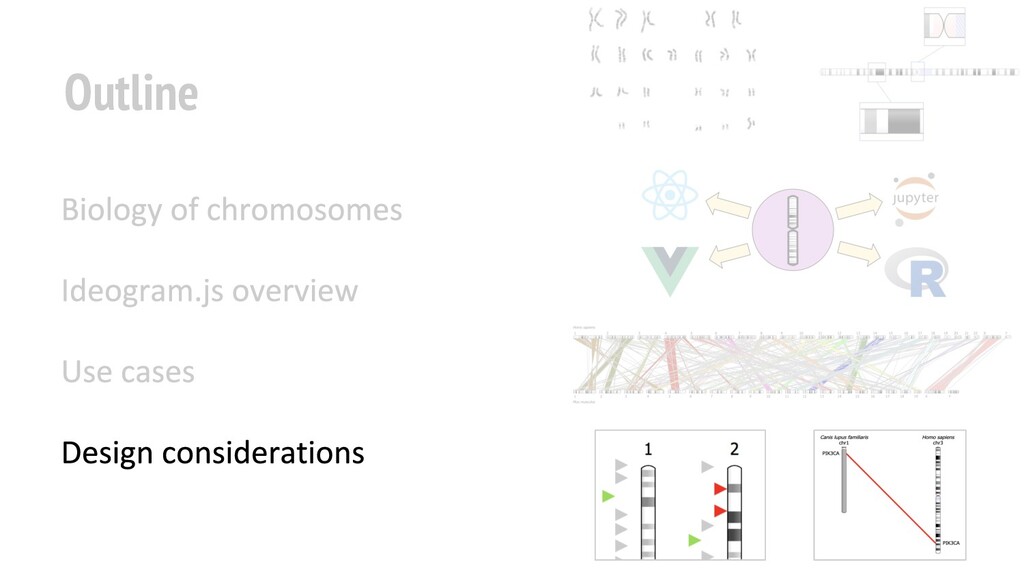
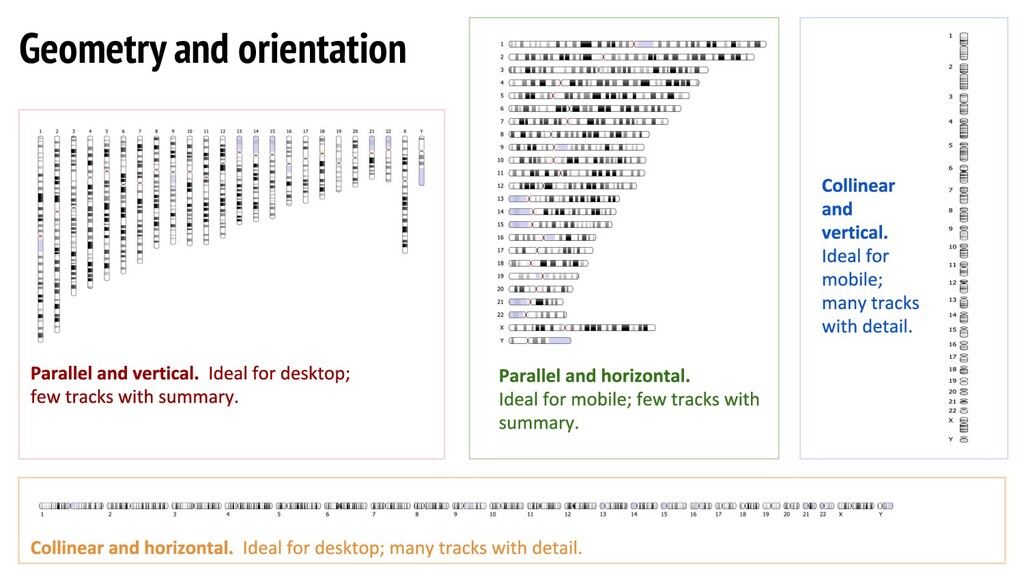
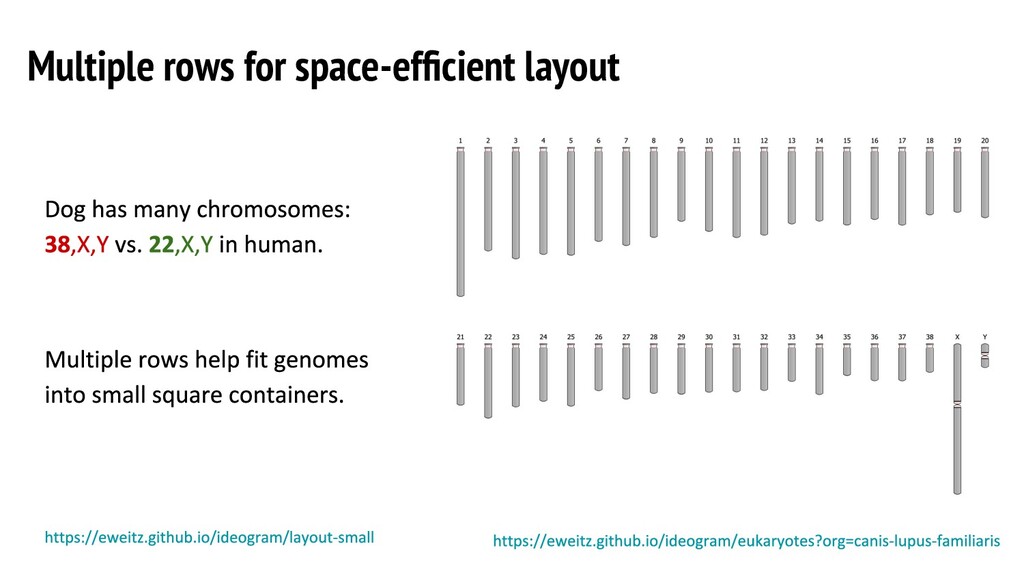
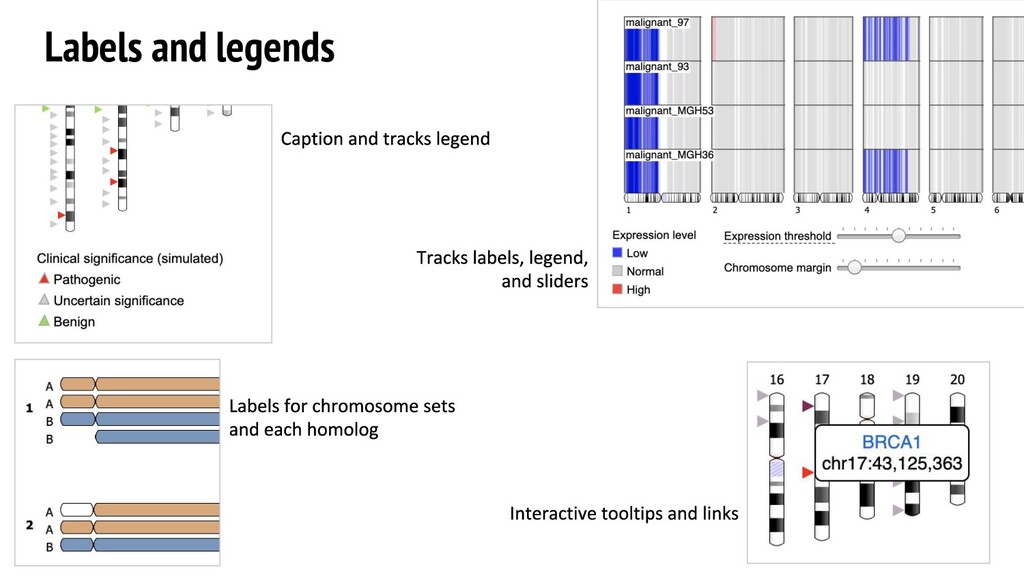
Design considerations are also discussed, including layout, annotations, labels, and legends.