Upgrade to Pro — share decks privately, control downloads, hide ads and more …

IdeogramJS: Chromosome visualization with JavaScript

Eric Weitz
October 24, 2018

IdeogramJS: Chromosome visualization with JavaScript

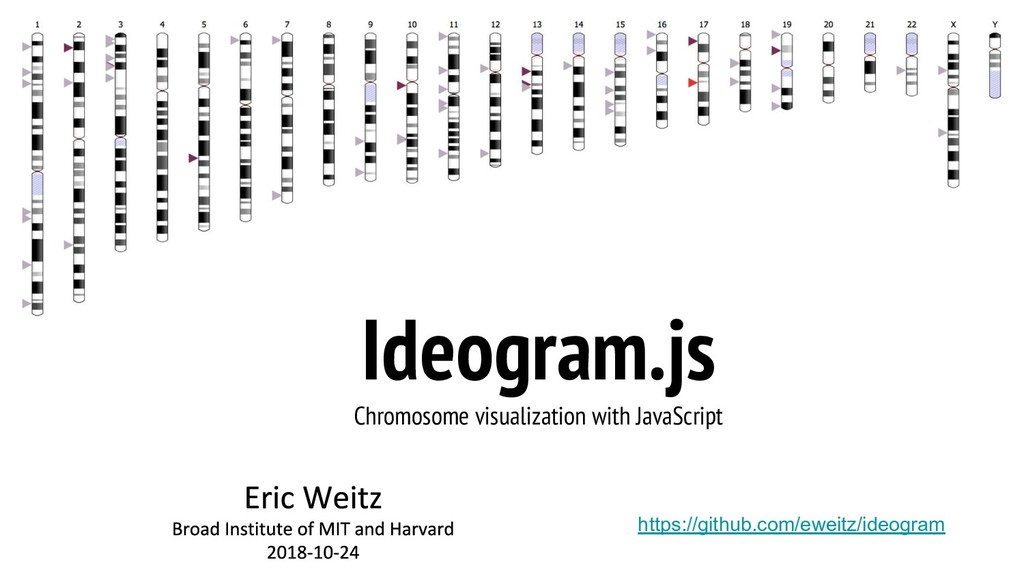
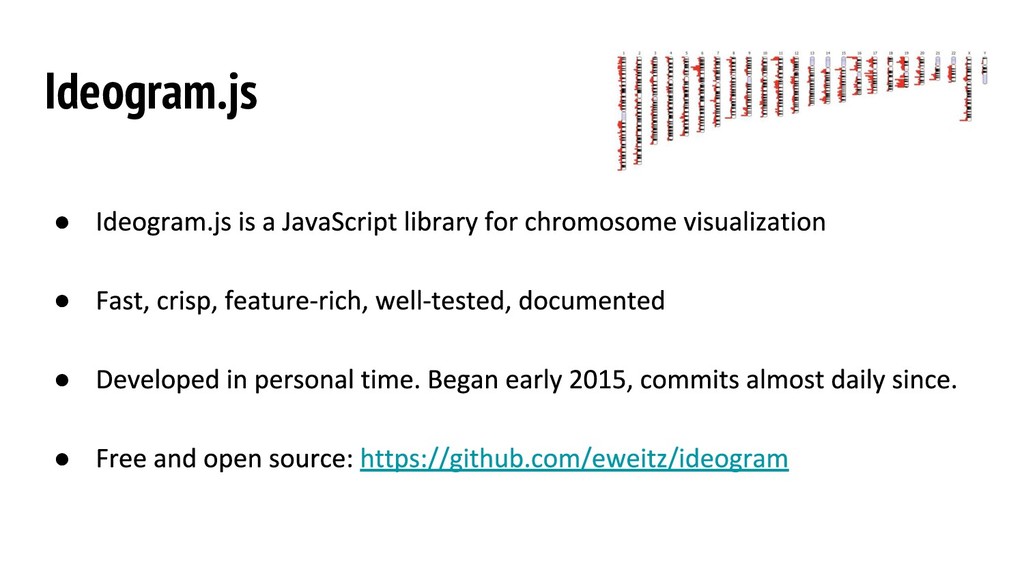
The science and software behind Ideogram.js (https://github.com/eweitz/ideogram).

Presented in an hour-long session to an audience of 30-40 software engineers in the Software Engineering Meetup at the Broad Institute in Cambridge, Massachusetts on October 24, 2018.

Eric Weitz

October 24, 2018
Tweet

More Decks by Eric Weitz

Other Decks in Science

Transcript

  1. Ideogram.js software architecture Ideogram.js is a client-side web component. -

    Few dependencies; framework-independent Run-time is JavaScript; data build is Python. Remaining stack: Travis CI, Coveralls, GitHub Pages, Unpkg CDN
  2. Performance Speed matters to users and developers. Users: page load

    time, run-time smoothness Developers: user concerns + time to compile, test, add features
  3. Ideogram.js performance 53 kB in transfer size < 350 ms

    for uncached load and render < 100 ms to filter 20,000+ genes
  4. Measure performance with Chrome DevTools Chrome DevTools panels give key

    insight on web app performance. Network panel: • Detail on each request • Throttle download, upload, latency Performance panel: • Automatic screenshots of visual state over time • “Flame chart” of call stack over time Mac: Command + Option + I Windows / Linux: Control + Shift + I
  5. Adding new features quickly Code Climate estimates technical debt in

    a repo, by measuring: Argument count Complex logic File length Identical blocks of code Similar blocks of code https://codeclimate.com/github/eweitz/ideogram Method complexity Method count Method length Nested control flow Return statements
  6. Ideogram.js 2019 roadmap • More support for cancer genomics •

    Resurrect batch ideograms • Generalized comparative genomics • Responsive view for mobile