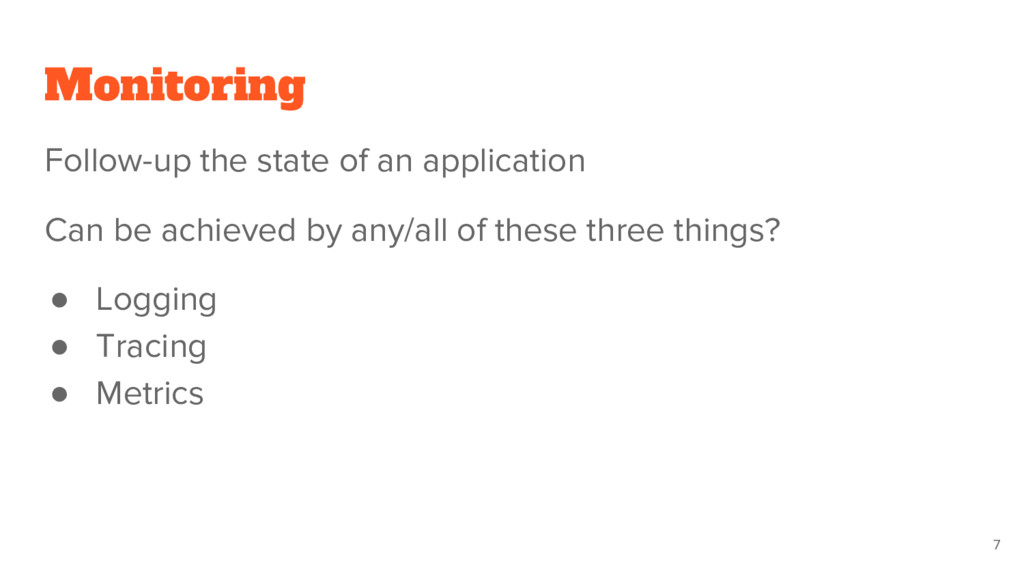
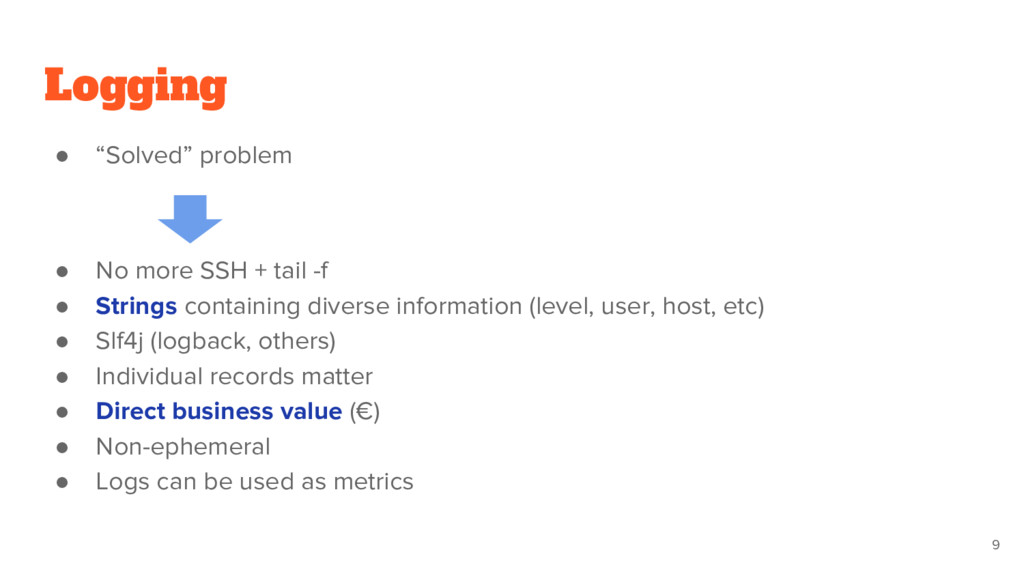
-f • Strings containing diverse information (level, user, host, etc) • Slf4j (logback, others) • Individual records matter • Direct business value (€) • Non-ephemeral • Logs can be used as metrics 9
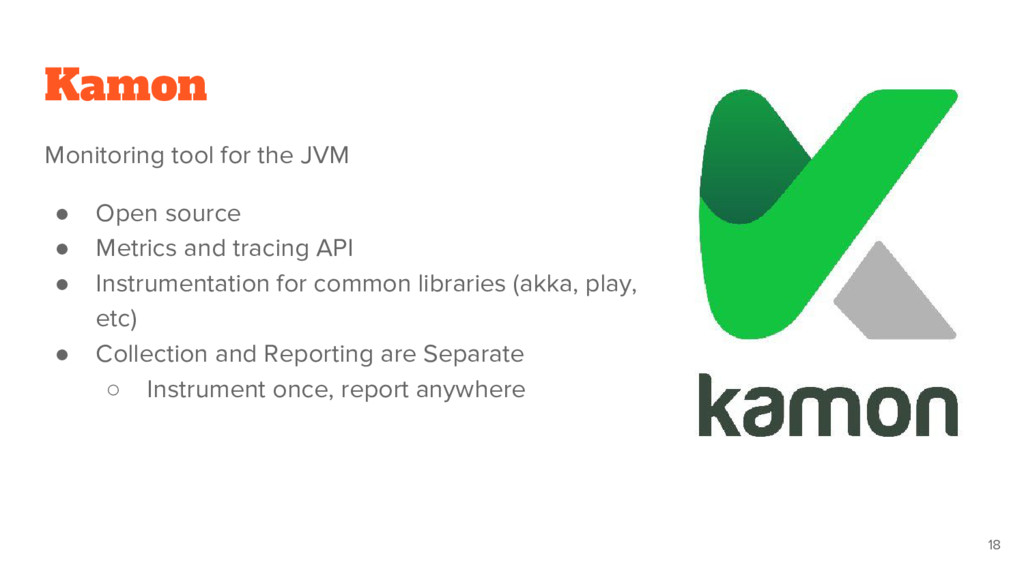
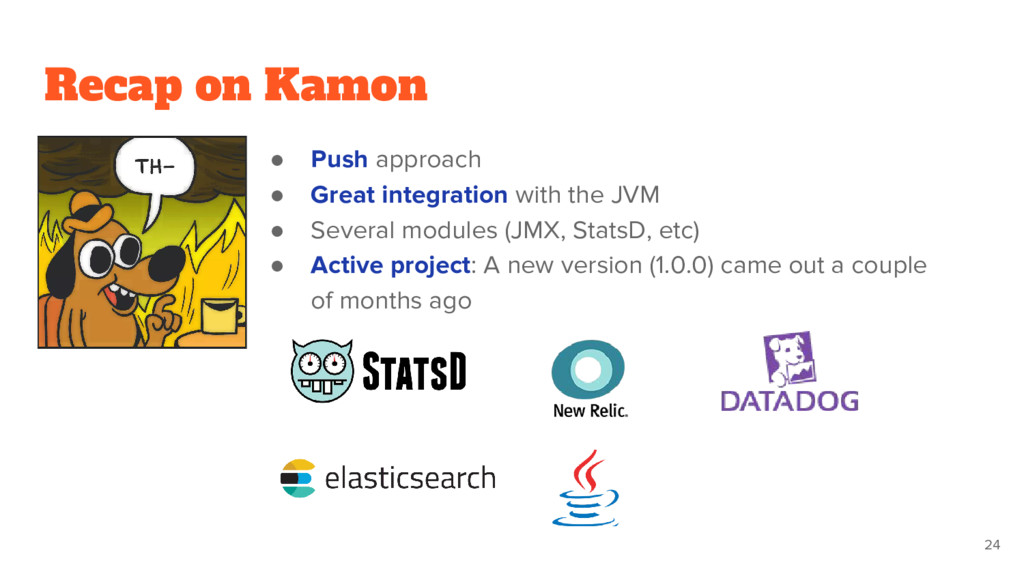
Metrics and tracing API • Instrumentation for common libraries (akka, play, etc) • Collection and Reporting are Separate ◦ Instrument once, report anywhere 18
You can run your monitoring on your laptop when developing changes • You can more easily tell if a target is down • You can manually go to a target and inspect its health with a web browser
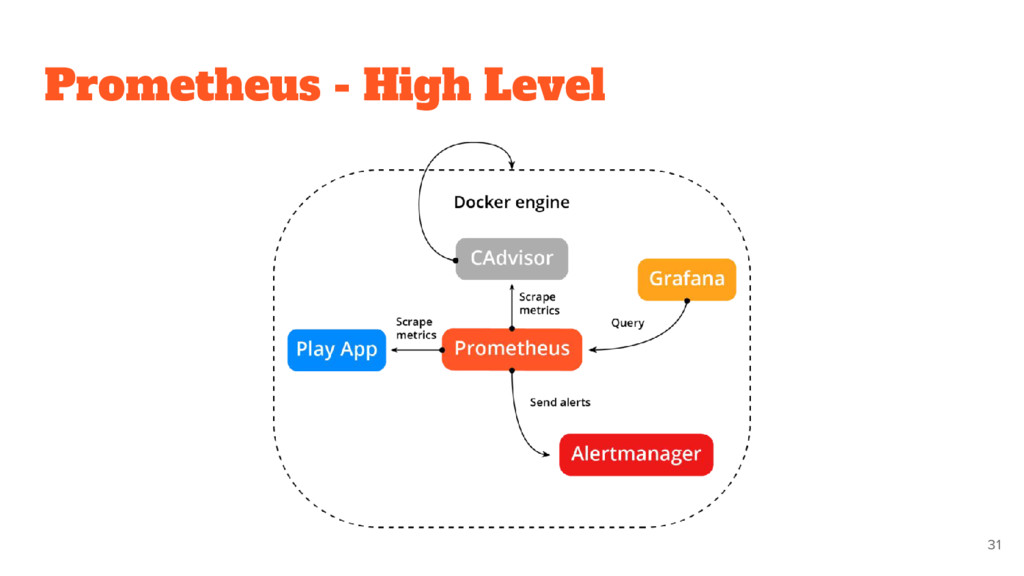
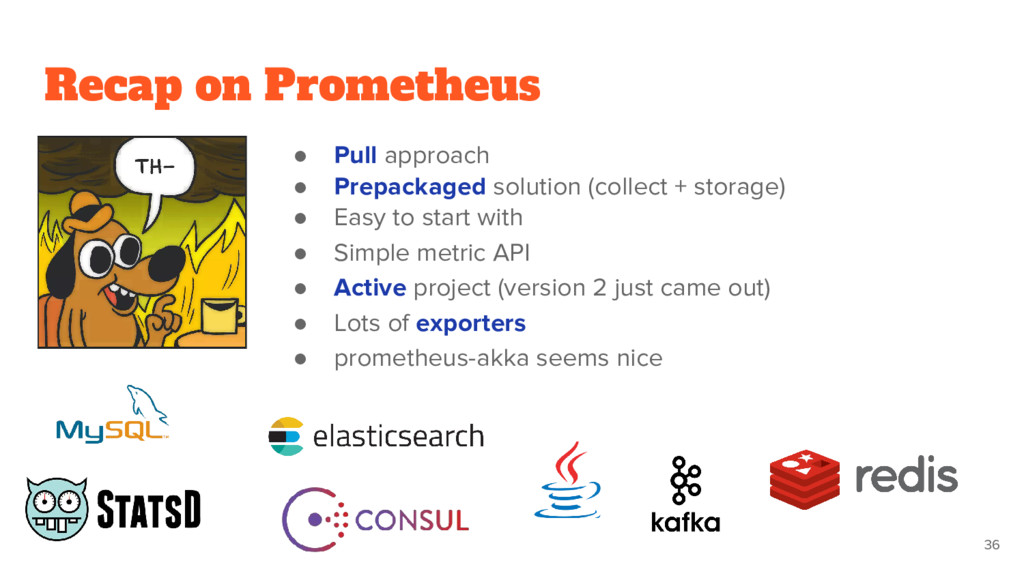
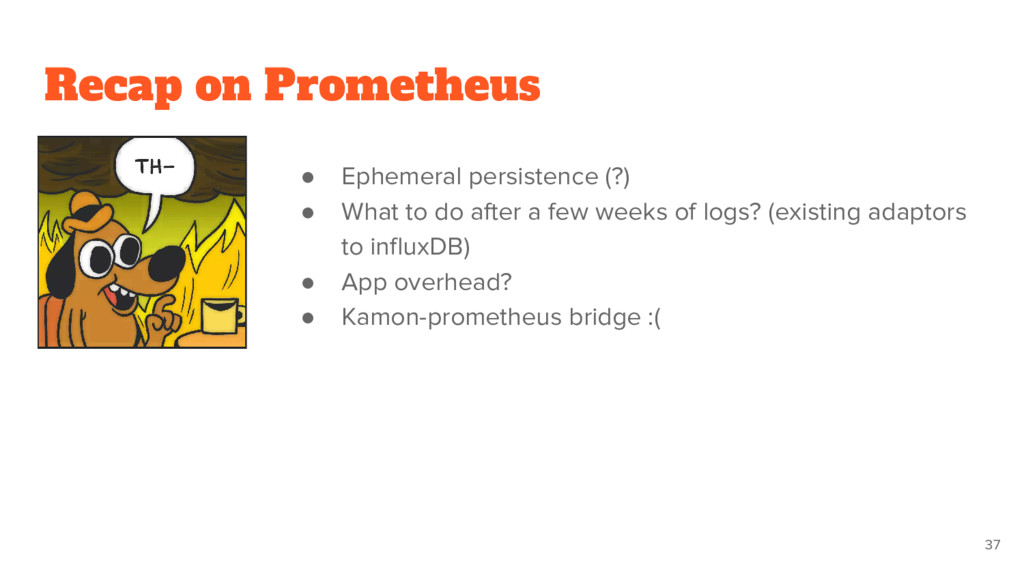
collecting and reporting • Metric API • Alerting already provided • Only numeric timeseries metrics It is not: • Don’t do logging or tracing • Do not care about individual events • Not distributed storage (only local) by design! 28
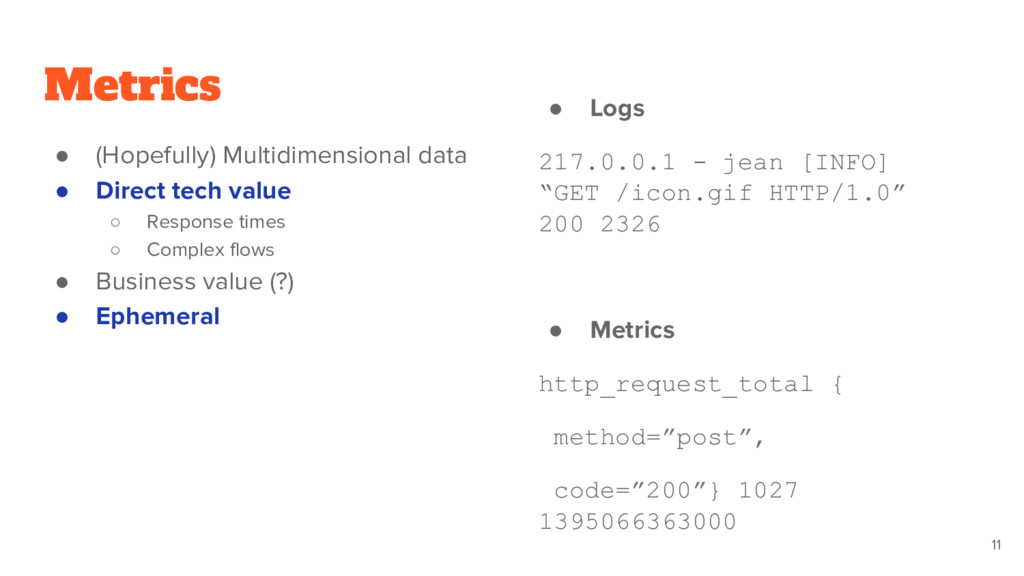
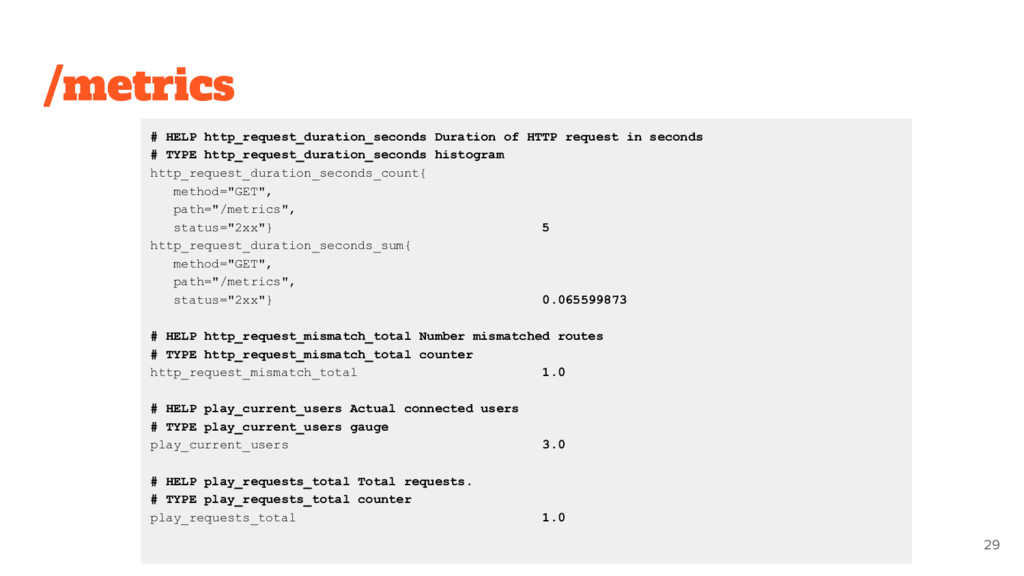
# TYPE http_request_duration_seconds histogram http_request_duration_seconds_count{ method="GET", path="/metrics", status="2xx"} 5 http_request_duration_seconds_sum{ method="GET", path="/metrics", status="2xx"} 0.065599873 # HELP http_request_mismatch_total Number mismatched routes # TYPE http_request_mismatch_total counter http_request_mismatch_total 1.0 # HELP play_current_users Actual connected users # TYPE play_current_users gauge play_current_users 3.0 # HELP play_requests_total Total requests. # TYPE play_requests_total counter play_requests_total 1.0 29
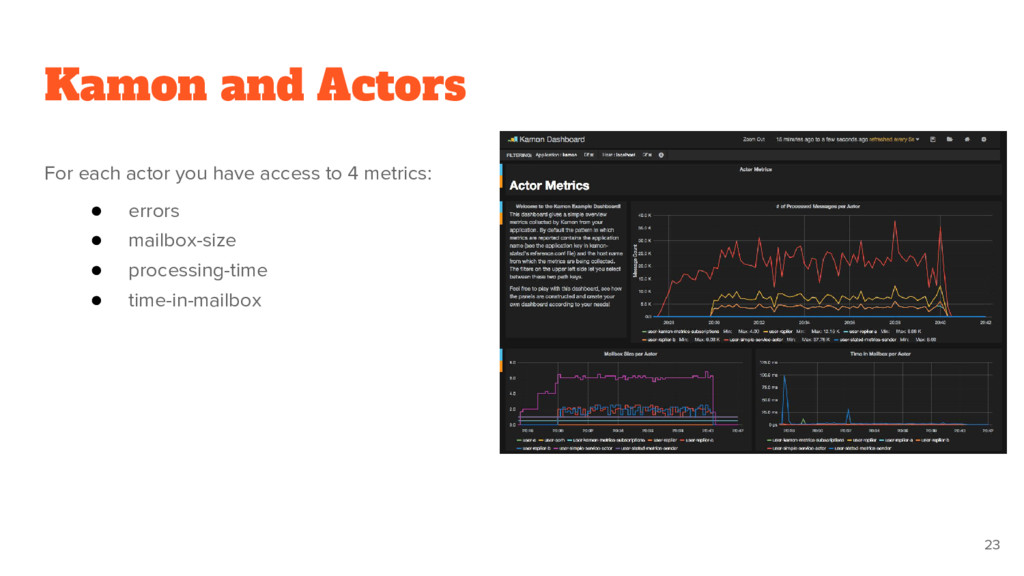
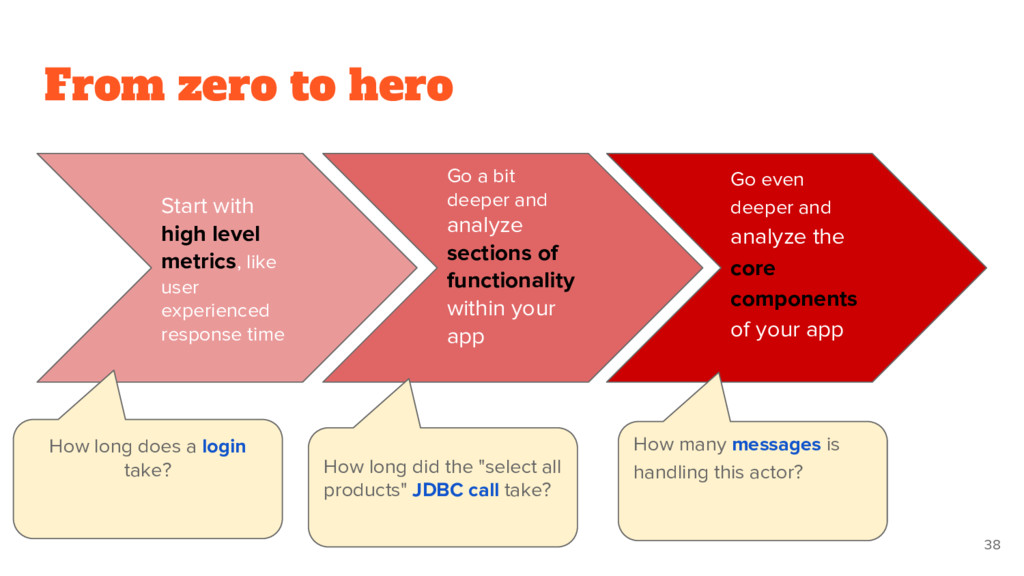
analyze sections of functionality within your app Start with high level metrics, like user experienced response time Go even deeper and analyze the core components of your app How long does a login take? How long did the "select all products" JDBC call take? How many messages is handling this actor?