Upgrade to Pro — share decks privately, control downloads, hide ads and more …

Reactive ❤️ Loom: A Forbidden Love Story

Reactive ❤️ Loom: A Forbidden Love Story

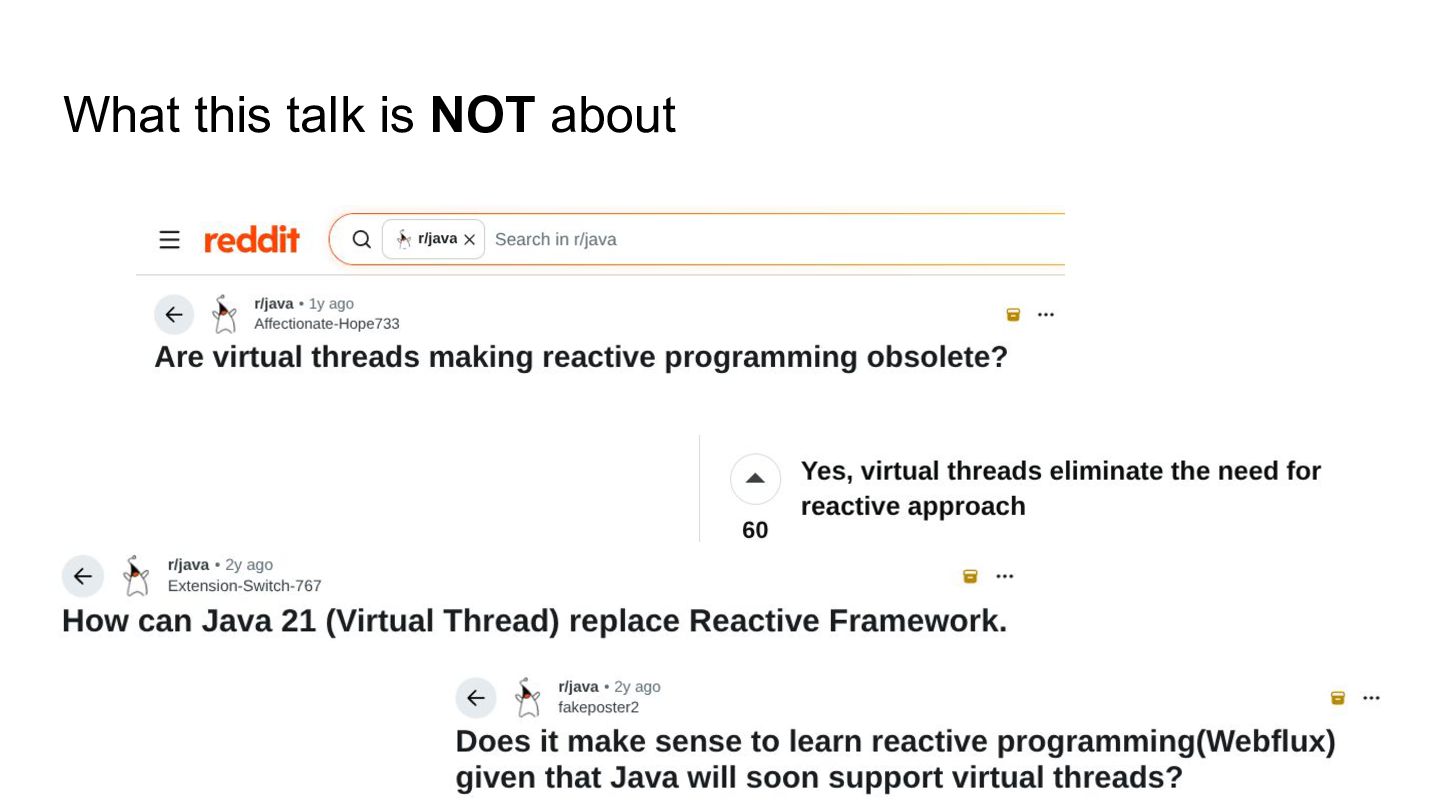
For years, the Java community has been told that Project Loom would kill reactive programming — that blocking and async were destined to be enemies. But what if that story was wrong?

In this talk, we’ll explore what happens when these two worlds actually fall in love.

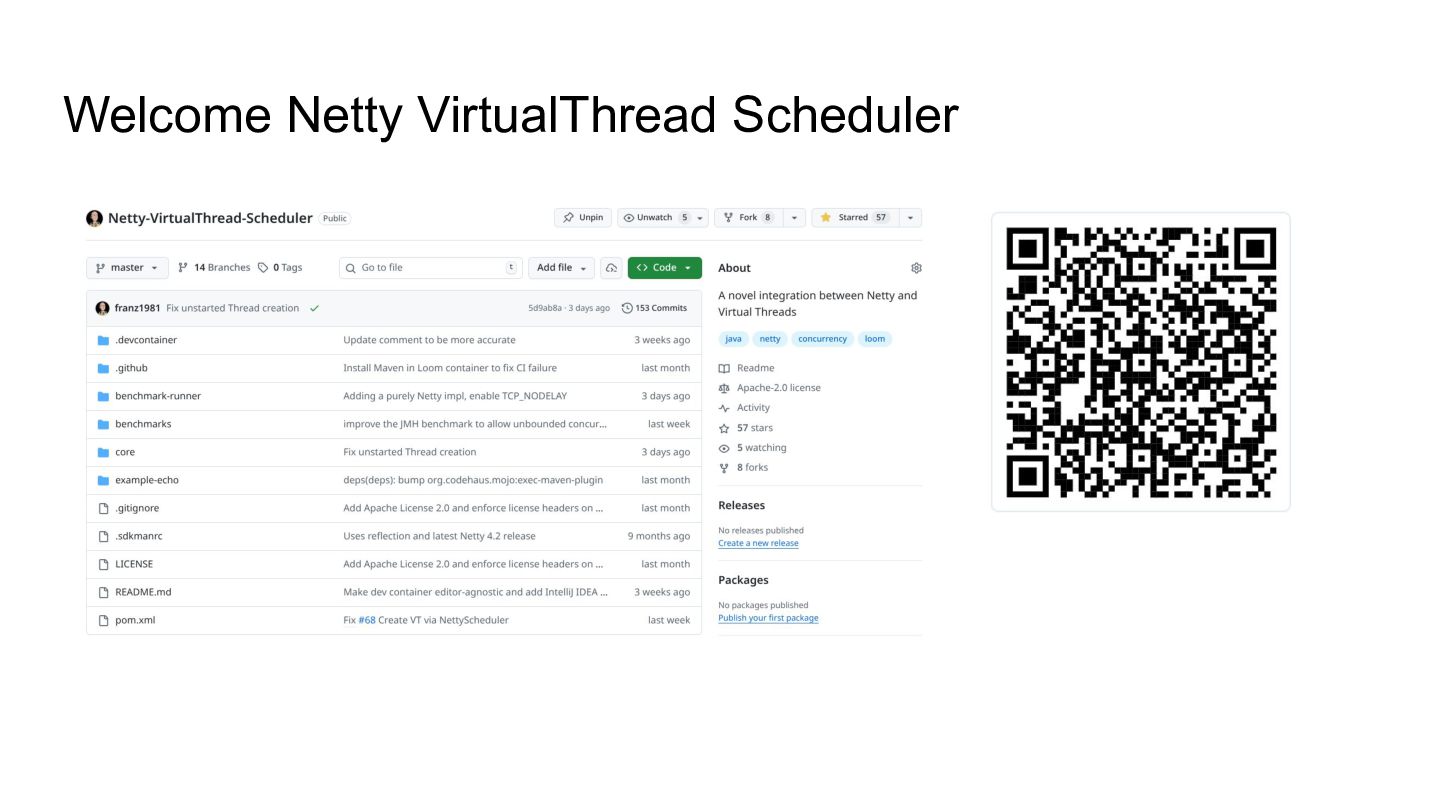
Drawing from real-world work inside the Quarkus, Vert.x, Netty, and HotSpot teams, we’ll see how a custom Loom scheduler built on top of Netty brings together the performance of event-driven I/O and the simplicity of virtual-thread-friendly blocking APIs.

This isn’t a theoretical “what if”: it’s a data-driven exploration born from experiments and collaborations between IBM, Oracle Labs, Oracle and Apple engineering teams.

You’ll see how this approach reshapes how we think about async, concurrency, and scheduling — and why some of the long-held assumptions about “reactive vs blocking” simply don’t hold up when measured scientifically.

Along the way, we’ll dissect:
- How the Loom scheduler and virtual threads work under the hood.
- What happens when you run them over a Netty core
- Performance implications and trade-offs measured empirically

This talk is a technical love story, but also a call to reason: Measure, Don’t Guess.
Because sometimes, the forbidden relationships are the ones that can move the platform forward.

Avatar for Francesco Nigro

Francesco Nigro

March 25, 2026

Other Decks in Programming

Transcript

  1. Who I am - Java Champion - Performance Engineer -

    Working hard on Quarkus performance In the Performance App Services Team in IBM - @forked_franz on Twitter/X/Whatever - Everyone call me Franz (not my name, BTW)
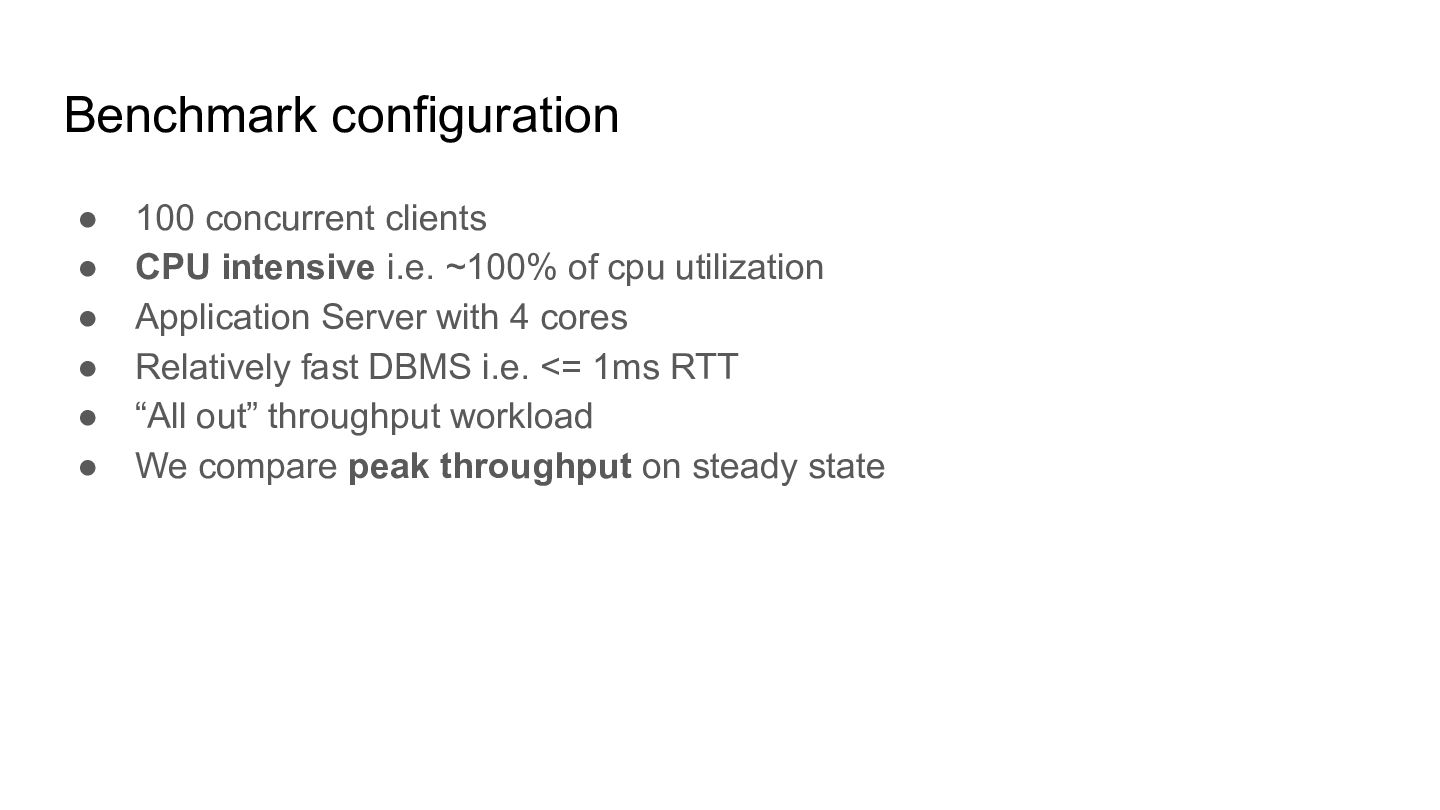
  2. Benchmark configuration • 100 concurrent clients • CPU intensive i.e.

    ~100% of cpu utilization • Application Server with 4 cores • Relatively fast DBMS i.e. <= 1ms RTT • “All out” throughput workload • We compare peak throughput on steady state
  3. • CPU-bound • few DBMS connections w blazing-fast RTT •

    low concurrency Not really where Loom is supposed to shine, but... • handling many platform threads vs fewer ones should help, right….RIGHT!? :”( After sleeping on it…
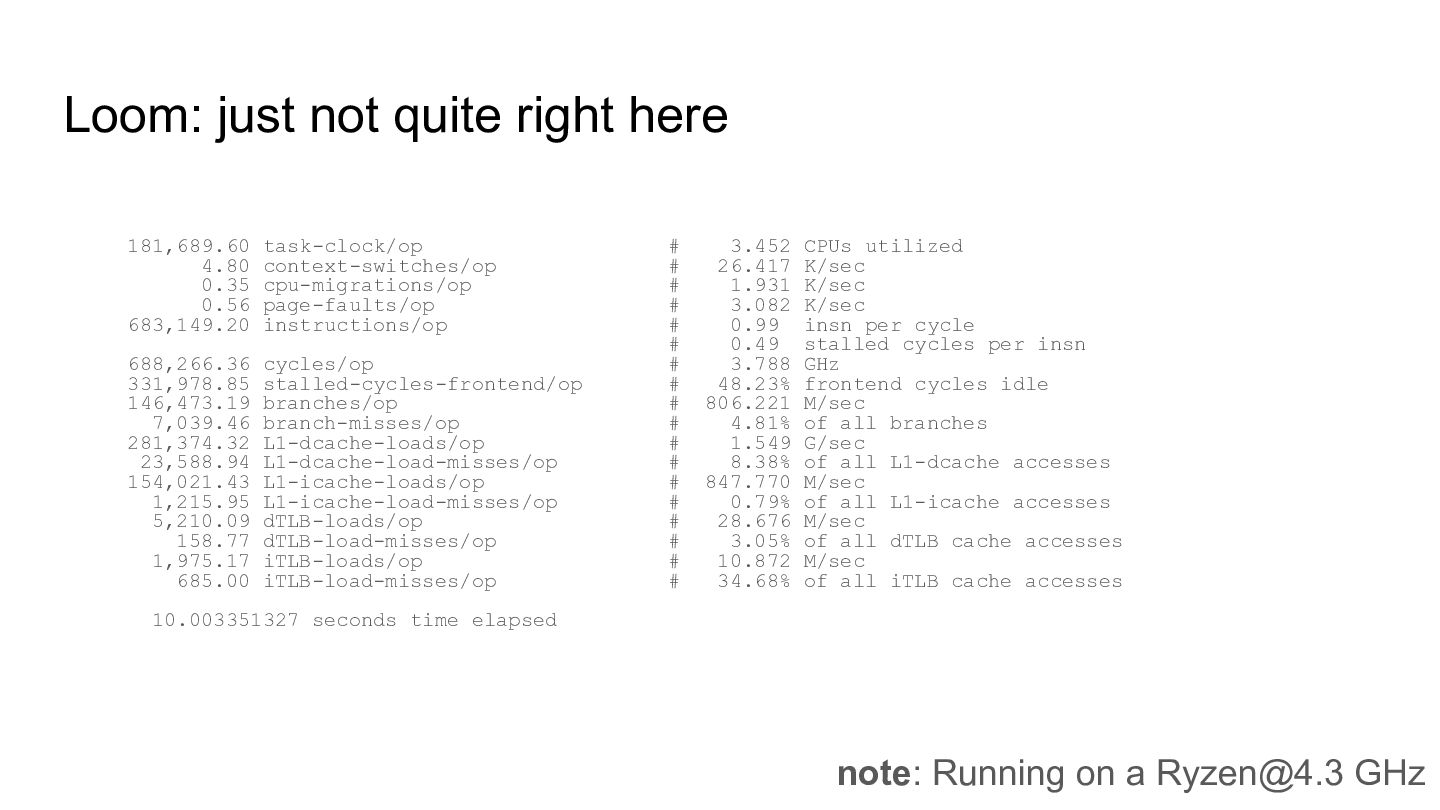
  4. Loom: just not quite right here 181,689.60 task-clock/op # 3.452

    CPUs utilized 4.80 context-switches/op # 26.417 K/sec 0.35 cpu-migrations/op # 1.931 K/sec 0.56 page-faults/op # 3.082 K/sec 683,149.20 instructions/op # 0.99 insn per cycle # 0.49 stalled cycles per insn 688,266.36 cycles/op # 3.788 GHz 331,978.85 stalled-cycles-frontend/op # 48.23% frontend cycles idle 146,473.19 branches/op # 806.221 M/sec 7,039.46 branch-misses/op # 4.81% of all branches 281,374.32 L1-dcache-loads/op # 1.549 G/sec 23,588.94 L1-dcache-load-misses/op # 8.38% of all L1-dcache accesses 154,021.43 L1-icache-loads/op # 847.770 M/sec 1,215.95 L1-icache-load-misses/op # 0.79% of all L1-icache accesses 5,210.09 dTLB-loads/op # 28.676 M/sec 158.77 dTLB-load-misses/op # 3.05% of all dTLB cache accesses 1,975.17 iTLB-loads/op # 10.872 M/sec 685.00 iTLB-load-misses/op # 34.68% of all iTLB cache accesses 10.003351327 seconds time elapsed note: Running on a [email protected] GHz
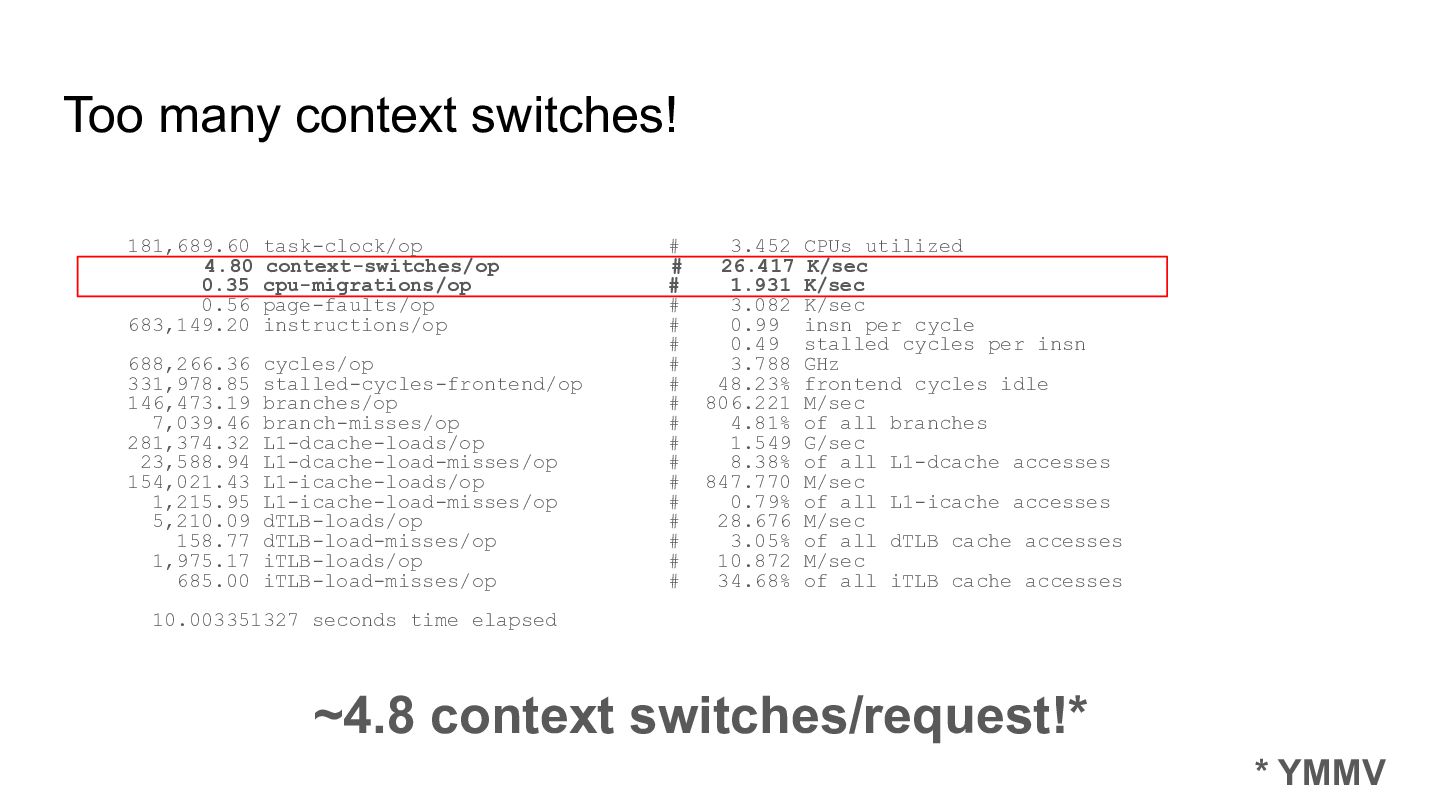
  5. Too many context switches! ~4.8 context switches/request!* * YMMV 181,689.60

    task-clock/op # 3.452 CPUs utilized 4.80 context-switches/op # 26.417 K/sec 0.35 cpu-migrations/op # 1.931 K/sec 0.56 page-faults/op # 3.082 K/sec 683,149.20 instructions/op # 0.99 insn per cycle # 0.49 stalled cycles per insn 688,266.36 cycles/op # 3.788 GHz 331,978.85 stalled-cycles-frontend/op # 48.23% frontend cycles idle 146,473.19 branches/op # 806.221 M/sec 7,039.46 branch-misses/op # 4.81% of all branches 281,374.32 L1-dcache-loads/op # 1.549 G/sec 23,588.94 L1-dcache-load-misses/op # 8.38% of all L1-dcache accesses 154,021.43 L1-icache-loads/op # 847.770 M/sec 1,215.95 L1-icache-load-misses/op # 0.79% of all L1-icache accesses 5,210.09 dTLB-loads/op # 28.676 M/sec 158.77 dTLB-load-misses/op # 3.05% of all dTLB cache accesses 1,975.17 iTLB-loads/op # 10.872 M/sec 685.00 iTLB-load-misses/op # 34.68% of all iTLB cache accesses 10.003351327 seconds time elapsed
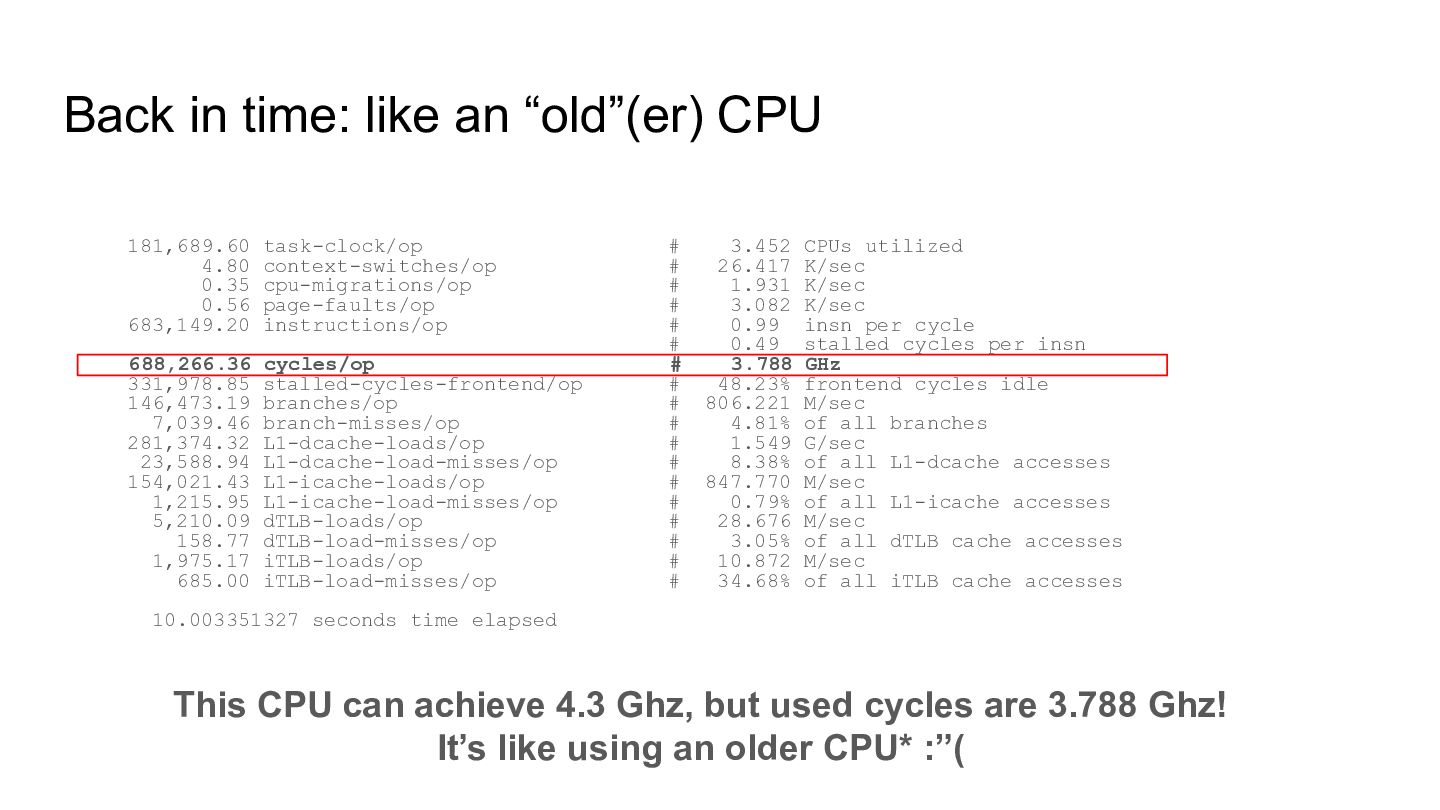
  6. 181,689.60 task-clock/op # 3.452 CPUs utilized 4.80 context-switches/op # 26.417

    K/sec 0.35 cpu-migrations/op # 1.931 K/sec 0.56 page-faults/op # 3.082 K/sec 683,149.20 instructions/op # 0.99 insn per cycle # 0.49 stalled cycles per insn 688,266.36 cycles/op # 3.788 GHz 331,978.85 stalled-cycles-frontend/op # 48.23% frontend cycles idle 146,473.19 branches/op # 806.221 M/sec 7,039.46 branch-misses/op # 4.81% of all branches 281,374.32 L1-dcache-loads/op # 1.549 G/sec 23,588.94 L1-dcache-load-misses/op # 8.38% of all L1-dcache accesses 154,021.43 L1-icache-loads/op # 847.770 M/sec 1,215.95 L1-icache-load-misses/op # 0.79% of all L1-icache accesses 5,210.09 dTLB-loads/op # 28.676 M/sec 158.77 dTLB-load-misses/op # 3.05% of all dTLB cache accesses 1,975.17 iTLB-loads/op # 10.872 M/sec 685.00 iTLB-load-misses/op # 34.68% of all iTLB cache accesses 10.003351327 seconds time elapsed Did we lose our cycles? We achieved 3.788 GHz, falling short of the 4.3 GHz potential
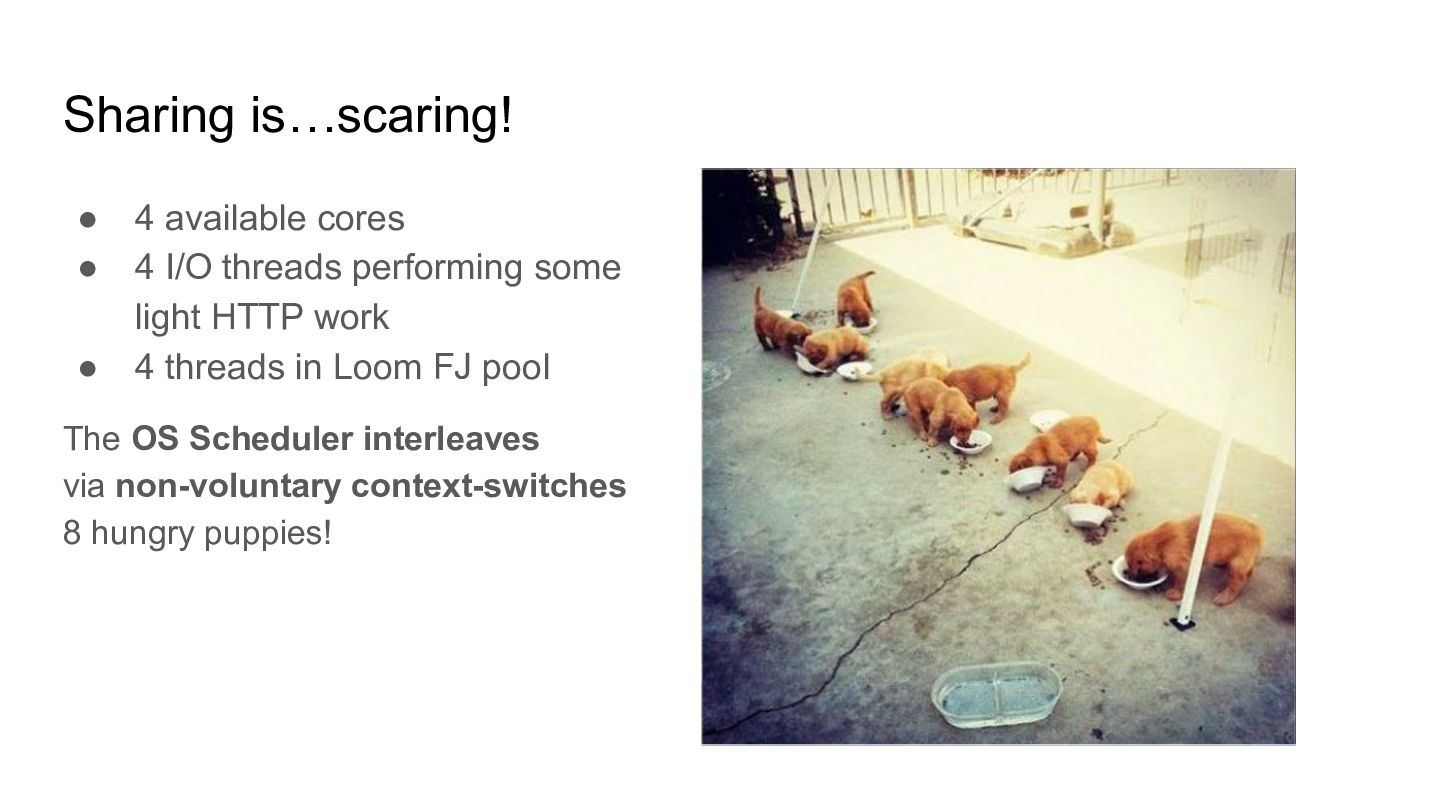
  7. Sharing is…scaring! • 4 available cores • 4 I/O threads

    performing some light HTTP work • 4 threads in Loom FJ pool The OS Scheduler interleaves 8 hungry puppies via non-voluntary context-switches!
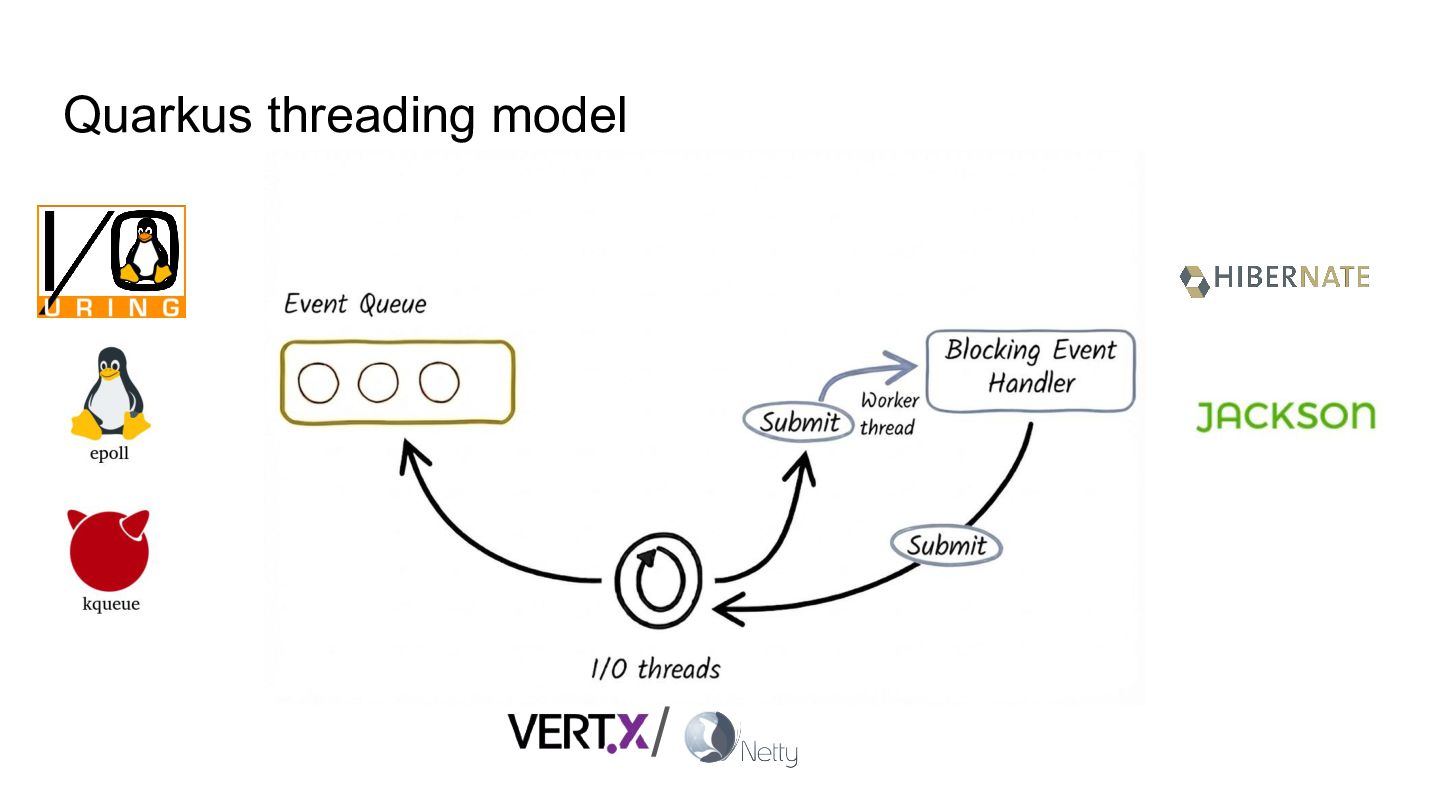
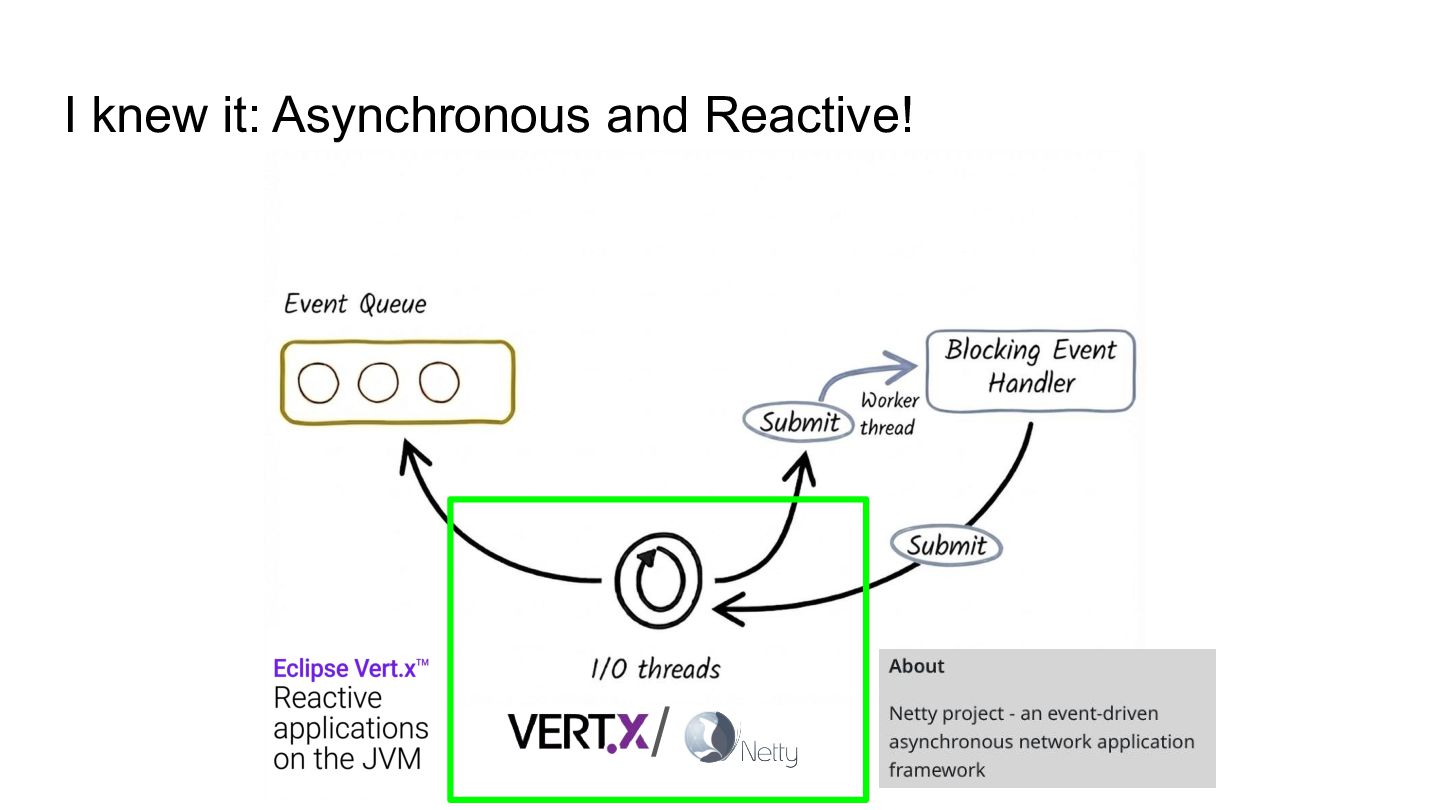
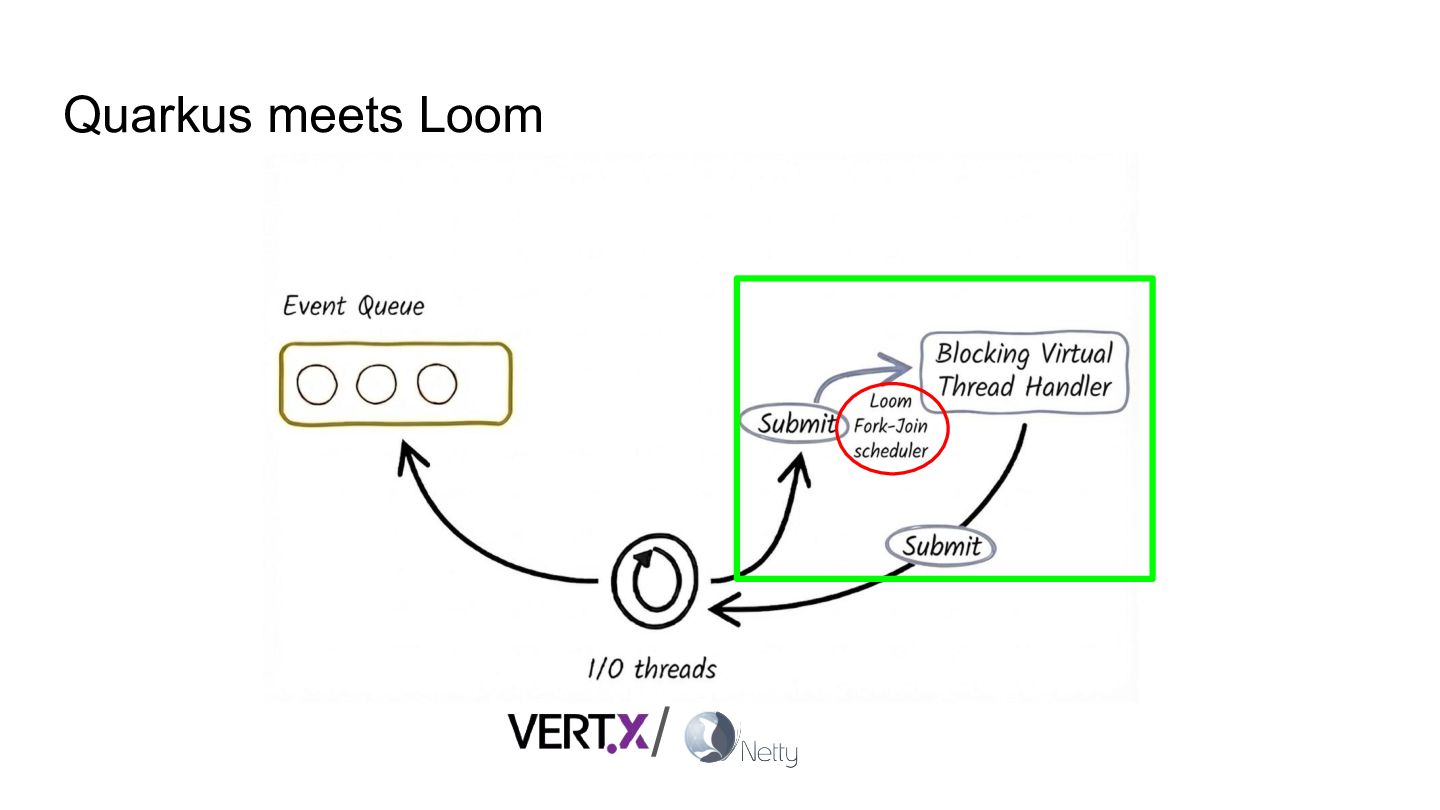
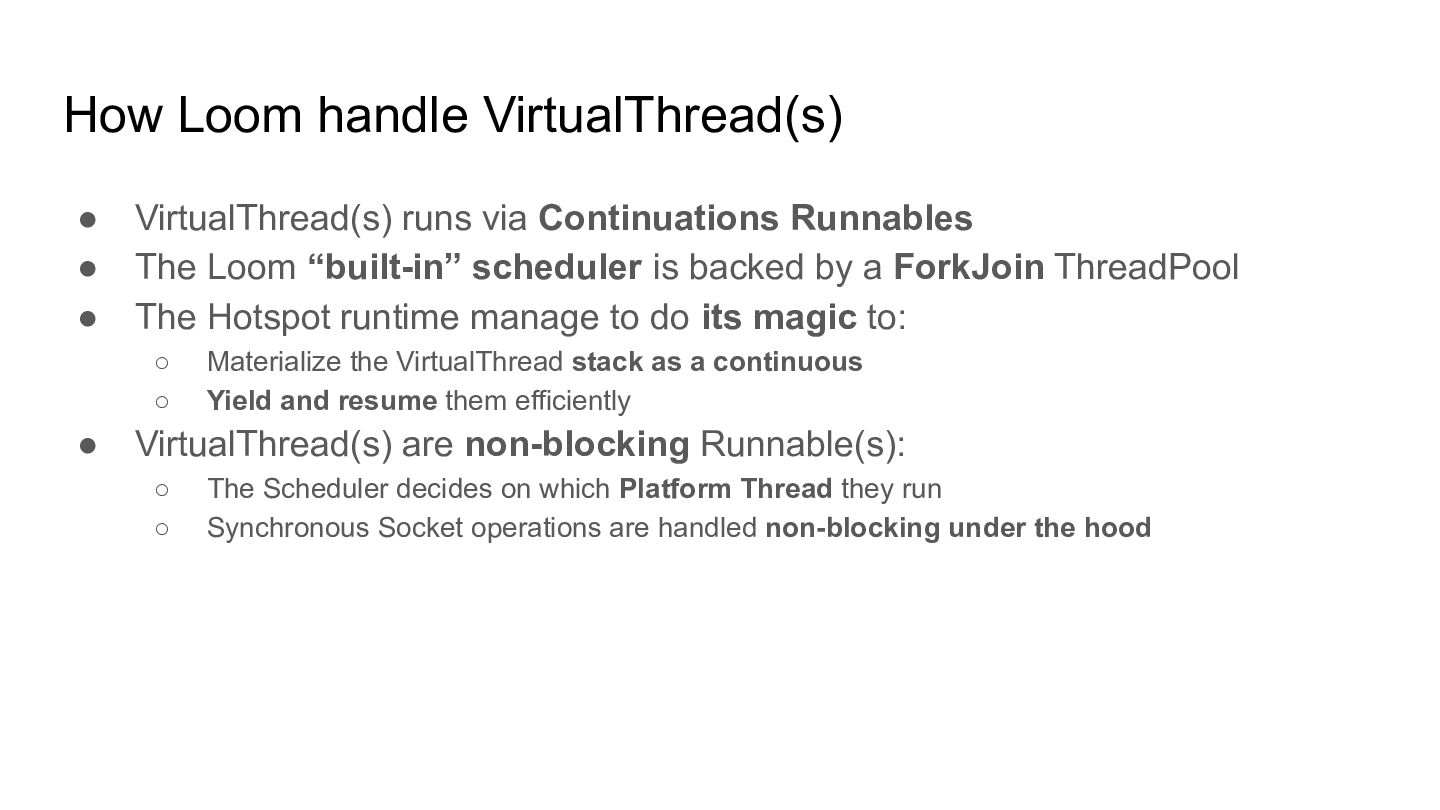
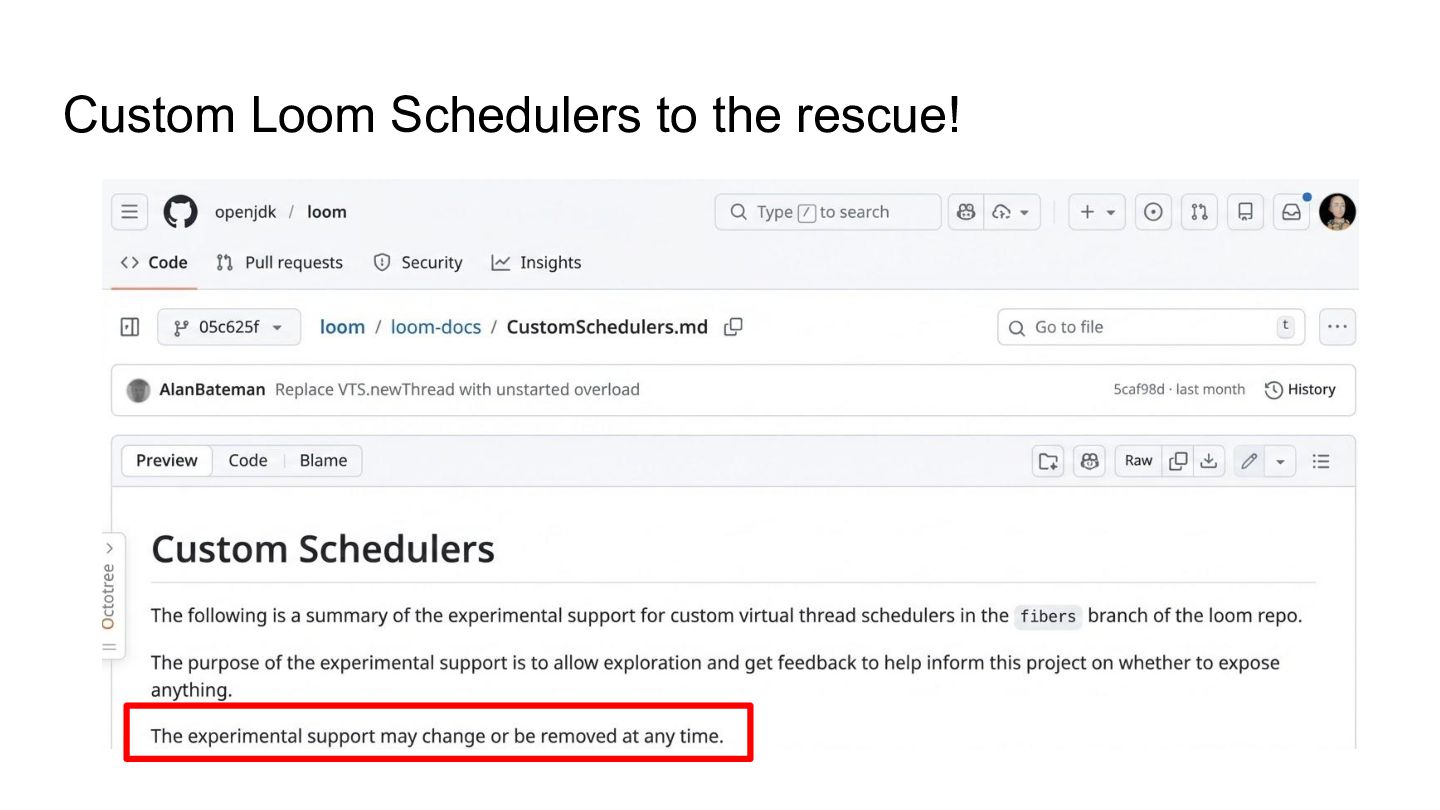
  8. Loom demystified • The Loom “built-in” scheduler is a ForkJoin

    thread pool • The Hotspot runtime manages to do its magic to efficiently yield and resume Virtual Threads • Virtual Threads are just non-blocking Runnables • the Loom scheduler decides on which Platform Thread they run TLDR: Loom is not that different from reactive/async code!
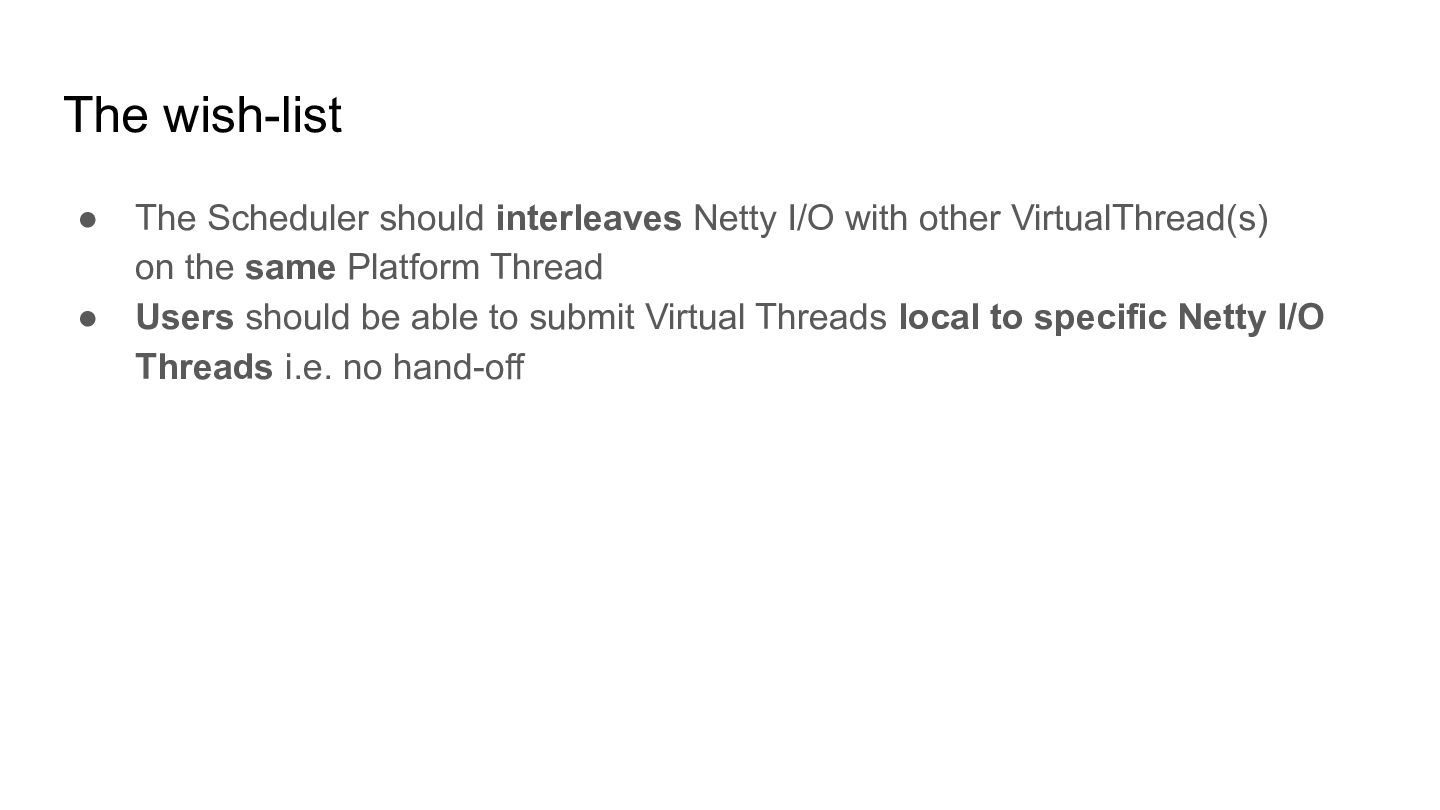
  9. Loom Scheduler wish-list • it should interleave Netty I/O with

    other VirtualThread(s) on the same Platform Thread • Virtual Threads started from Netty I/O should run on the same Platform Thread i.e. no inter-thread hand-off • Netty I/O event loops should keep running on the same Platform Thread
  10. on the same Platform Thread on the same Platform Thread

    on the same Platform Thread on the same Platform Thread on the same Platform Thread on the same Platform Thread on the same Platform Thread on the same Platform Thread on the same Platform Thread on the same Platform Thread on the same Platform Thread on the same Platform Thread on the same Platform Thread on the same Platform Thread on the same Platform Thread on the same Platform Thread on the same Platform Thread on the same Platform Thread on the same Platform Thread on the same Platform Thread on the same Platform Thread on the same Platform Thread on the same Platform Thread on the same Platform Thread on the same Platform Thread on the same Platform Thread on the same Platform Thread on the same Platform Thread on the same Platform Thread on the same Platform Thread on the same Platform Thread on the same Platform Thread on the same Platform Thread on the same Platform Thread on the same Platform Thread
  11. Get back to the lab! • Using a DBMS is

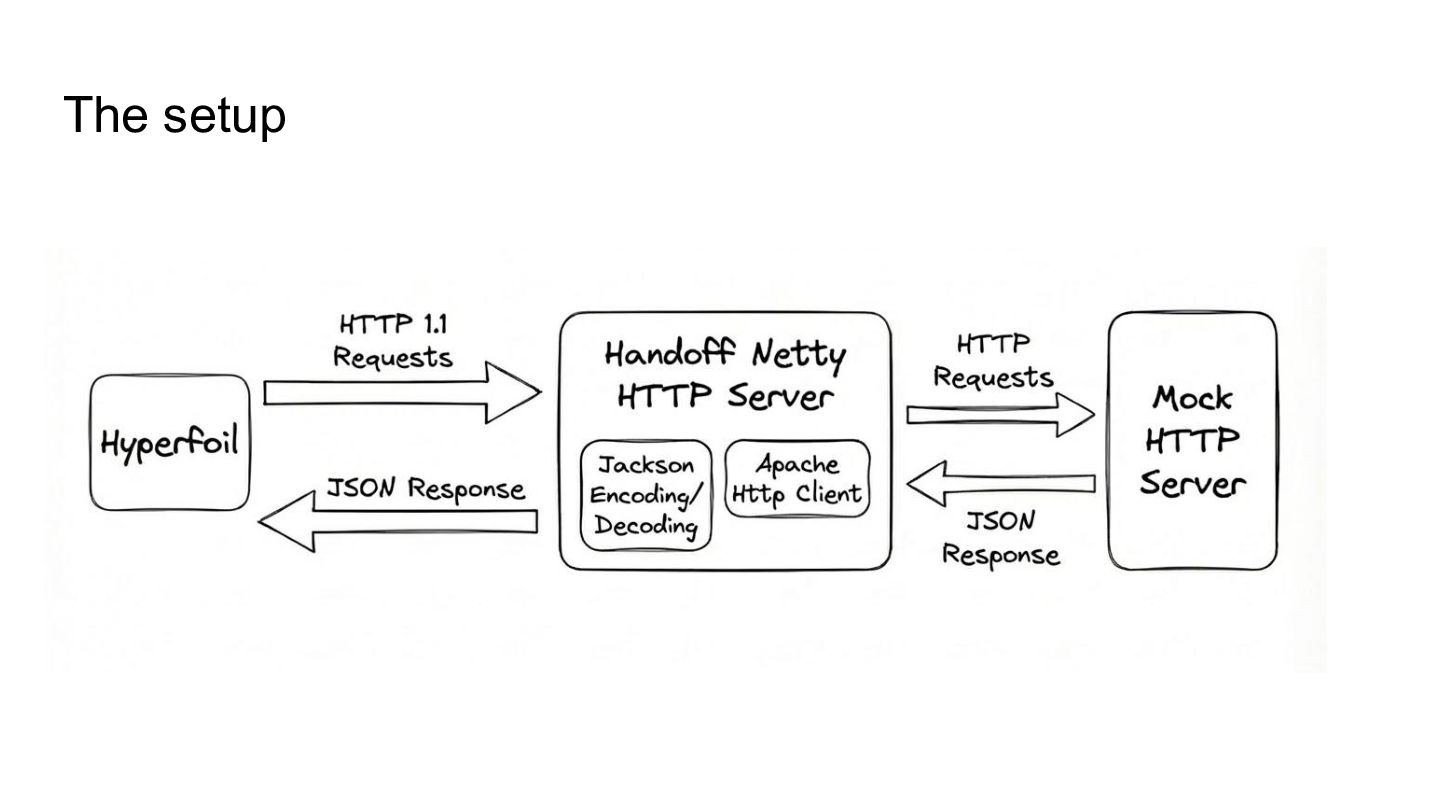
    not ideal: we need MORE control! • Let’s create a setup which resemble the original benchmark • Just Netty + Jackson + blocking Http client
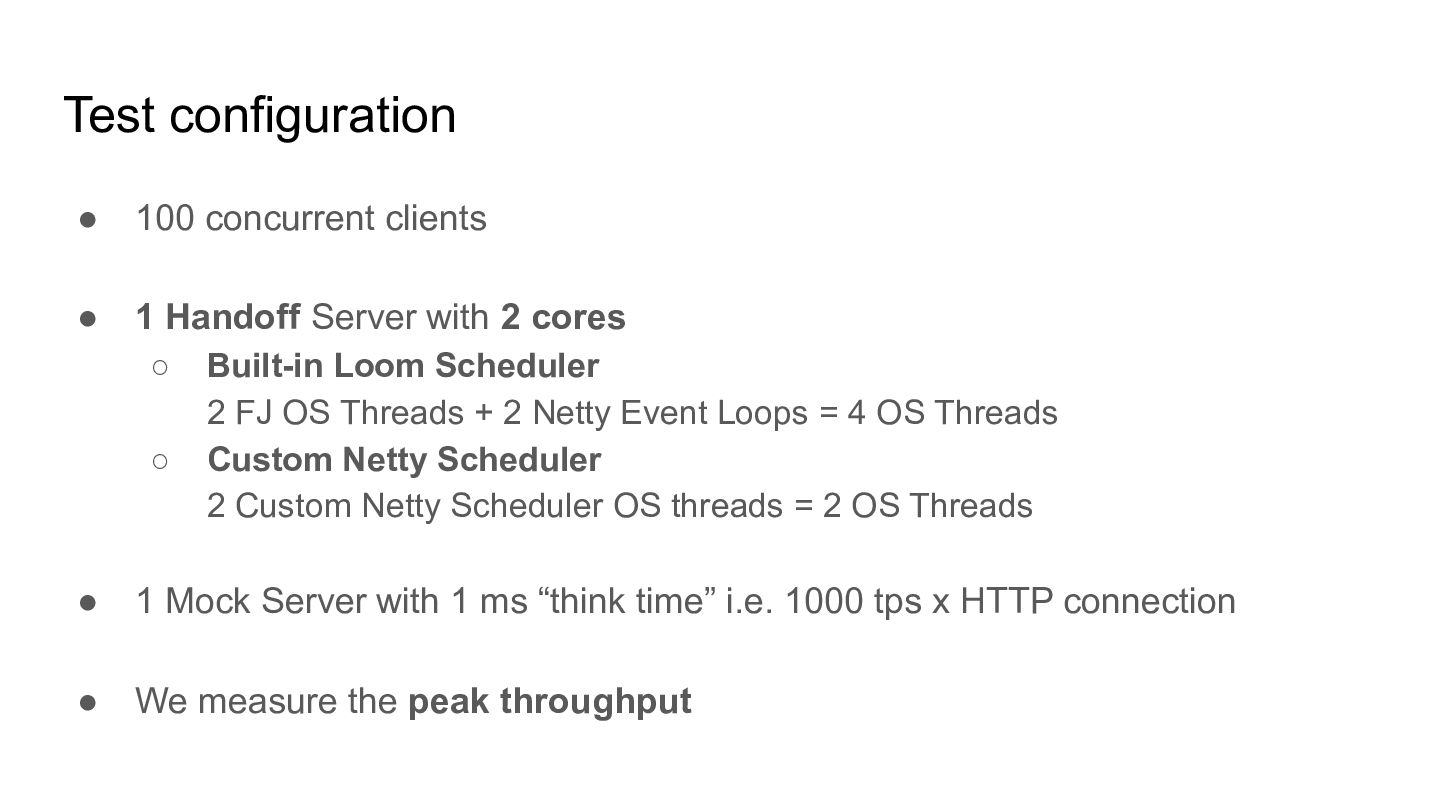
  12. Test configuration • 100 concurrent clients • 1 Handoff Server

    with 2 cores ◦ Built-in Loom Scheduler 2 FJ OS Threads + 2 Netty Event Loops = 4 OS Threads ◦ Custom Netty Scheduler 2 Custom Netty Scheduler OS threads = 2 OS Threads • 1 Mock Server with 1 ms “think time” i.e. 1000 tps x HTTP connection • We measure the peak throughput
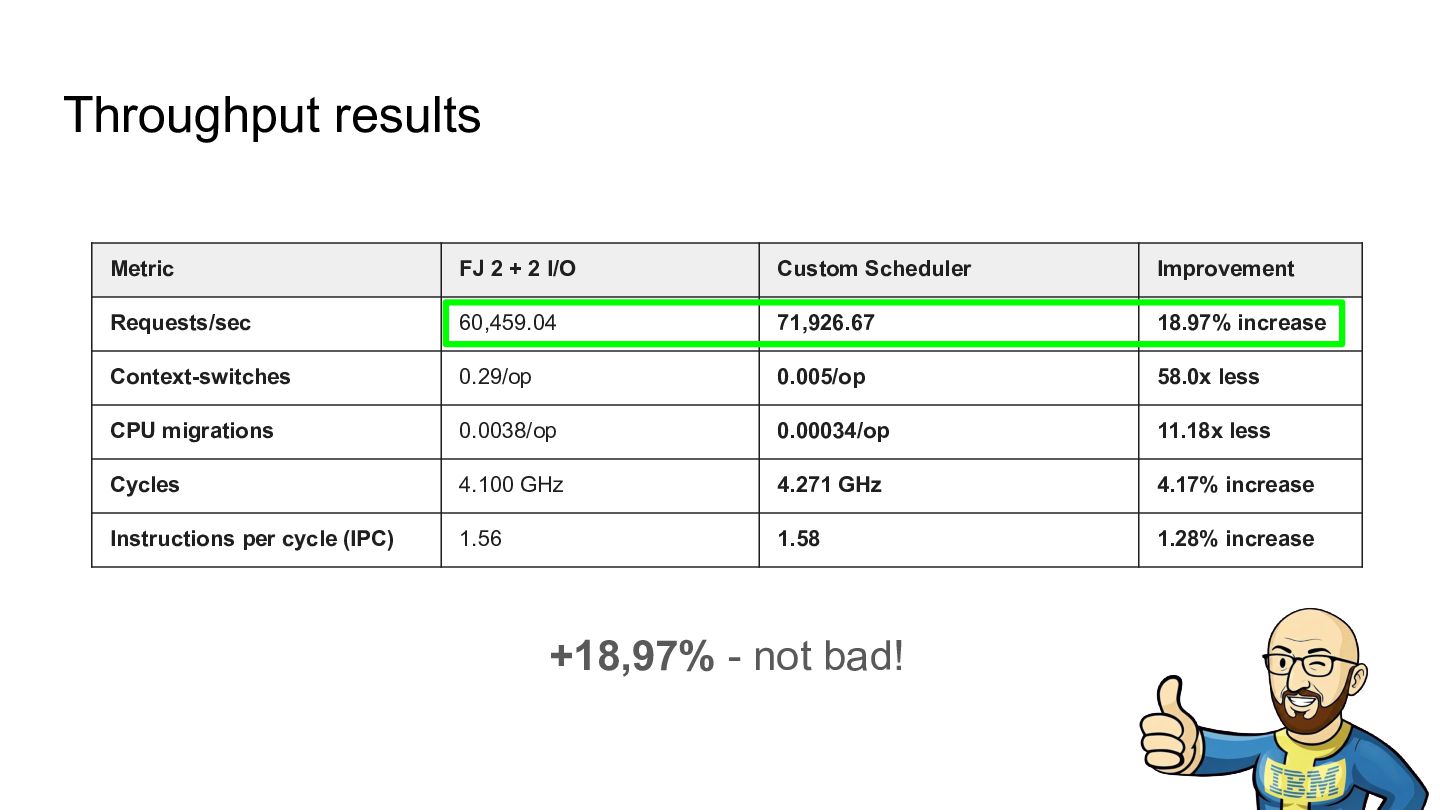
  13. Throughput results +18,97% - not bad! Metric FJ 2 +

    2 I/O Custom Scheduler Improvement Requests/sec 60,459.04 71,926.67 18.97% increase Context-switches 0.29/op 0.005/op 58.0x less CPU migrations 0.0038/op 0.00034/op 11.18x less Cycles 4.100 GHz 4.271 GHz 4.17% increase Instructions per cycle (IPC) 1.56 1.58 1.28% increase
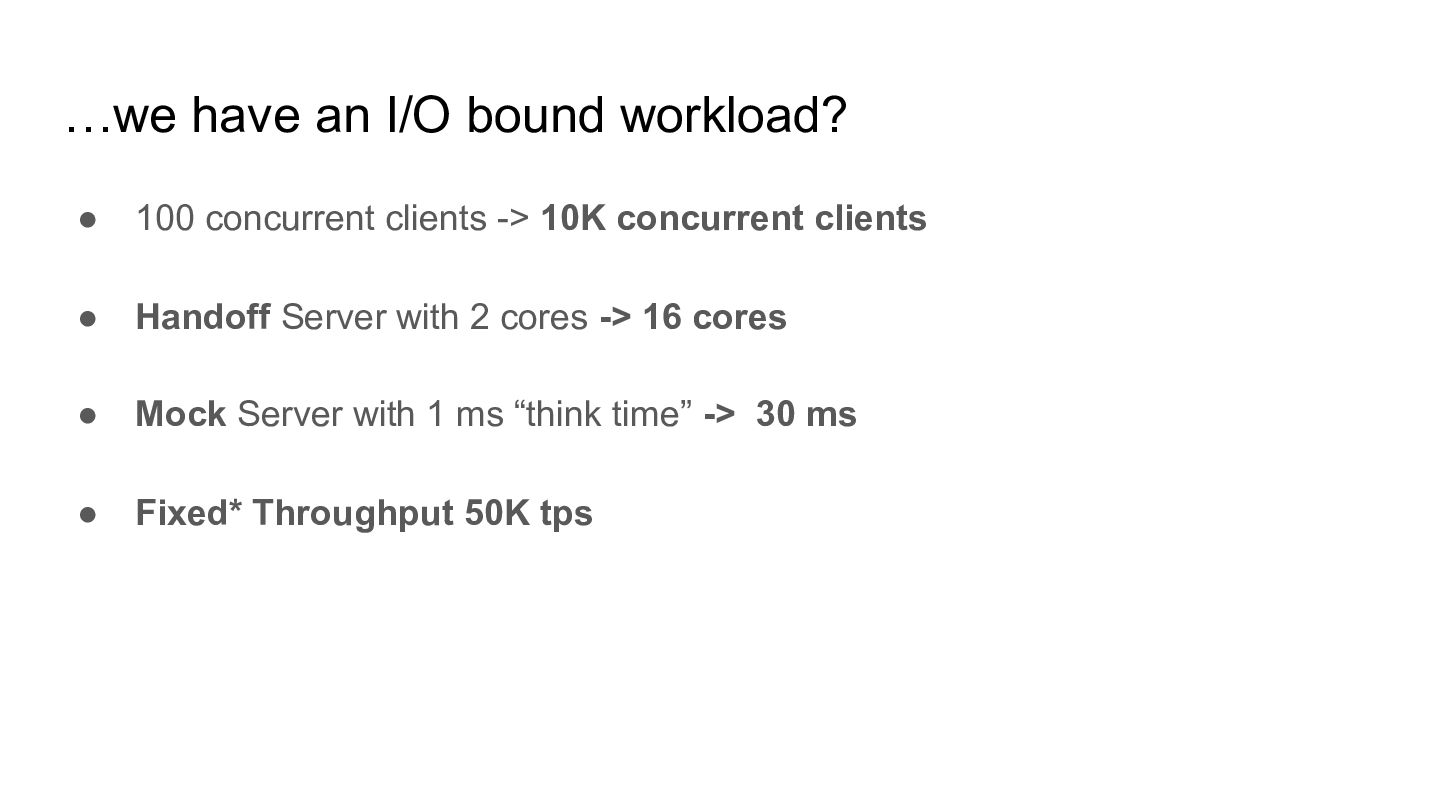
  14. …we have an I/O bound workload? • 100 concurrent clients

    -> 10K concurrent clients • Handoff Server with 2 cores -> 16 cores • Mock Server with 1 ms “think time” -> 30 ms • Fixed* Throughput 50K tps
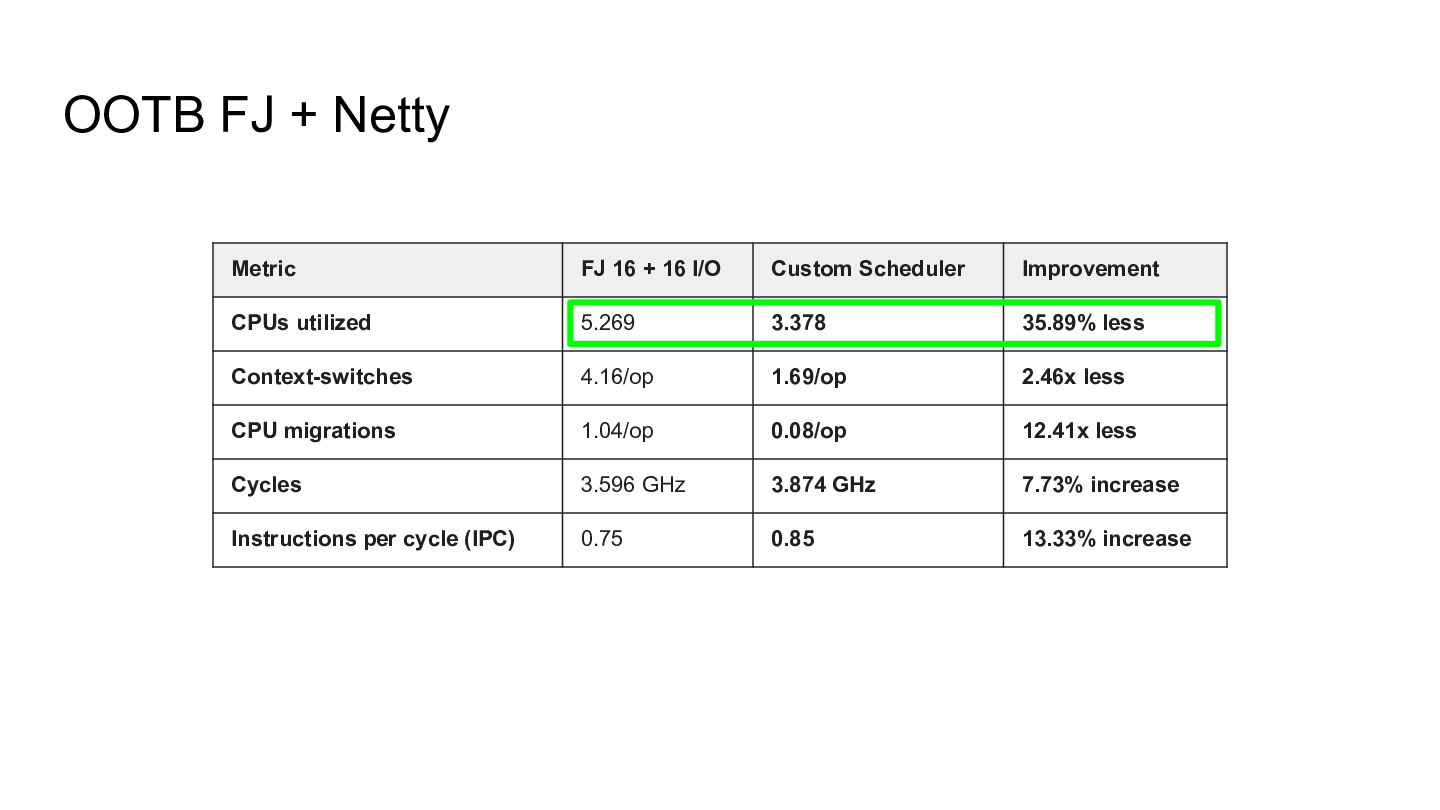
  15. Metric FJ 16 + 16 I/O Custom Scheduler Improvement CPUs

    utilized 5.269 3.378 35.89% less Context-switches 4.16/op 1.69/op 2.46x less CPU migrations 1.04/op 0.08/op 12.41x less Cycles 3.596 GHz 3.874 GHz 7.73% increase Instructions per cycle (IPC) 0.75 0.85 13.33% increase OOTB FJ + Netty
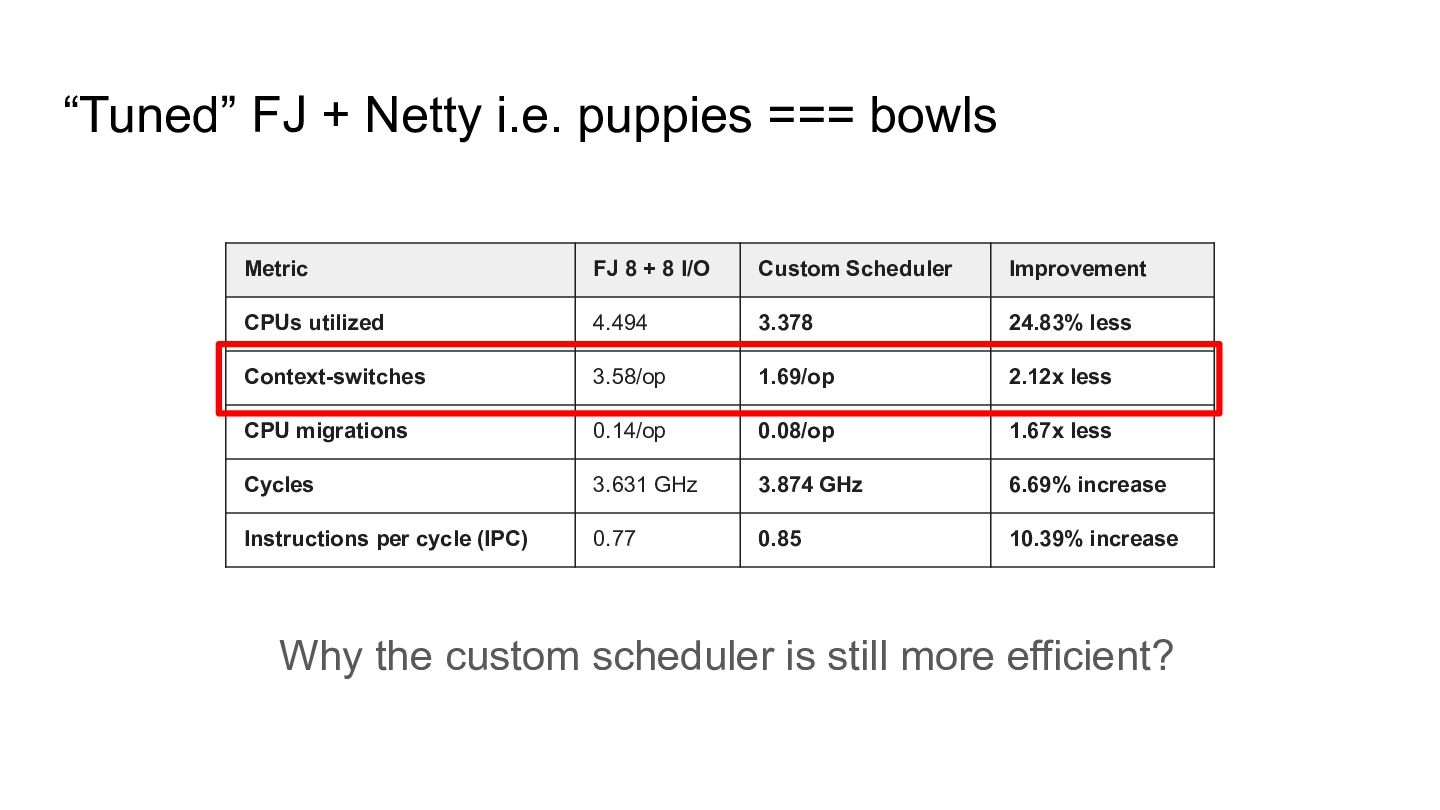
  16. Metric FJ 8 + 8 I/O Custom Scheduler Improvement CPUs

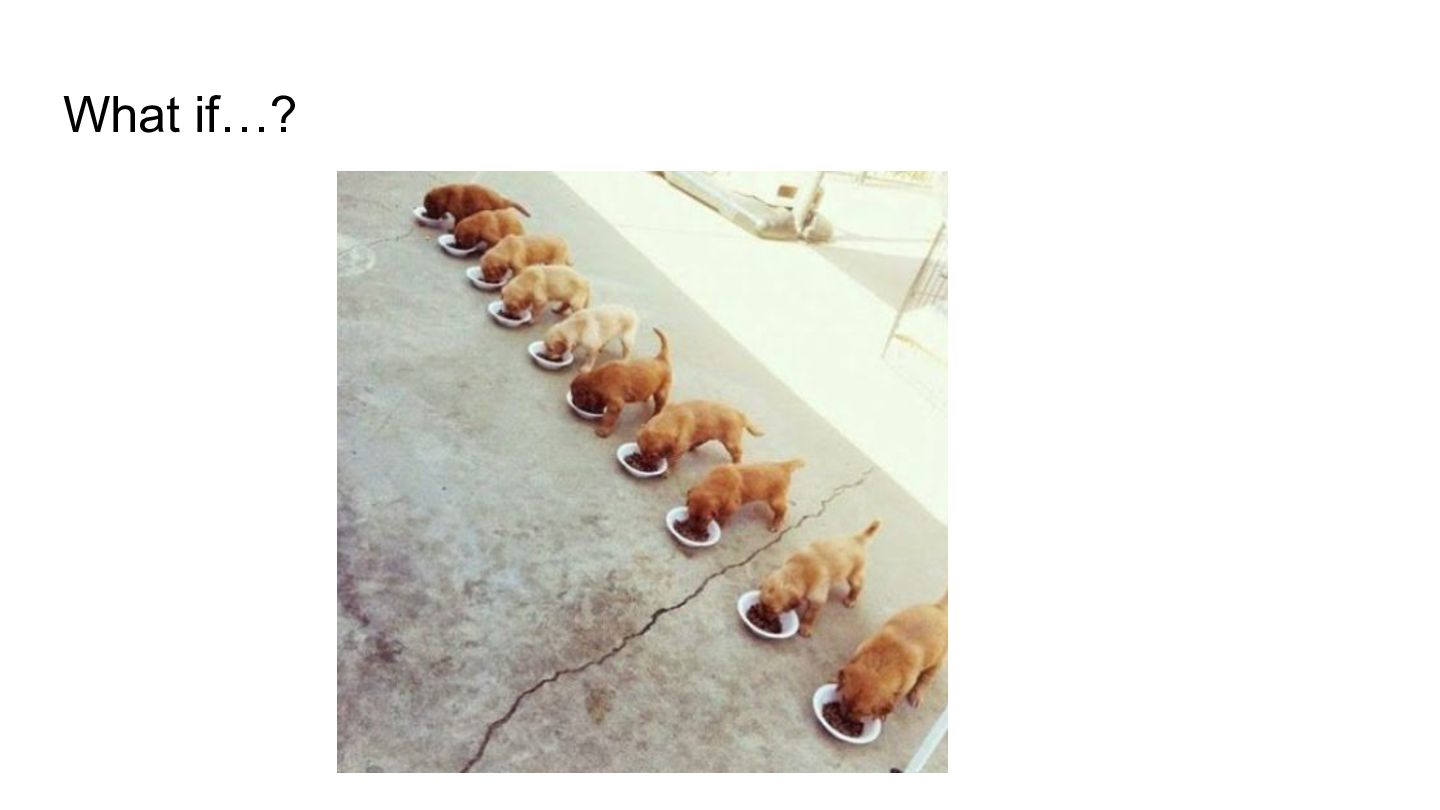
    utilized 4.494 3.378 24.83% less Context-switches 3.58/op 1.69/op 2.12x less CPU migrations 0.14/op 0.08/op 1.67x less Cycles 3.631 GHz 3.874 GHz 6.69% increase Instructions per cycle (IPC) 0.77 0.85 10.39% increase “Tuned” FJ + Netty i.e. puppies === bowls Why the custom scheduler is more efficient?
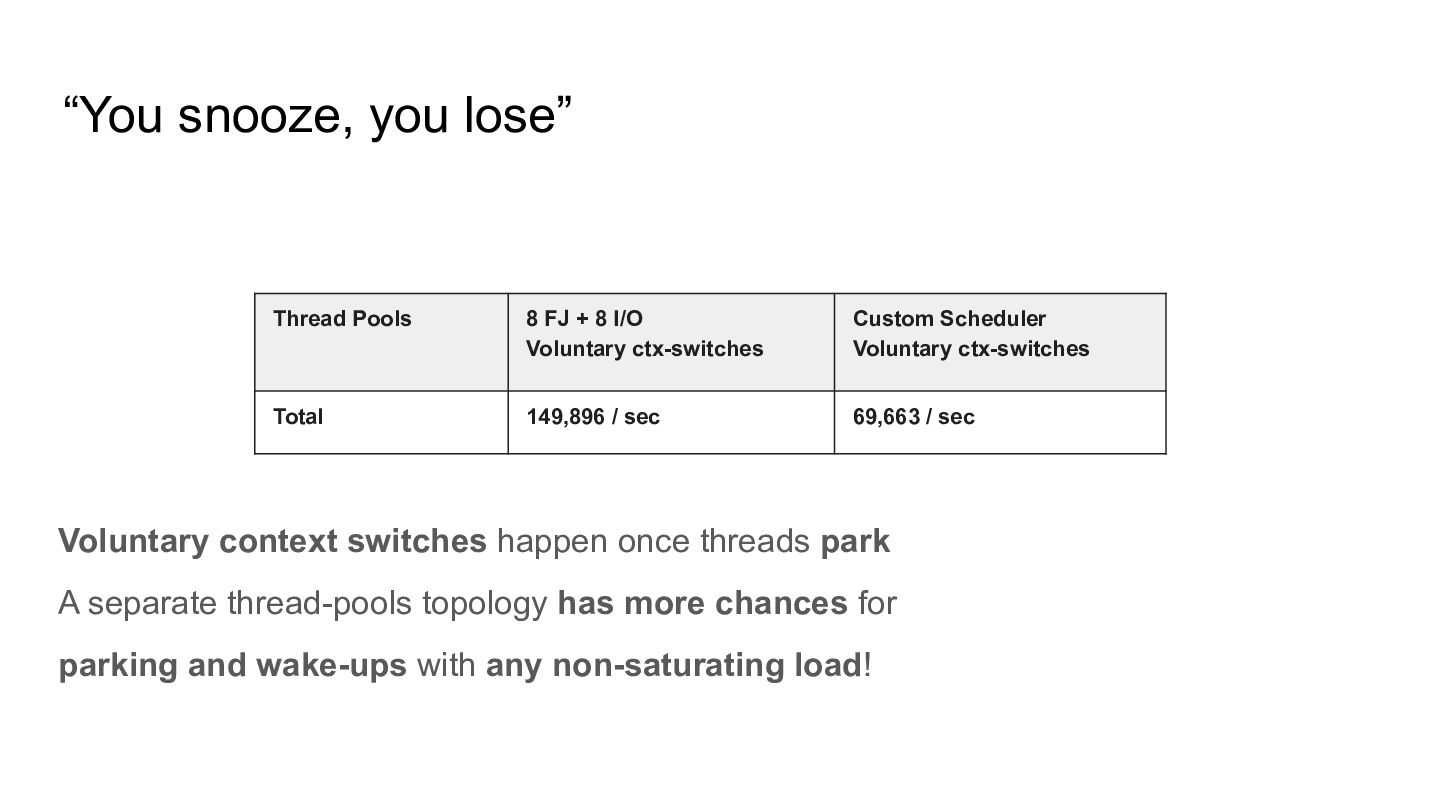
  17. Thread Pools 8 FJ + 8 I/O Voluntary ctx-switches Custom

    Scheduler Voluntary ctx-switches Total 149,896 / sec 69,663 / sec “You snooze, you lose” Voluntary context switches happen once threads park: separate thread-pools increases the chance of parking and wake-ups at any load
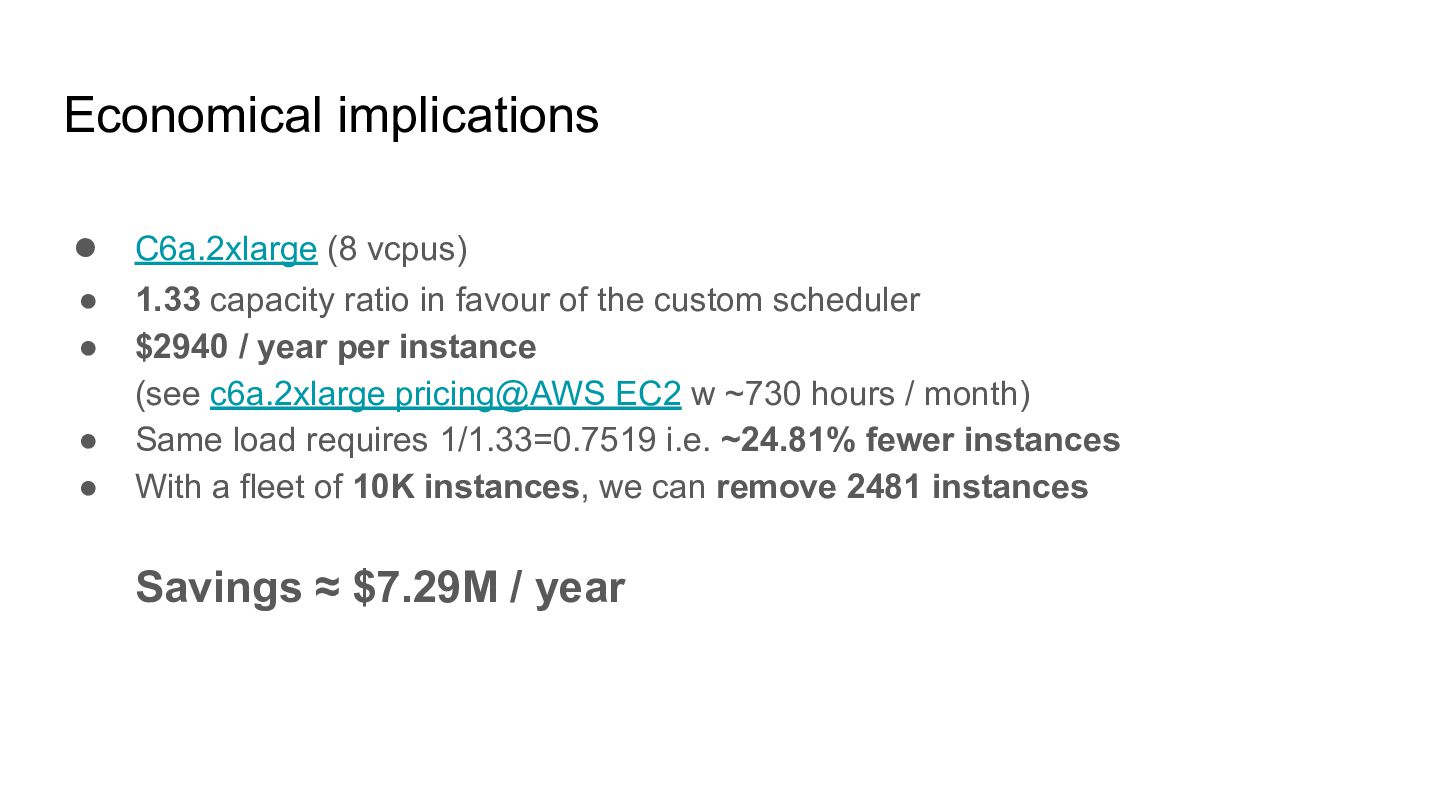
  18. Economical implications • C6a.2xlarge (8 vcpus) • 1.33 capacity ratio

    in favour of the custom scheduler • $2940 / year per instance (see c6a.2xlarge pricing@AWS EC2 w ~730 hours / month) • Same load requires 1/1.33=0.7519 i.e. ~24.81% fewer instances • With a fleet of 10K instances, we can remove 2481 instances Savings ≈ $7.29M / year
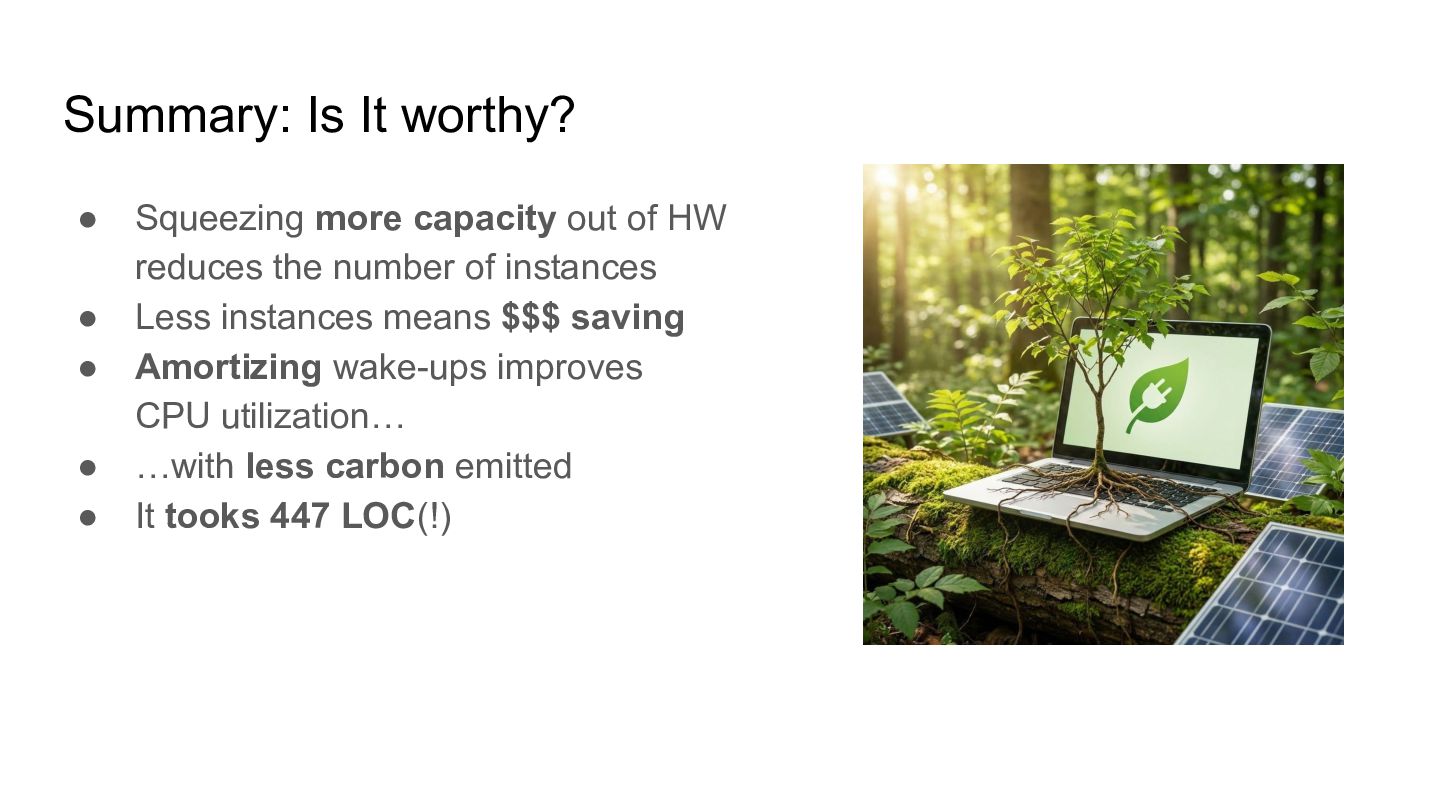
  19. Summary: Is It worthy? • Squeezing more capacity out of

    HW reduces the number of instances • Less instances means $$$ saving • It improves CPU utilization… • …with less carbon emitted
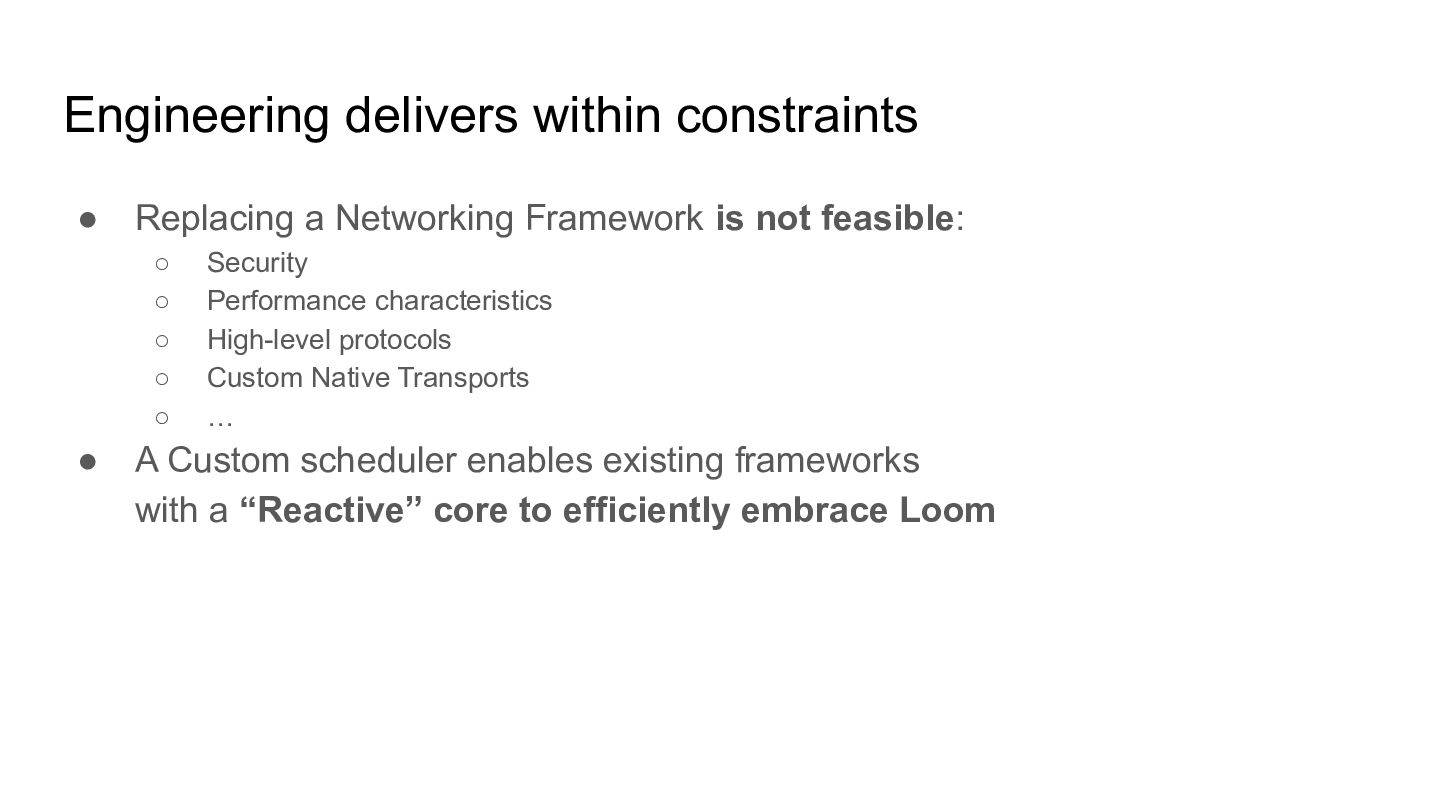
  20. Engineering delivers within constraints • Replacing a Networking Framework is

    not feasible: ◦ Security, Performance characteristics, Custom Native Transports • A Custom Scheduler enables existing frameworks with a “Reactive” core to efficiently embrace Loom …but it is the only way?
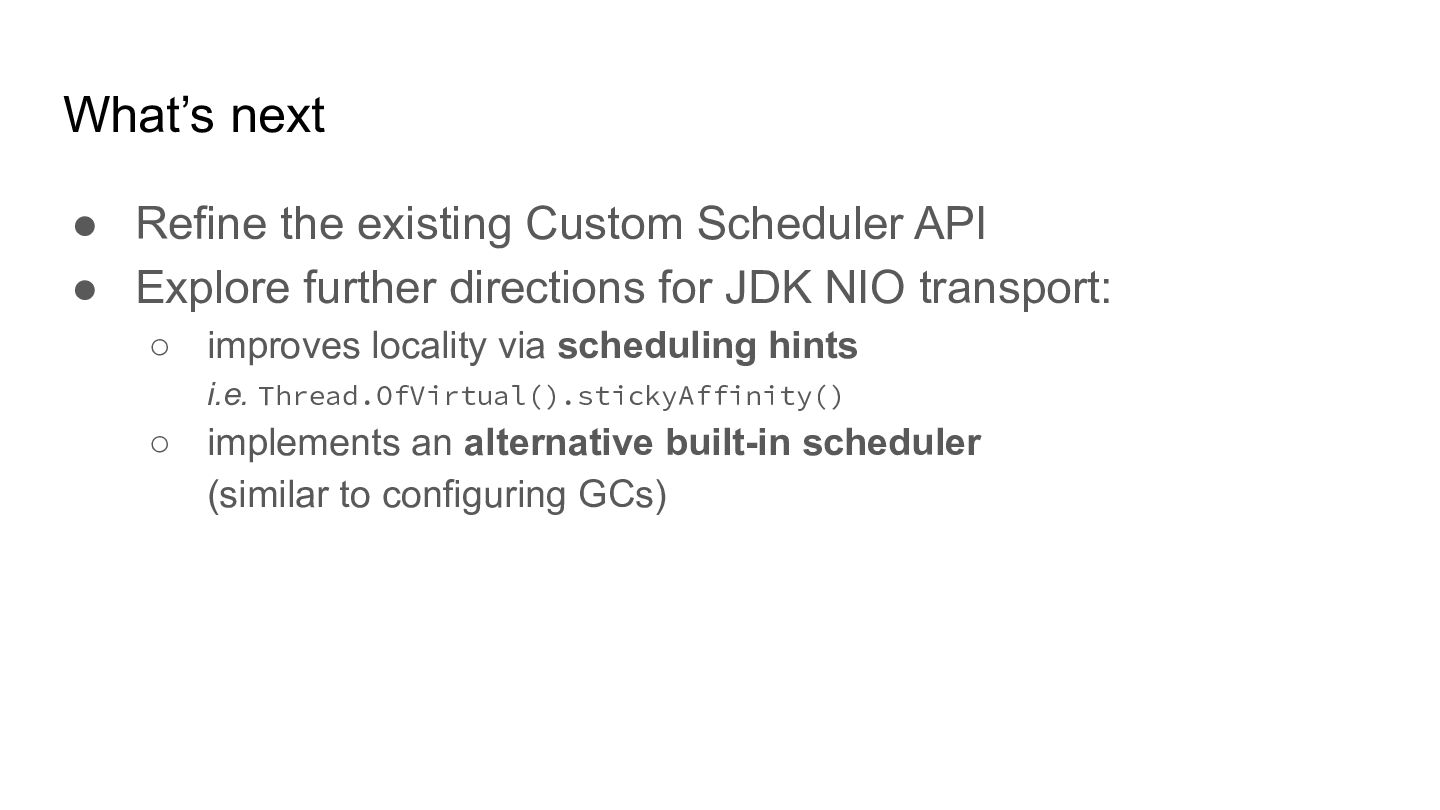
  21. What’s next • Refine the existing Custom Scheduler API •

    Explore further directions for JDK NIO transport: ◦ improves locality via scheduling hints i.e. Thread.OfVirtual().stickyAffinity() ◦ implements an alternative built-in scheduler (similar to configuring GCs)
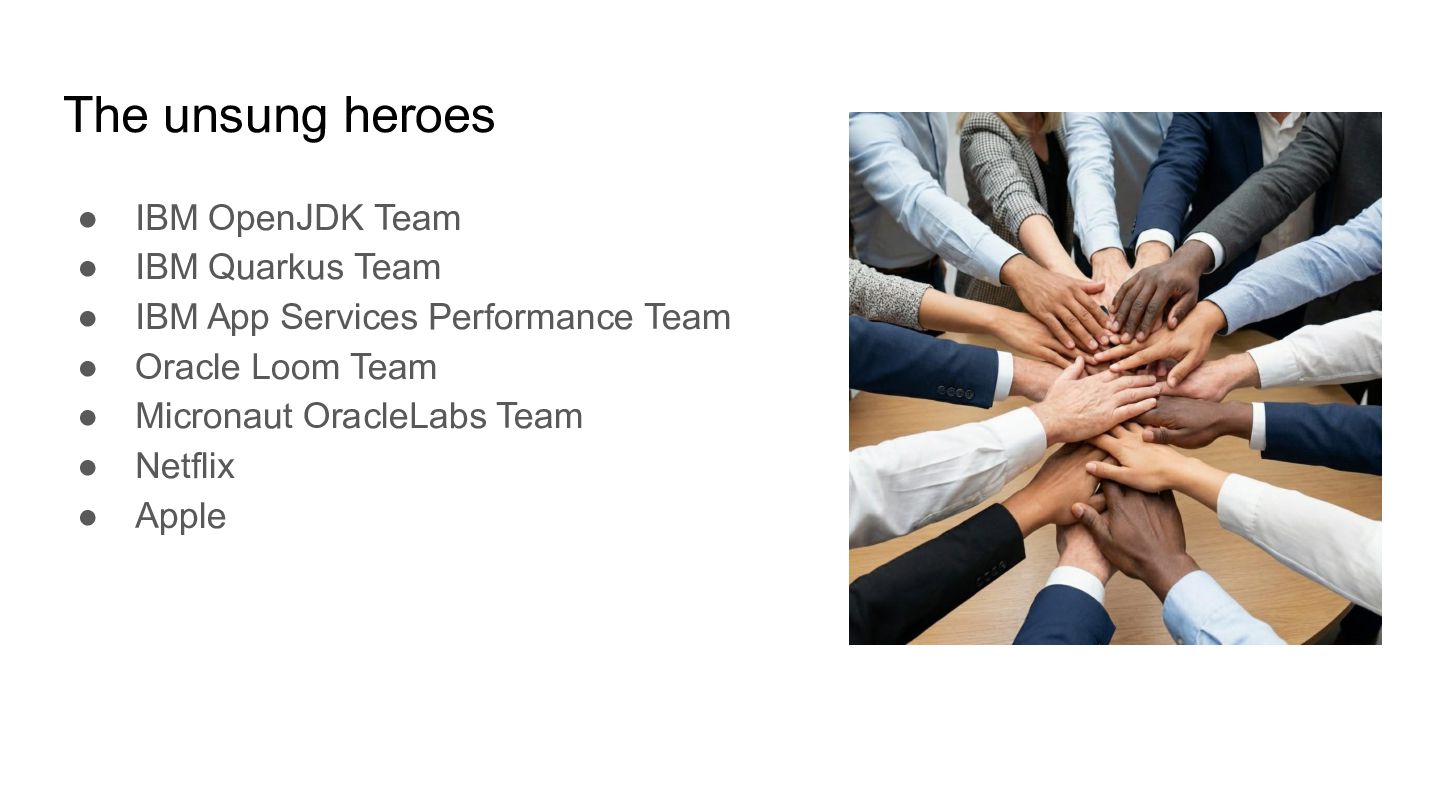
  22. The unsung heroes • IBM OpenJDK Team • IBM Quarkus

    Team • IBM App Services Performance Team • Oracle Loom Team • Micronaut Team • Netflix • Apple • My wife