Upgrade to Pro — share decks privately, control downloads, hide ads and more …

Google Data Studio 101

arm4
November 18, 2021

Google Data Studio 101

Introducing Google Data Studio.

arm4

November 18, 2021
Tweet

More Decks by arm4

Other Decks in Technology

Transcript

  1. • Software Engineer • Lead of recruitment marketing team for

    devs. • Joined ANDPAD in April 2021 🎉 I LOVE K-POP and Korean Drama!! 最近のおすすめはNetflixの”マイネーム” Yoko Hato Self Introduce
  2. 1. What kind of tool is it ? 2. Effective

    use cases in general office work 3. Benefits of using Google Data Studio Presenting the structure of my presentation
  3. Introduction of Overview I expected that we would aggregate the

    data weekly and not monthly for our analysis !! Me
  4. What kind of tool is Google Data Studio 2016 The

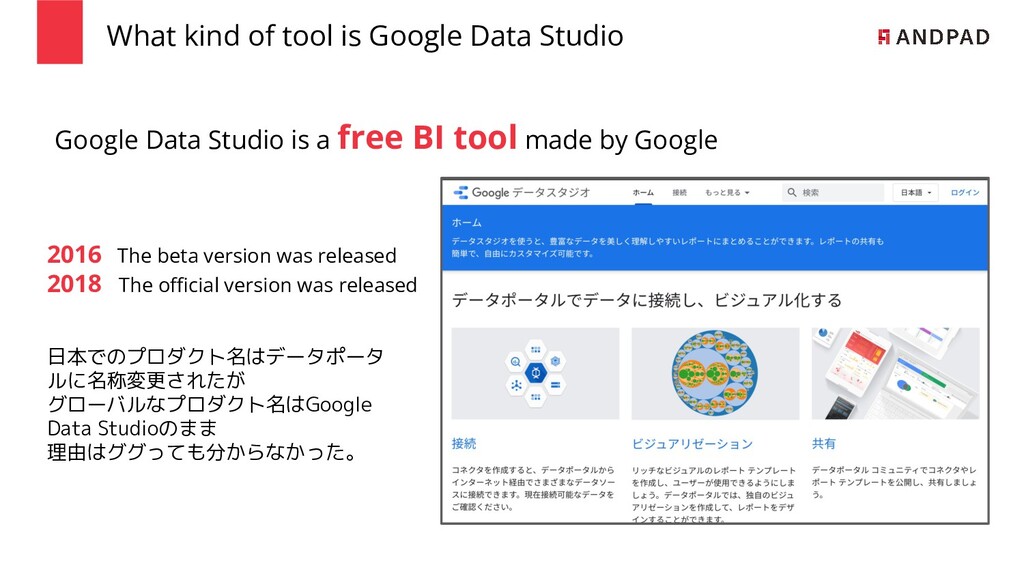
    beta version was released 2018 The official version was released Google Data Studio is a free BI tool made by Google 日本でのプロダクト名はデータポータ ルに名称変更されたが グローバルなプロダクト名はGoogle Data Studioのまま 理由はググっても分からなかった。
  5. What is a BI tool ? Tableau is a well

    known BI tool Business Intelligence A tool that can visualize data from various sources and helps analysis and decision making in business. Also called • Dashboard tool • Reporting tool
  6. Types of data sources that can be used Easily access

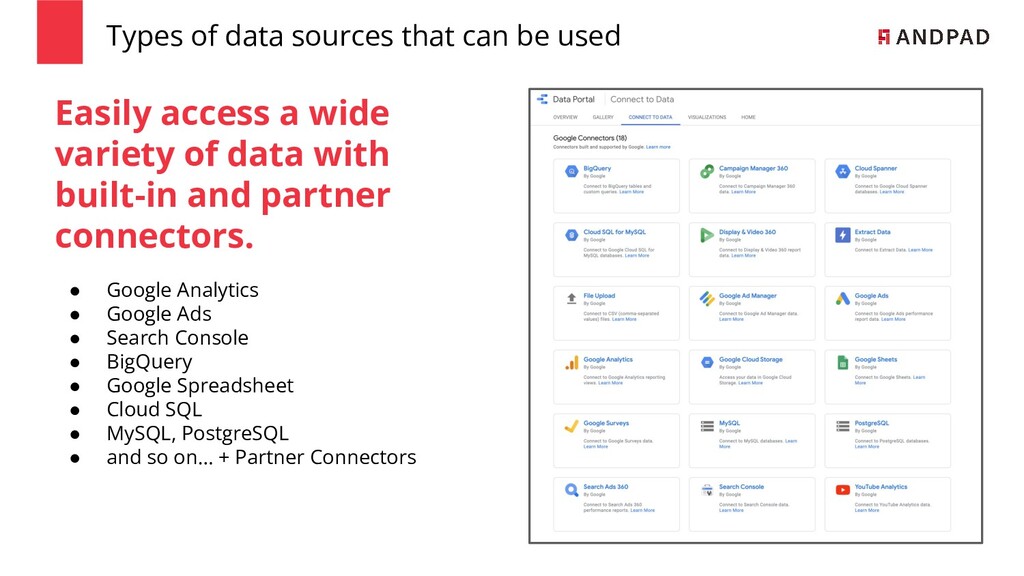
    a wide variety of data with built-in and partner connectors. • Google Analytics • Google Ads • Search Console • BigQuery • Google Spreadsheet • Cloud SQL • MySQL, PostgreSQL • and so on… + Partner Connectors
  7. Effective use cases in general office work Extracted data can

    be seen by Any Person But, the allowed person has to extract data every time !!!
  8. Let me describe a sample workflow 2. Upload it in

    a private limited directory on Google Drive Set auto transform option in the Google Drive config
  9. Benefits of using GDS 1. Viewer users can export data

    to Google spreadsheets and PDF 2. Able to give customizations to data sources by custom calculated fields 3. “Functions” similar to BigQuery SQL are provided 4. Viewer users can change aggregation range dynamically 5. Various data sources can be displayed in one report
  10. Important information for the audience WE ARE HIRING !!! Recruitment

    Information on Github https://tech.andpad.co.jp/ https://github.com/andpad-dev/recruit