Upgrade to Pro — share decks privately, control downloads, hide ads and more …

Instrumenting Devices, Global Data

Avatar for Guy Guy
May 22, 2017

Instrumenting Devices, Global Data

Measuring the Global Internet for your application engineering purposes doesn't need to be scary - here's how we did it at Netflix with SmartTVs and Smartphones.

Avatar for Guy

Guy

May 22, 2017

Other Decks in Technology

Transcript

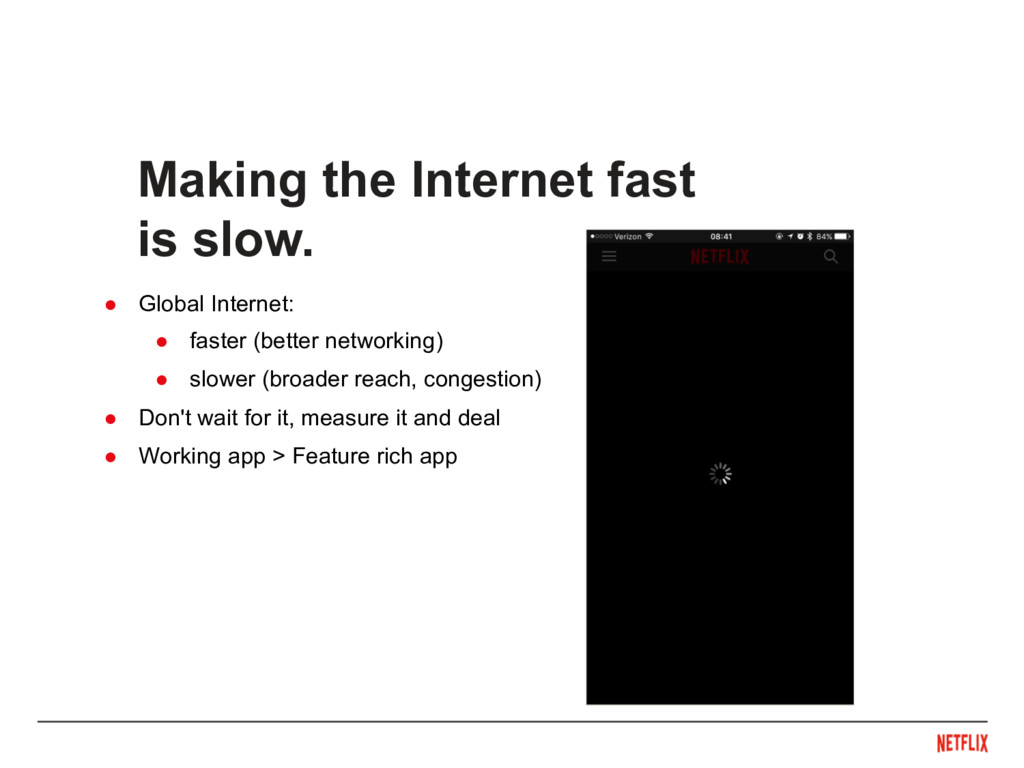
  1. •  Global Internet: •  faster (better networking) •  slower (broader

    reach, congestion) •  Don't wait for it, measure it and deal •  Working app > Feature rich app Making the Internet fast is slow.
  2. We need to know what the Internet looks like, without

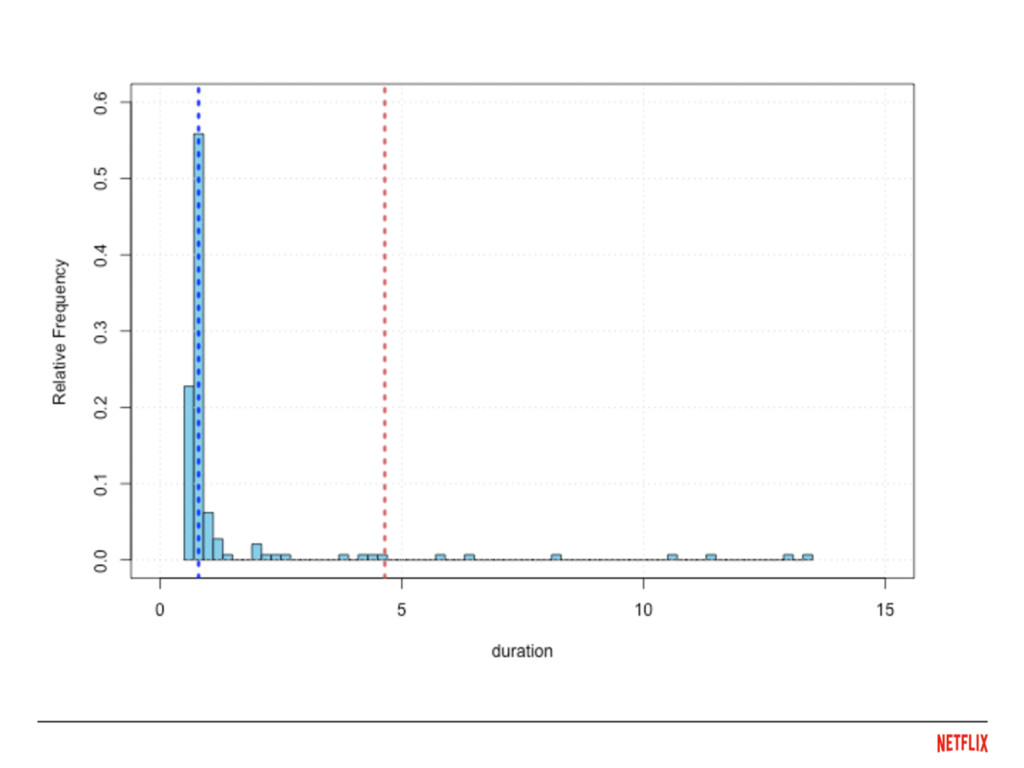
    averages, seeing the full distribution.
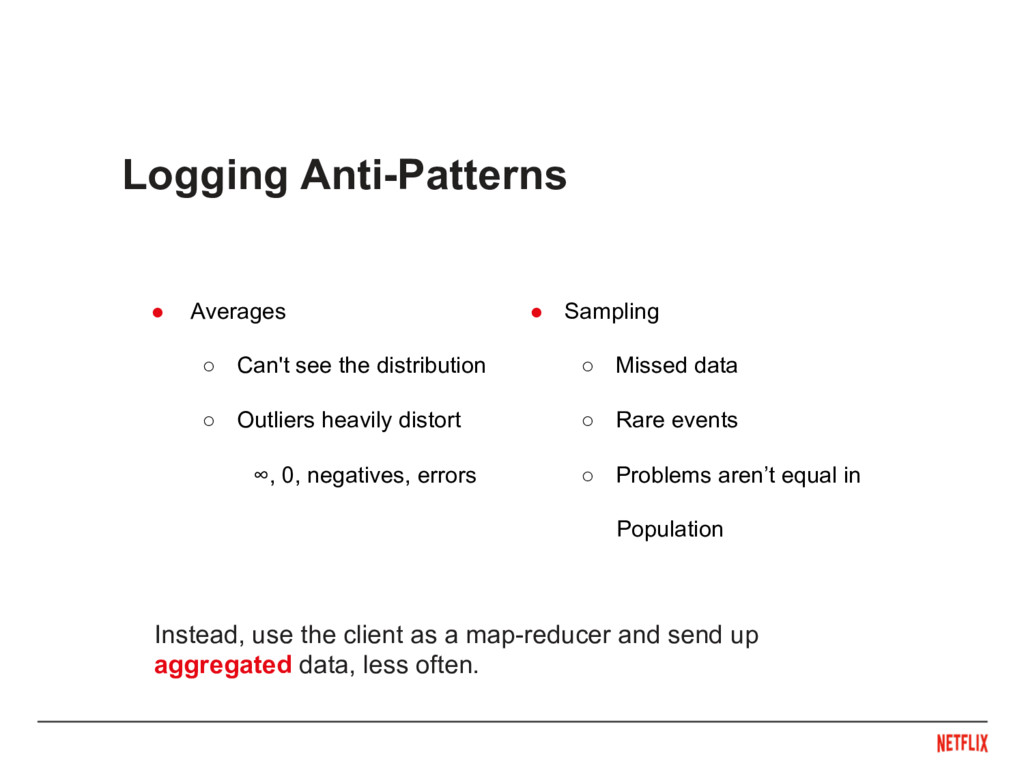
  3. •  Sampling ◦  Missed data ◦  Rare events ◦  Problems

    aren’t equal in Population •  Averages ◦  Can't see the distribution ◦  Outliers heavily distort ∞, 0, negatives, errors Logging Anti-Patterns Instead, use the client as a map-reducer and send up aggregated data, less often.
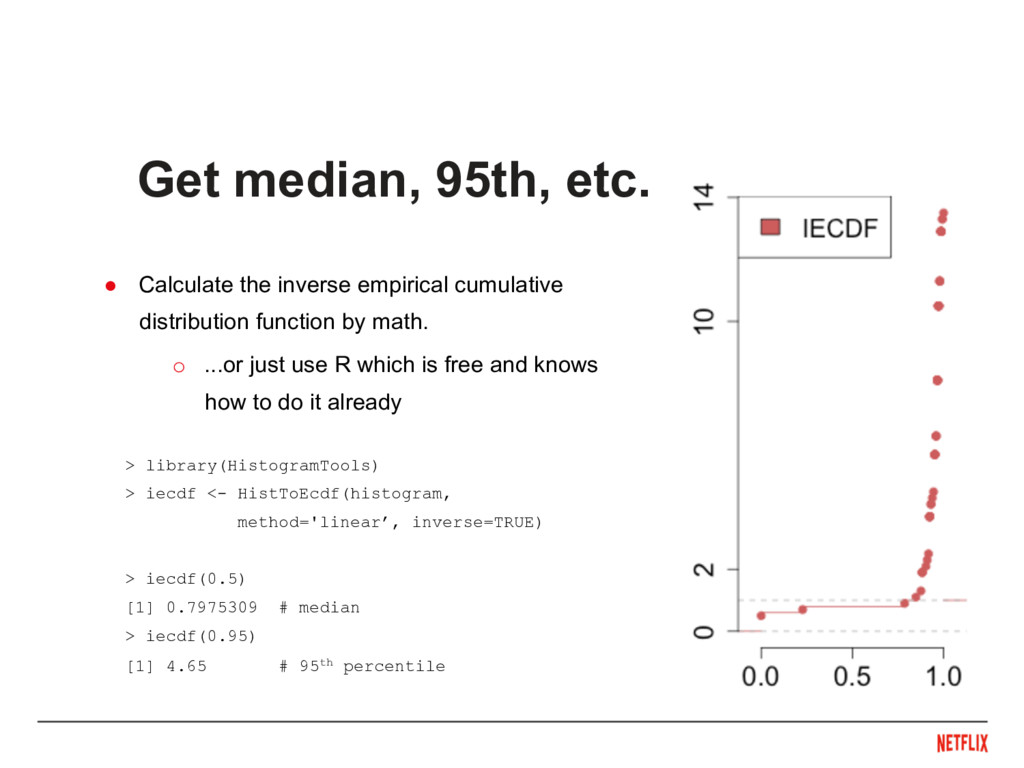
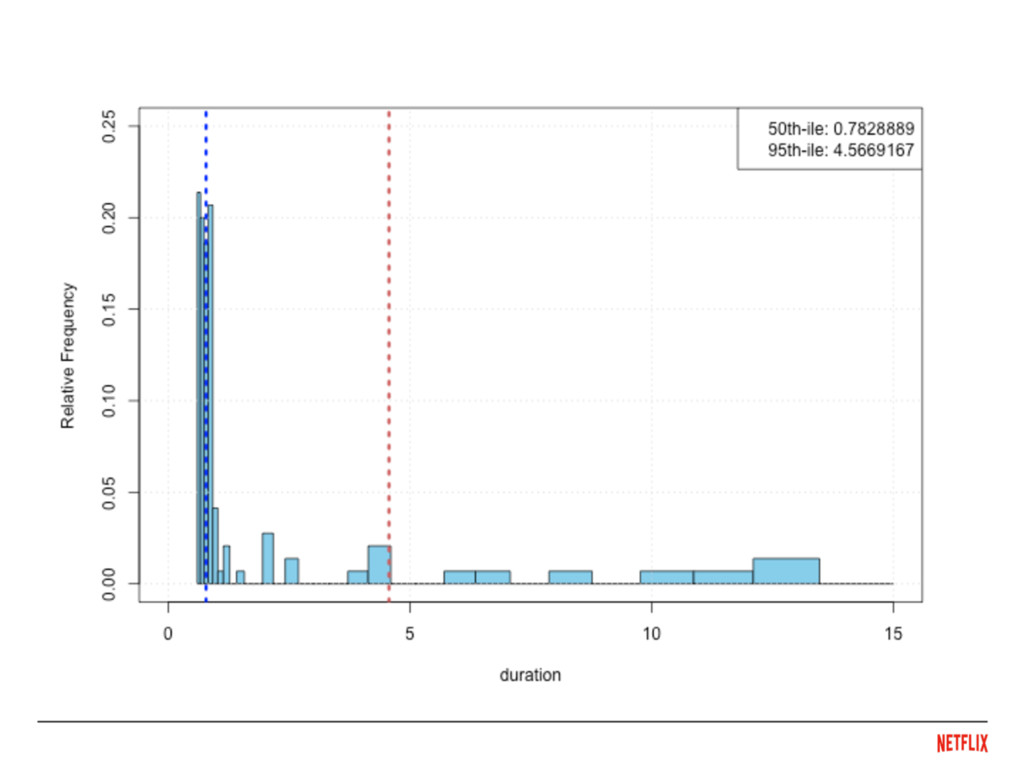
  4. •  Calculate the inverse empirical cumulative distribution function by math.

    Get median, 95th, etc. > library(HistogramTools) > iecdf <- HistToEcdf(histogram, method='linear’, inverse=TRUE) > iecdf(0.5) [1] 0.7975309 # median > iecdf(0.95) [1] 4.65 # 95th percentile o  ...or just use R which is free and knows how to do it already
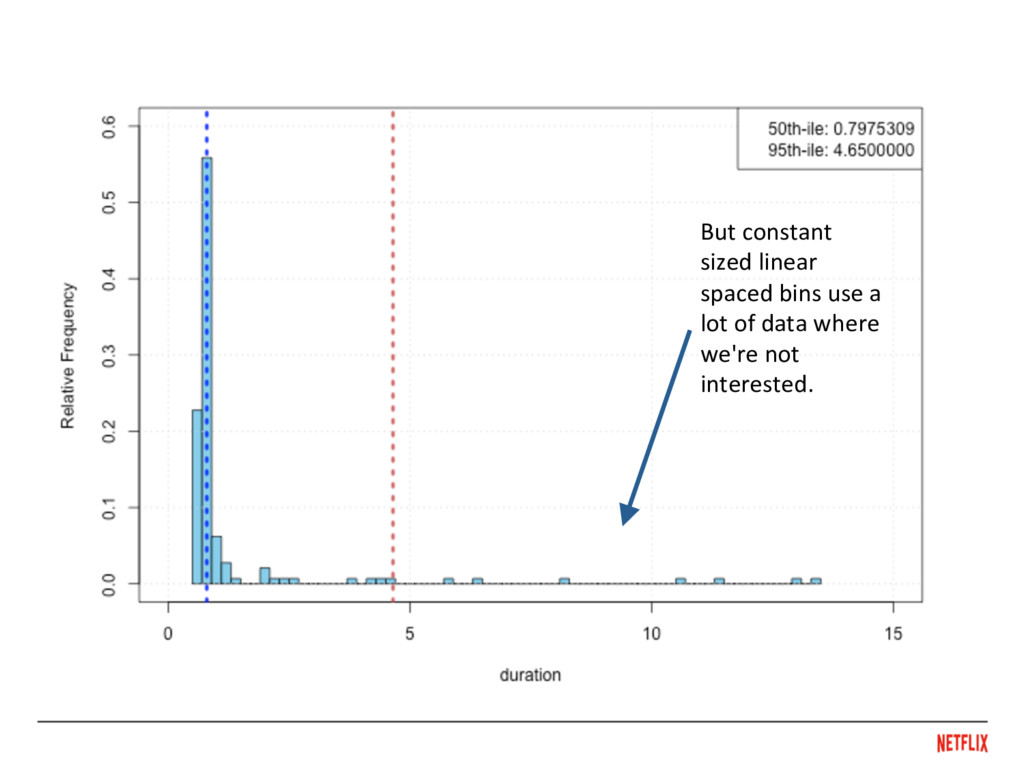
  5. But constant sized linear spaced bins use a lot of

    data where we're not interested.
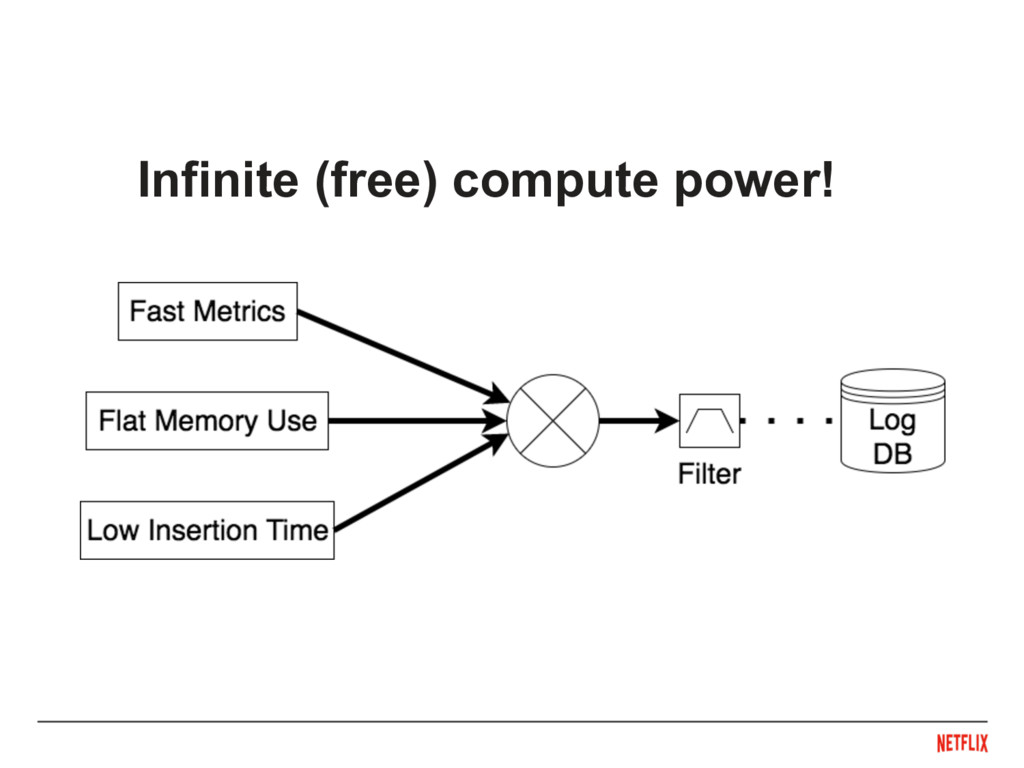
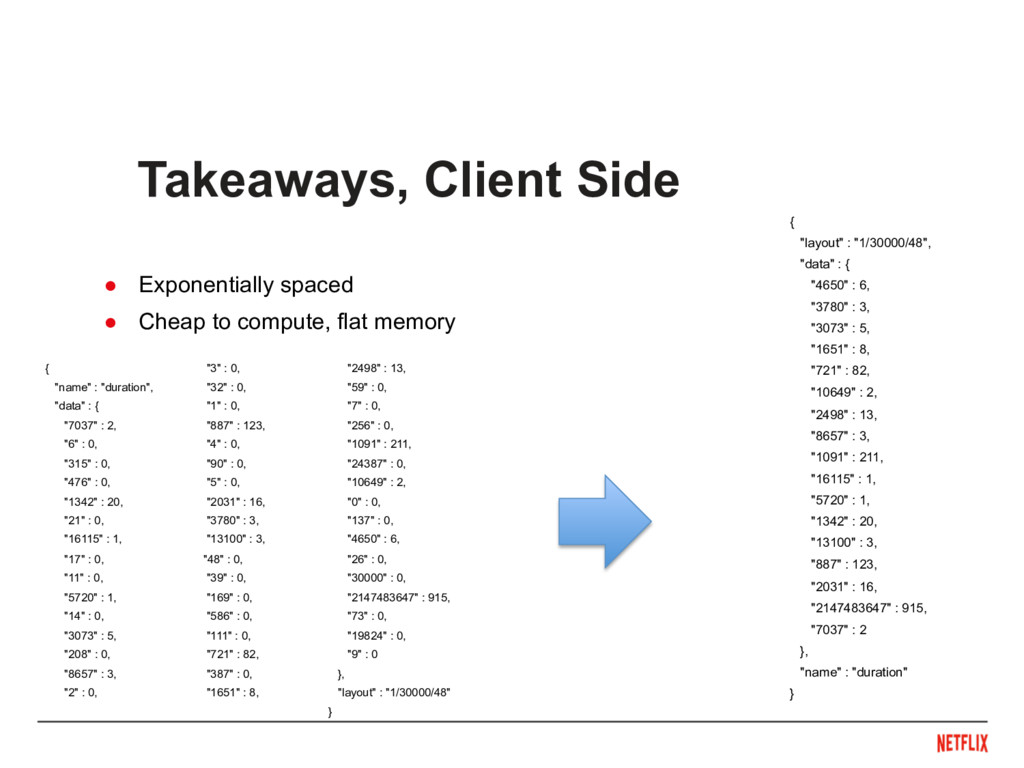
  6. •  Exponentially spaced •  Cheap to compute, flat memory Takeaways,

    Client Side { "name" : "duration", "data" : { "7037" : 2, "6" : 0, "315" : 0, "476" : 0, "1342" : 20, "21" : 0, "16115" : 1, "17" : 0, "11" : 0, "5720" : 1, "14" : 0, "3073" : 5, "208" : 0, "8657" : 3, "2" : 0, "3" : 0, "32" : 0, "1" : 0, "887" : 123, "4" : 0, "90" : 0, "5" : 0, "2031" : 16, "3780" : 3, "13100" : 3, "48" : 0, "39" : 0, "169" : 0, "586" : 0, "111" : 0, "721" : 82, "387" : 0, "1651" : 8, "2498" : 13, "59" : 0, "7" : 0, "256" : 0, "1091" : 211, "24387" : 0, "10649" : 2, "0" : 0, "137" : 0, "4650" : 6, "26" : 0, "30000" : 0, "2147483647" : 915, "73" : 0, "19824" : 0, "9" : 0 }, "layout" : "1/30000/48" } { "layout" : "1/30000/48", "data" : { "4650" : 6, "3780" : 3, "3073" : 5, "1651" : 8, "721" : 82, "10649" : 2, "2498" : 13, "8657" : 3, "1091" : 211, "16115" : 1, "5720" : 1, "1342" : 20, "13100" : 3, "887" : 123, "2031" : 16, "2147483647" : 915, "7037" : 2 }, "name" : "duration" }
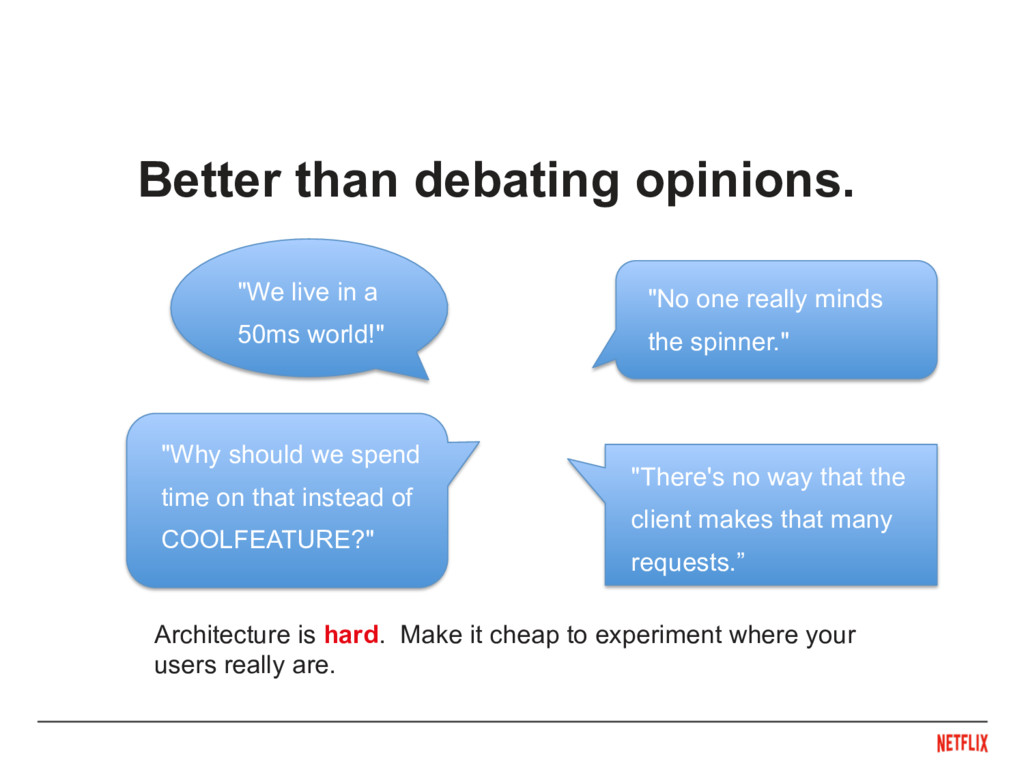
  7. Better than debating opinions. Architecture is hard. Make it cheap

    to experiment where your users really are. "There's no way that the client makes that many requests.” "No one really minds the spinner." "Why should we spend time on that instead of COOLFEATURE?" "We live in a 50ms world!"
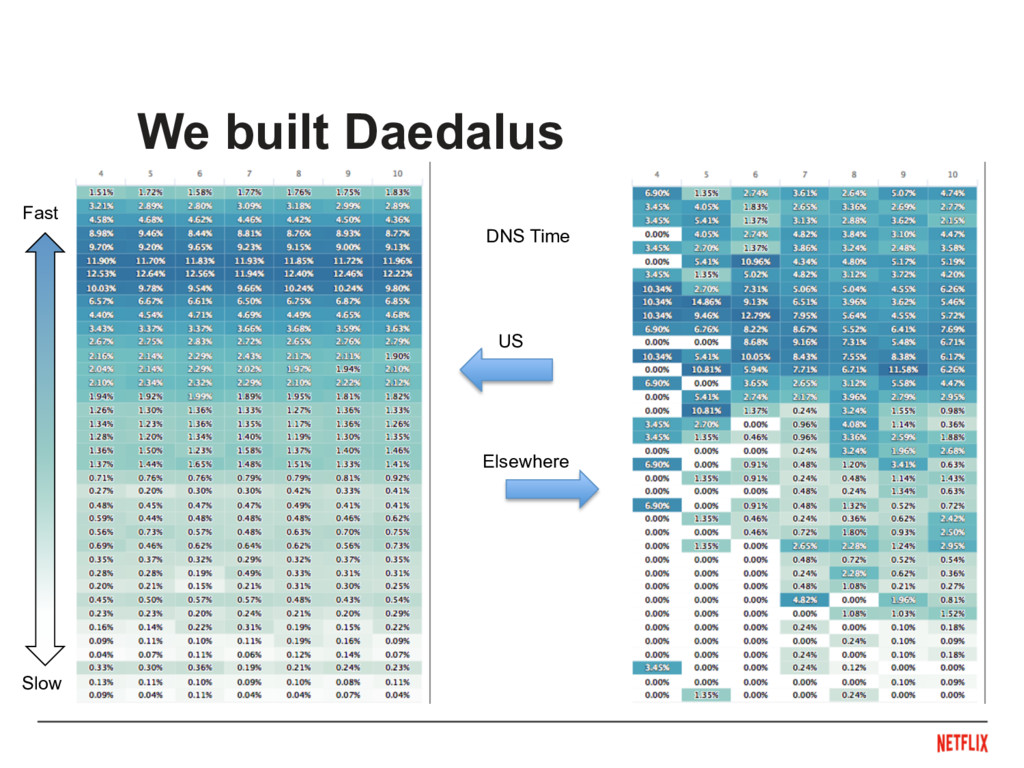
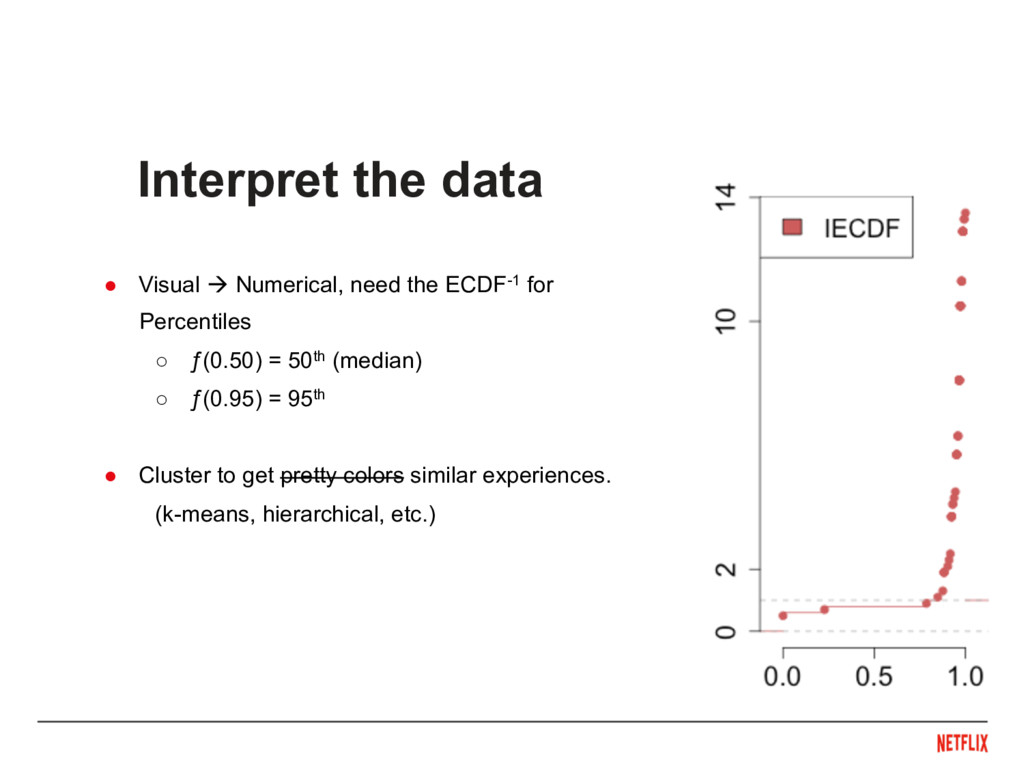
  8. •  Visual à Numerical, need the ECDF-1 for Percentiles ◦ 

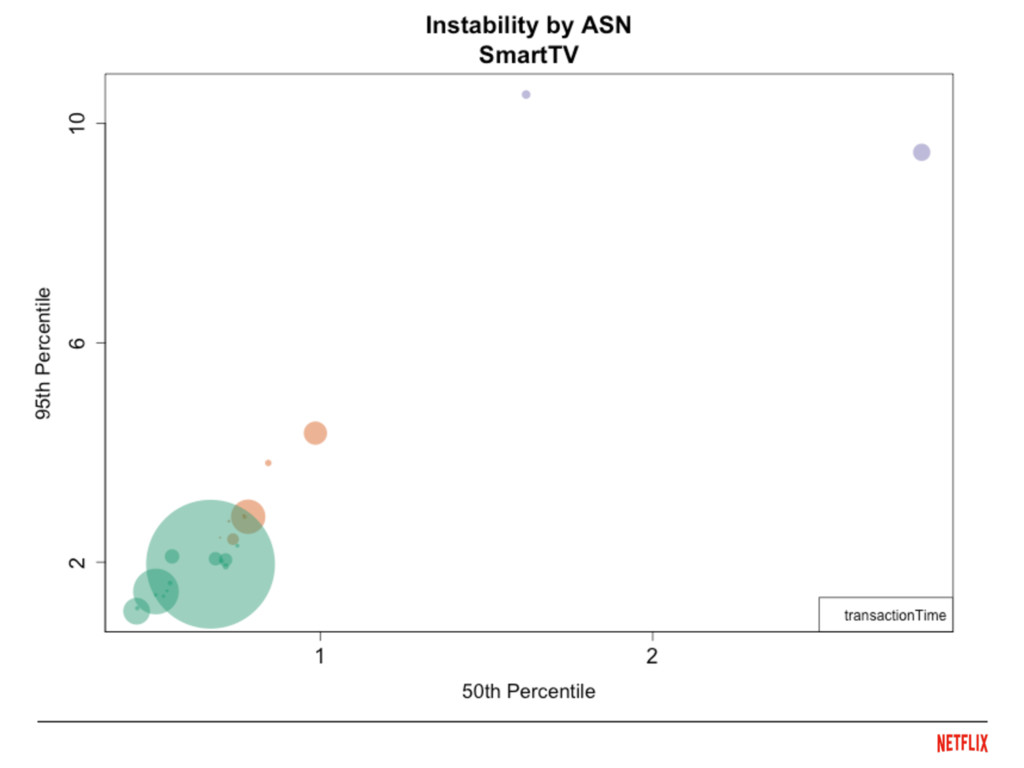
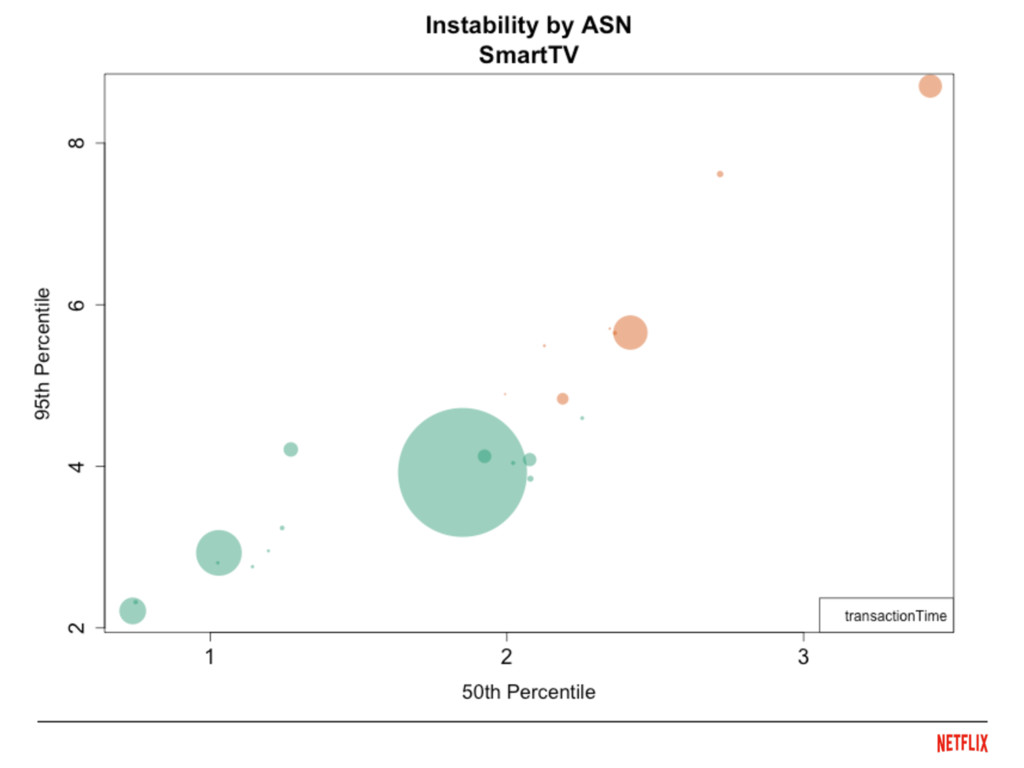
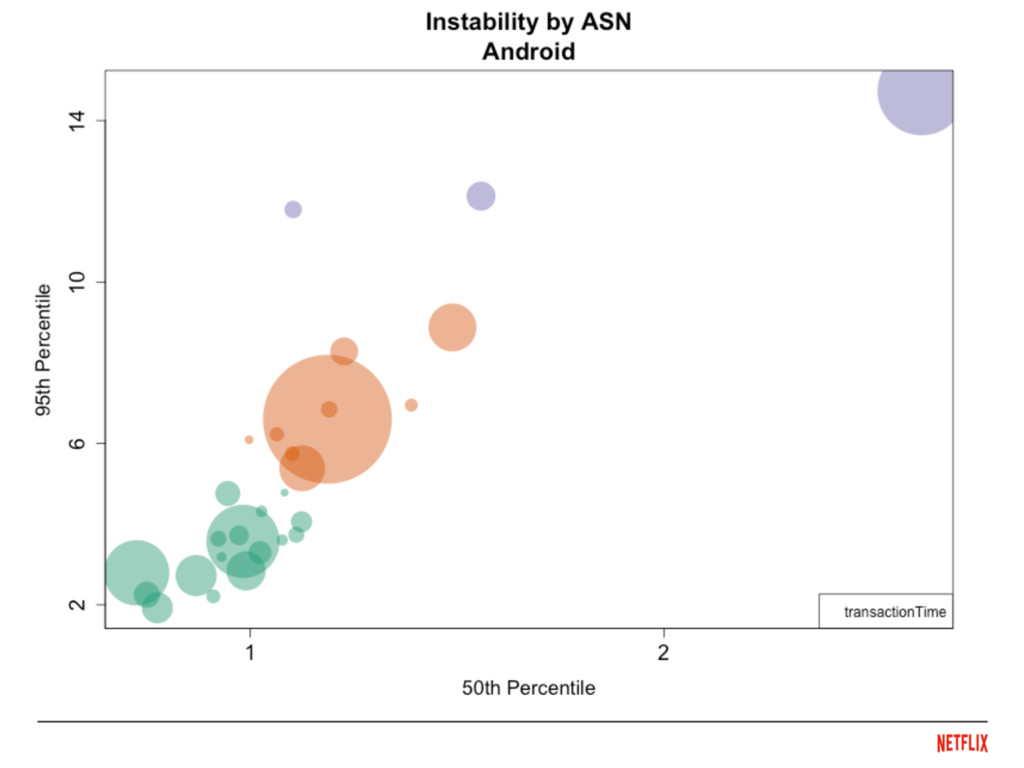
    ƒ(0.50) = 50th (median) ◦  ƒ(0.95) = 95th •  Cluster to get pretty colors similar experiences. (k-means, hierarchical, etc.) Interpret the data
  9. •  Go there •  Abstract data analysis Or... bring "there"

    in-house by modeling reality. Make it easy to go there.
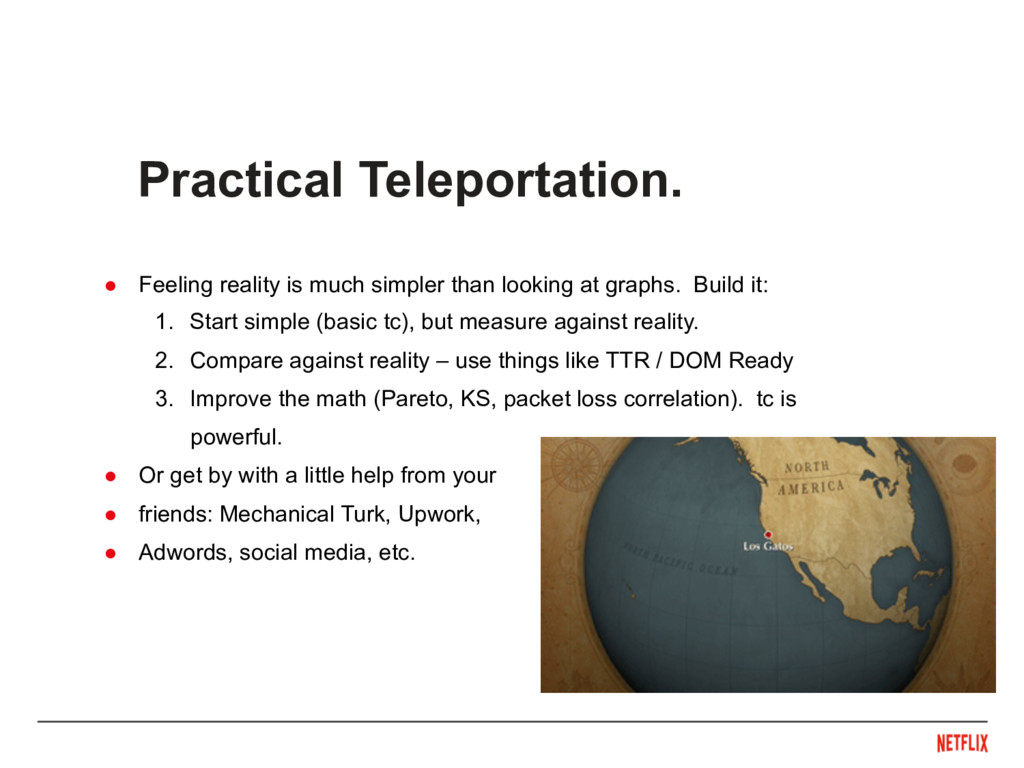
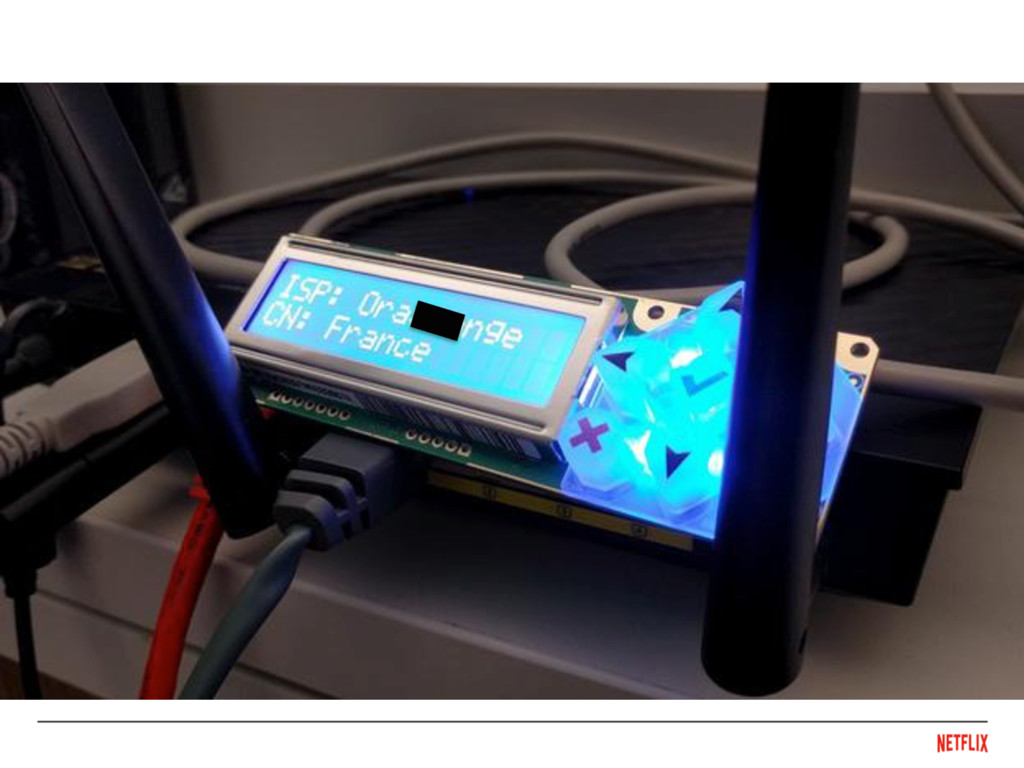
  10. •  Feeling reality is much simpler than looking at graphs.

    Build it: 1.  Start simple (basic tc), but measure against reality. 2.  Compare against reality – use things like TTR / DOM Ready 3.  Improve the math (Pareto, KS, packet loss correlation). tc is powerful. •  Or get by with a little help from your •  friends: Mechanical Turk, Upwork, •  Adwords, social media, etc. Practical Teleportation.
  11. Don't guess. Developing a model based on production data, without

    missing the distribution of samples (network, render, responsiveness) will lead to better software. Global reach doesn't need to be scary.
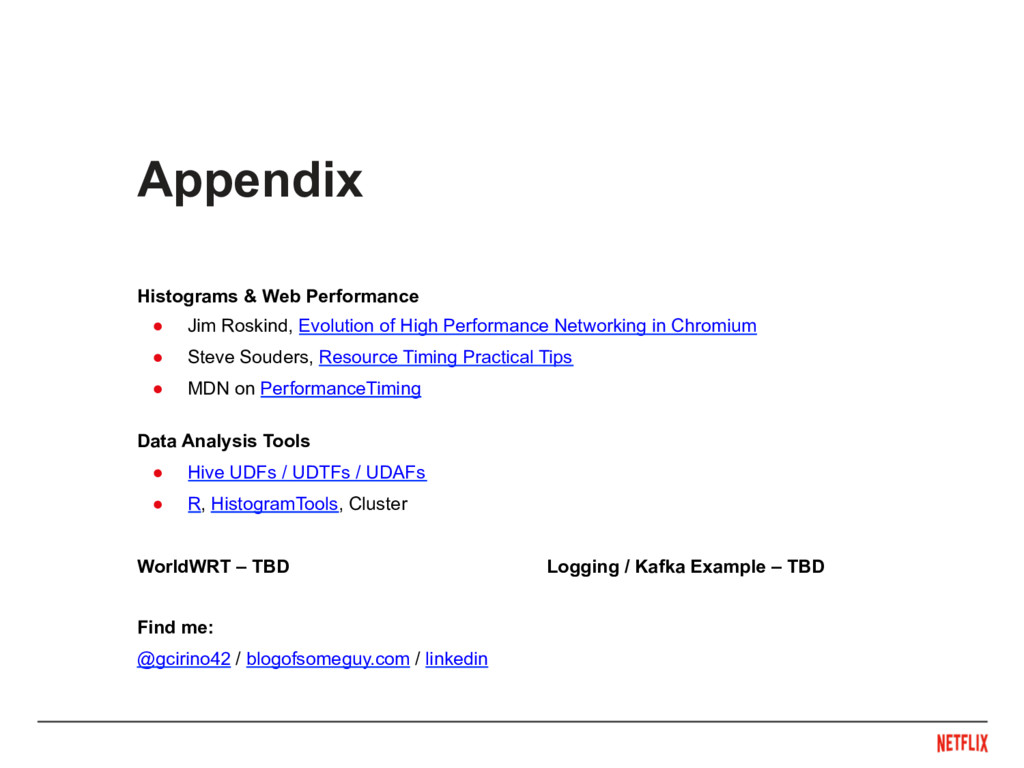
  12. Appendix Histograms & Web Performance •  Jim Roskind, Evolution of

    High Performance Networking in Chromium •  Steve Souders, Resource Timing Practical Tips •  MDN on PerformanceTiming Data Analysis Tools •  Hive UDFs / UDTFs / UDAFs •  R, HistogramTools, Cluster WorldWRT – TBD Logging / Kafka Example – TBD Find me: @gcirino42 / blogofsomeguy.com / linkedin