Upgrade to Pro — share decks privately, control downloads, hide ads and more …

Big Data Streams: The Next Frontier

Big Data Streams: The Next Frontier

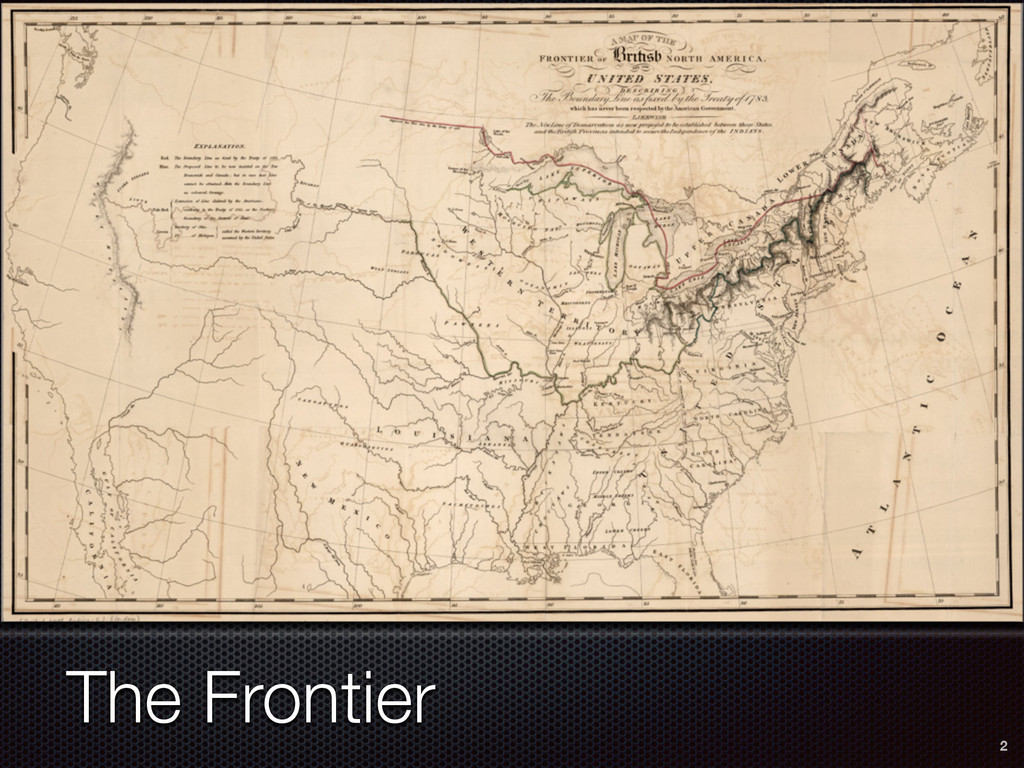
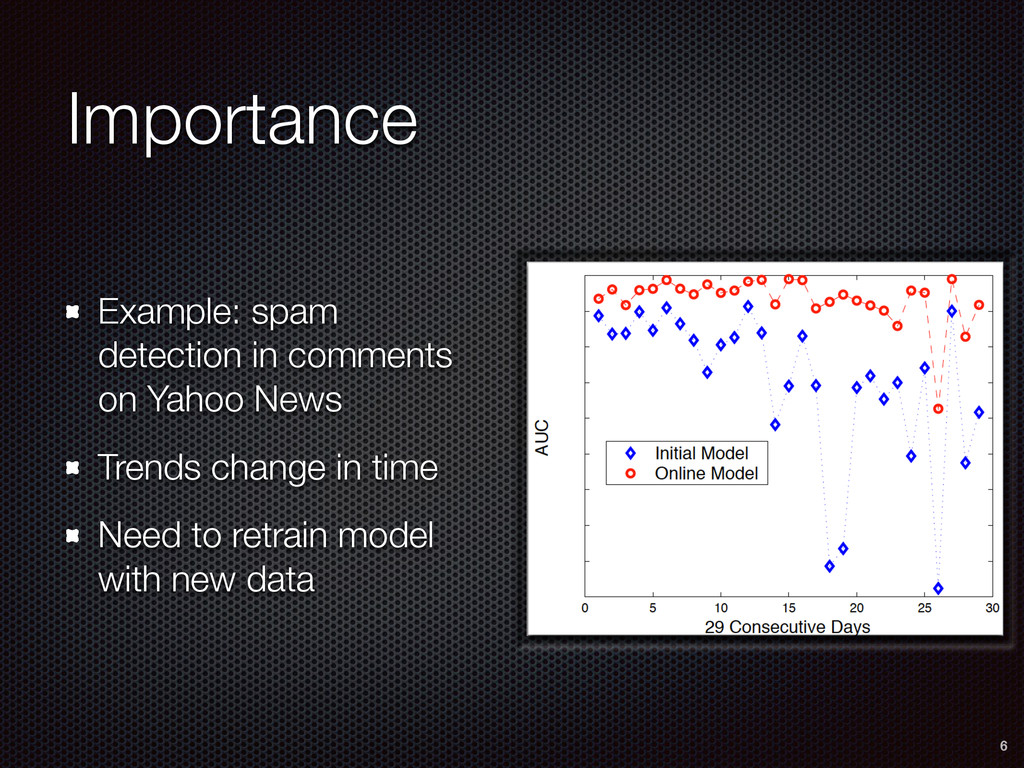
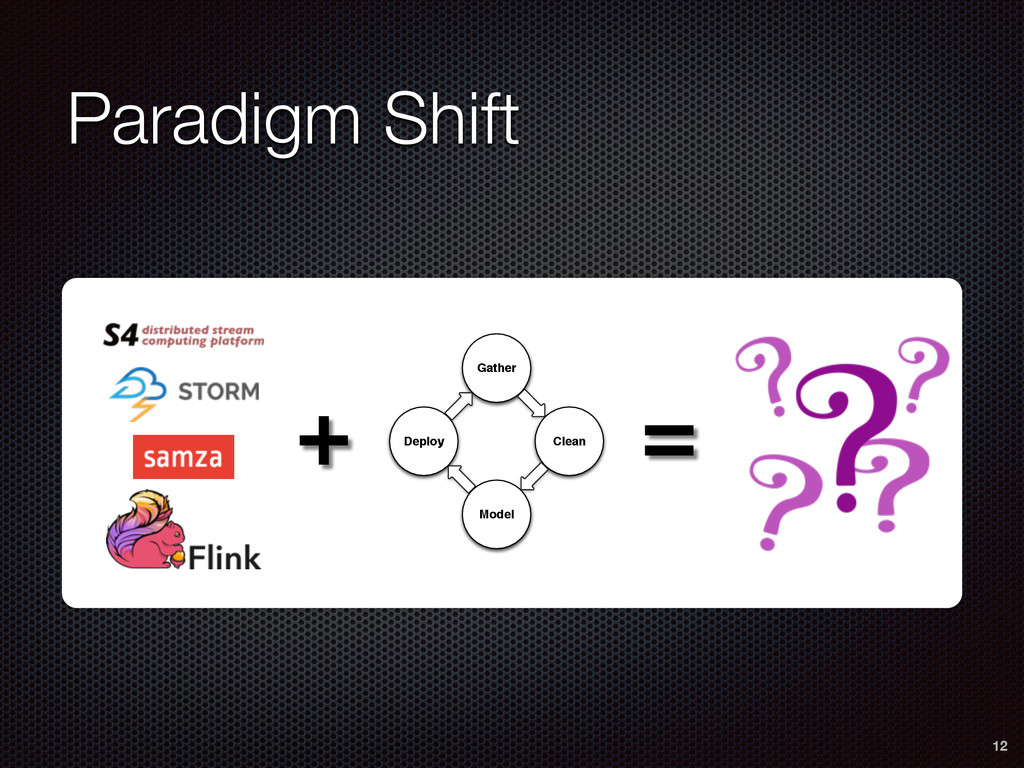
The rate at which the world produces data is growing steadily, thus creating ever larger streams of continuously evolving data. However, current (de-facto standard) solutions for big data analysis are not designed to mine evolving streams. Big data streams are just starting to be studied systematically, they are the next frontier for data analytics. As such, best practices in this context are still not ironed out, and the landscape is rapidly changing: it’s a wild west.

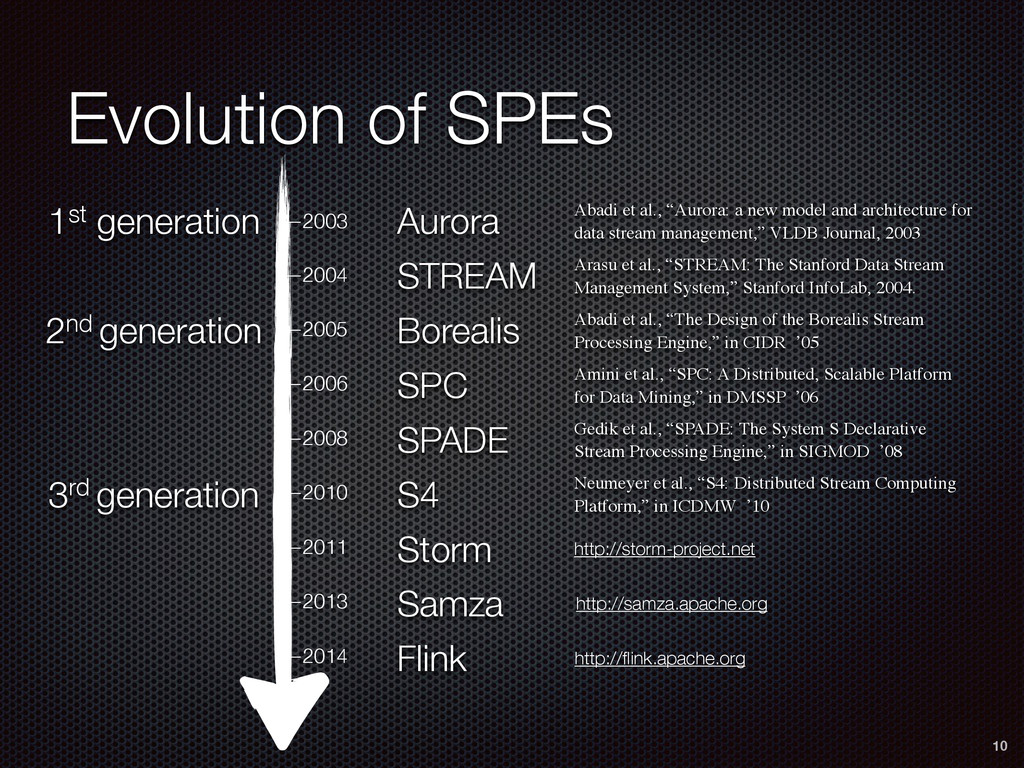
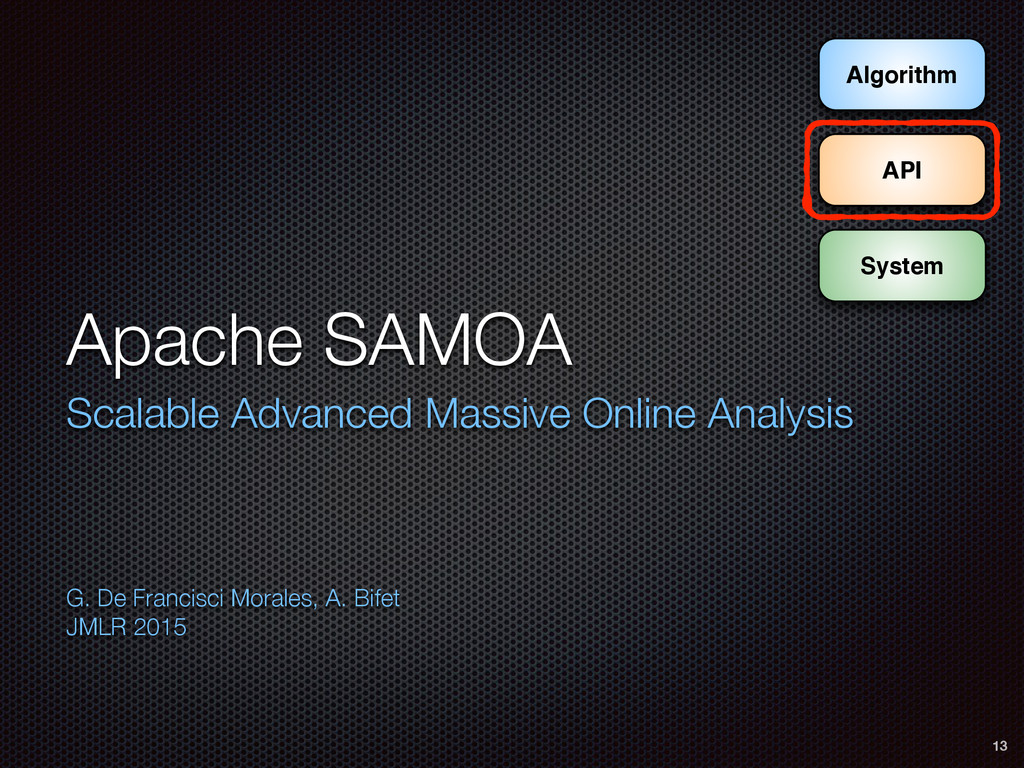
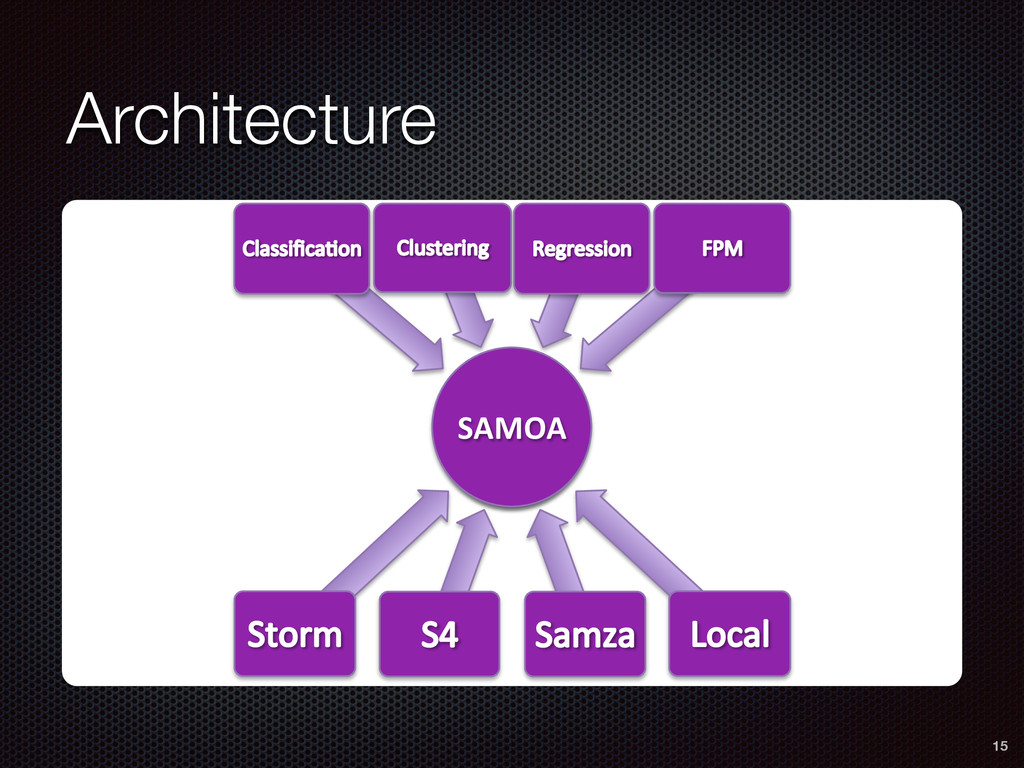
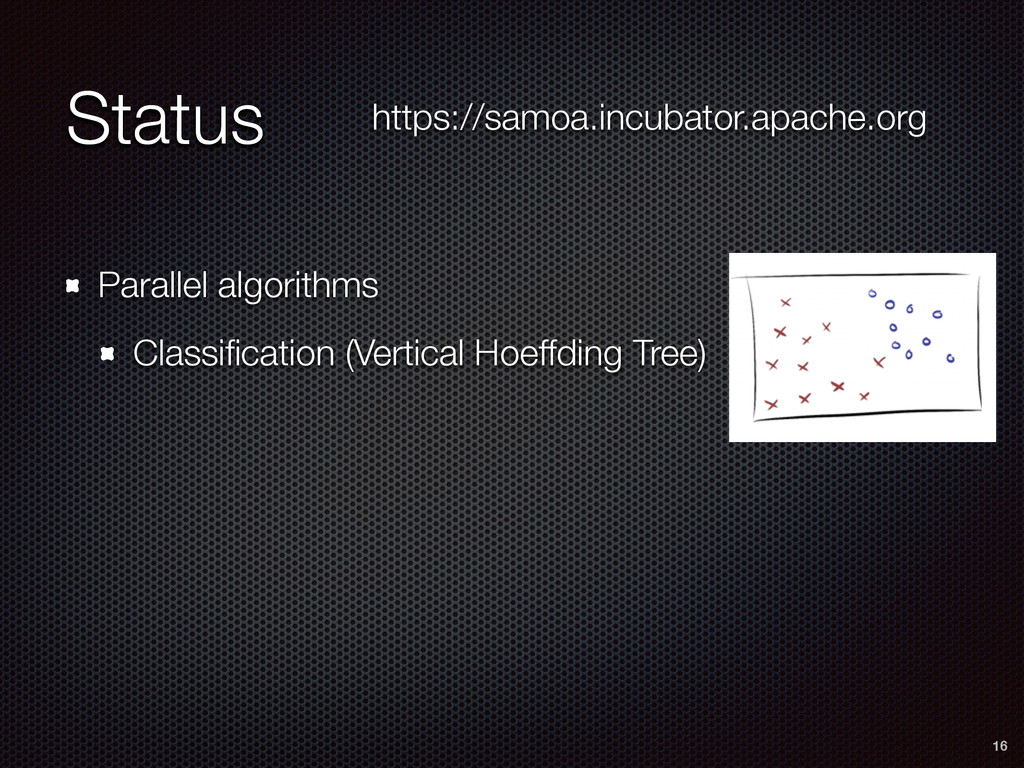
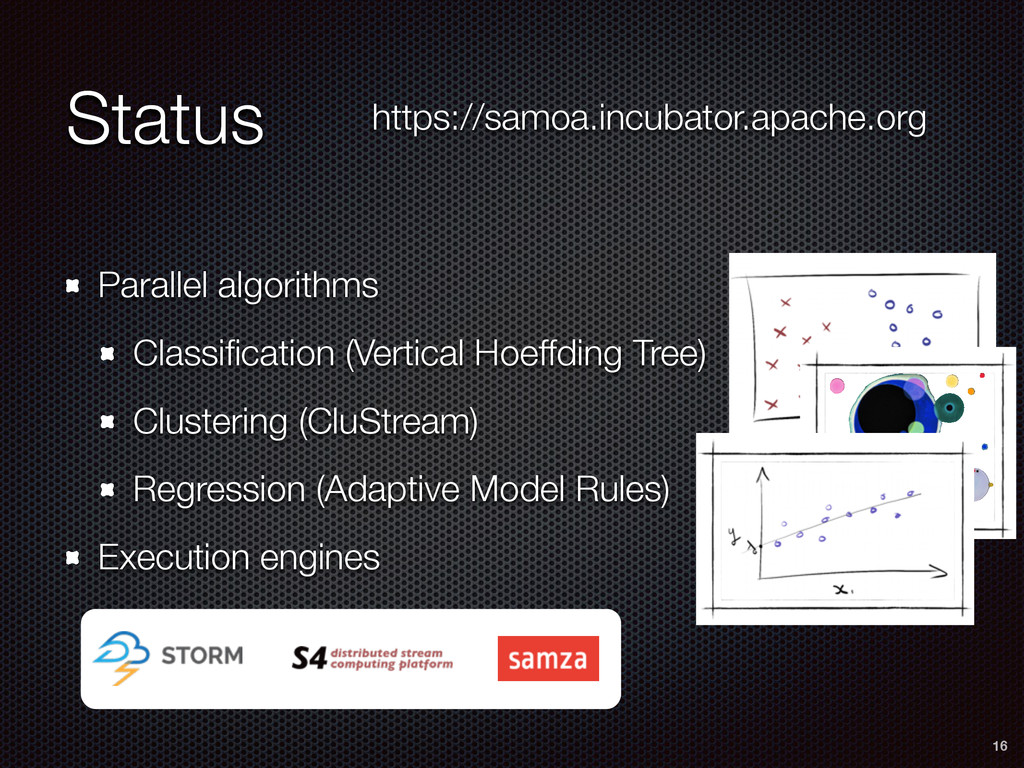
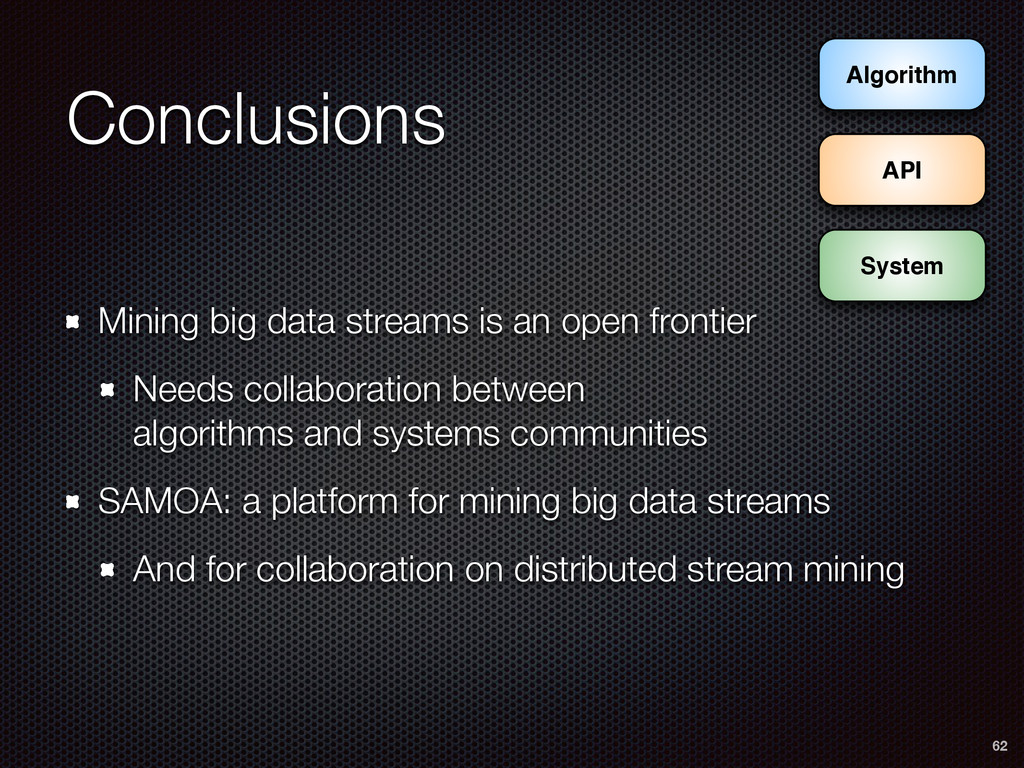
In this talk, we present a core of solutions for stream analysis that constitutes an initial foray into this uncharted territory. In doing so, we introduce Apache SAMOA, an open-source platform for mining big data streams (http://samoa.incubator.apache.org). Apache SAMOA provides a collection of distributed streaming algorithms for data mining tasks such as classification, regression, and clustering. It features a pluggable architecture that allows it to run on several distributed stream processing engines such as Storm, S4, Samza, and Flink.

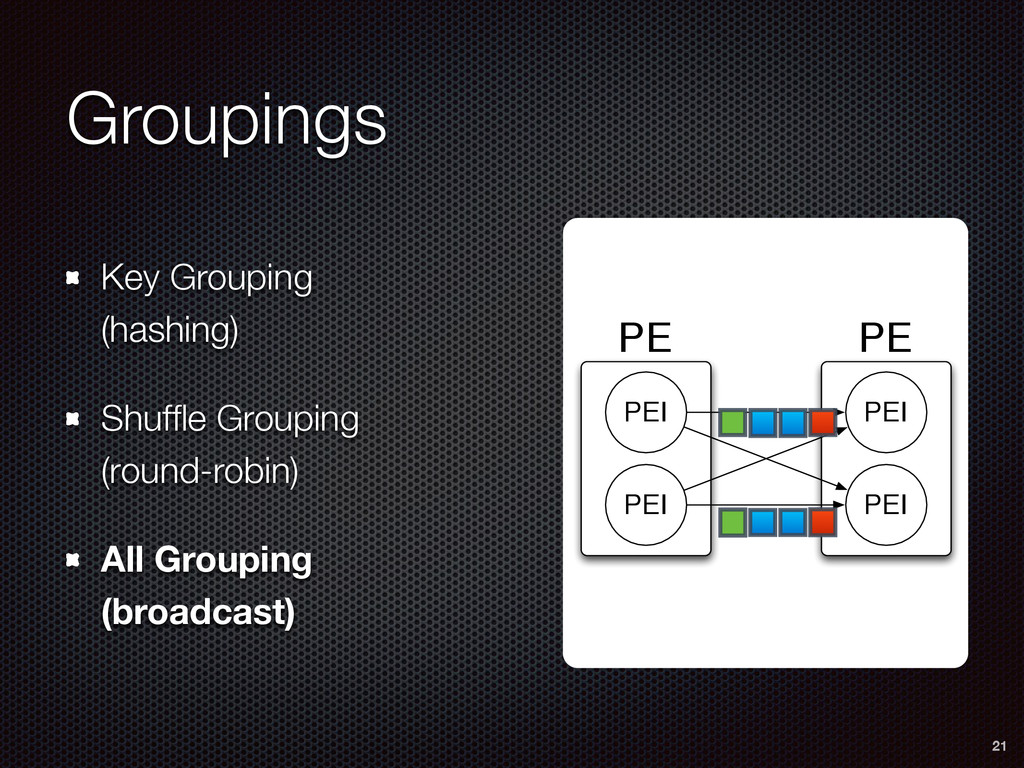
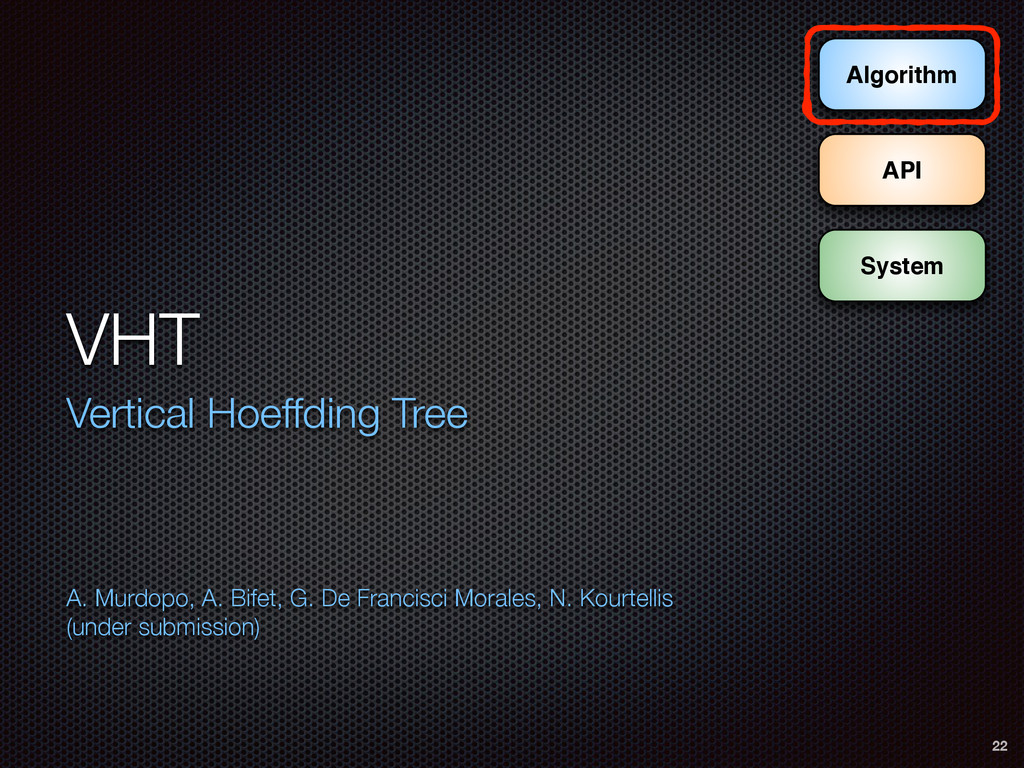
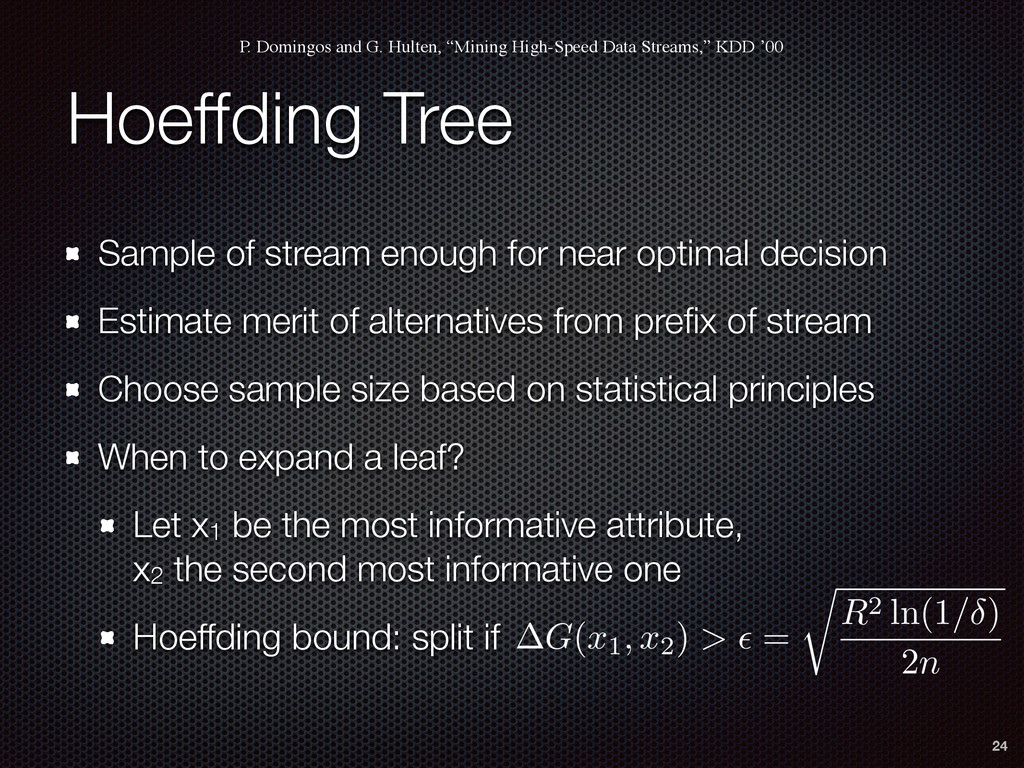
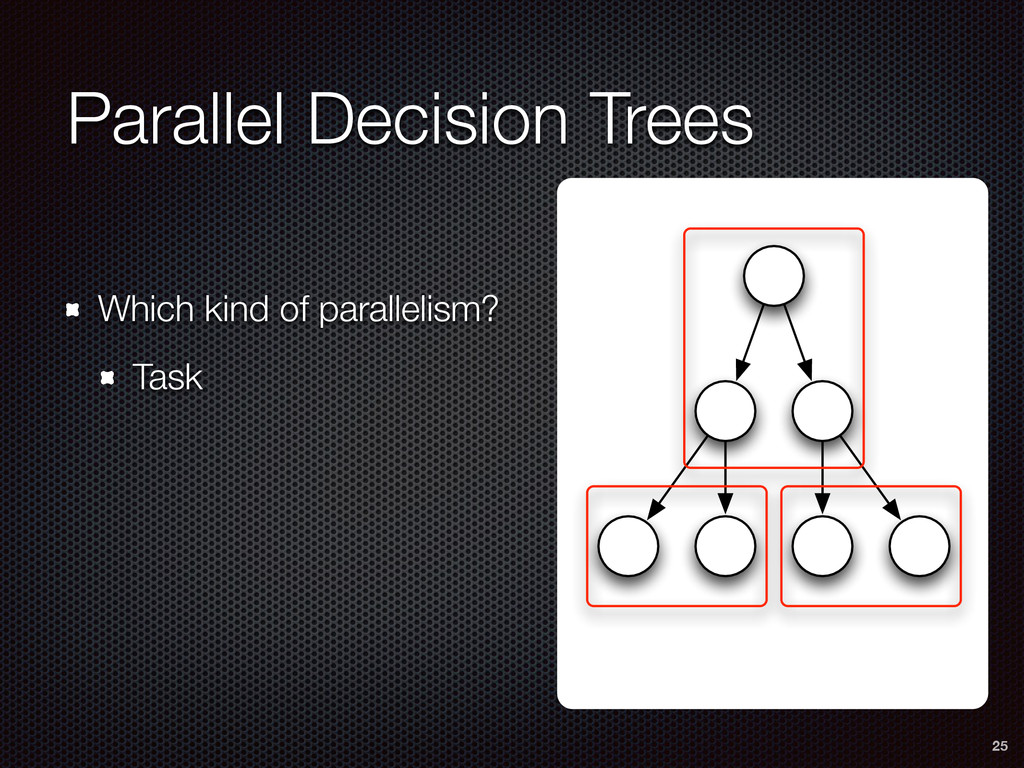
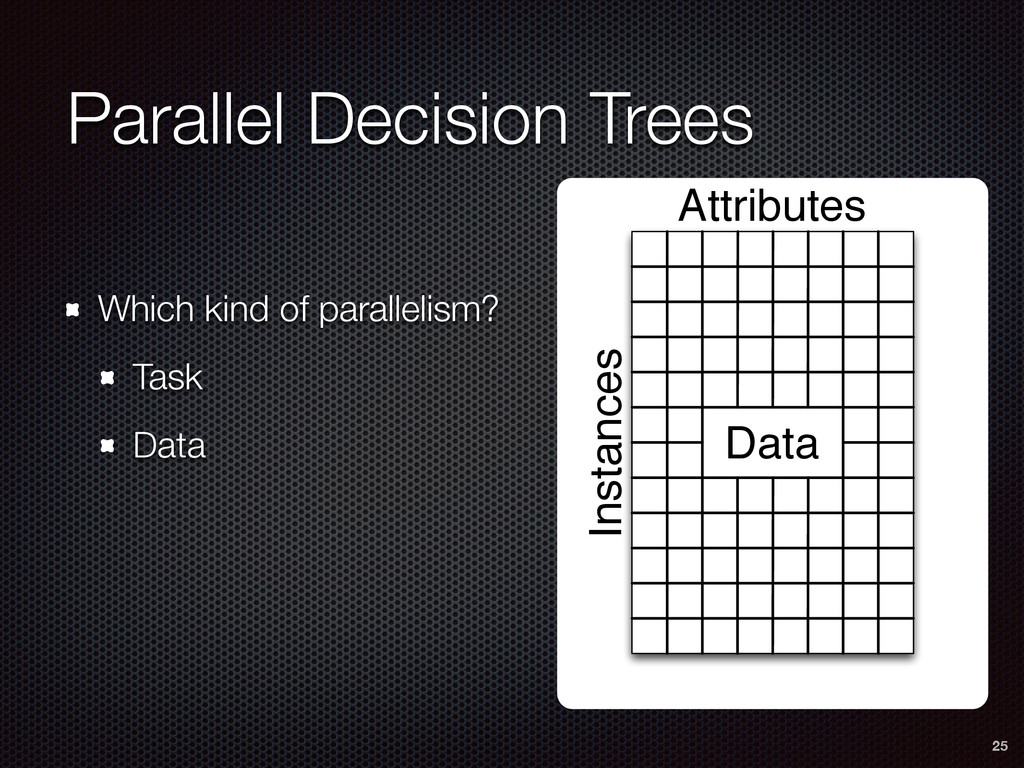
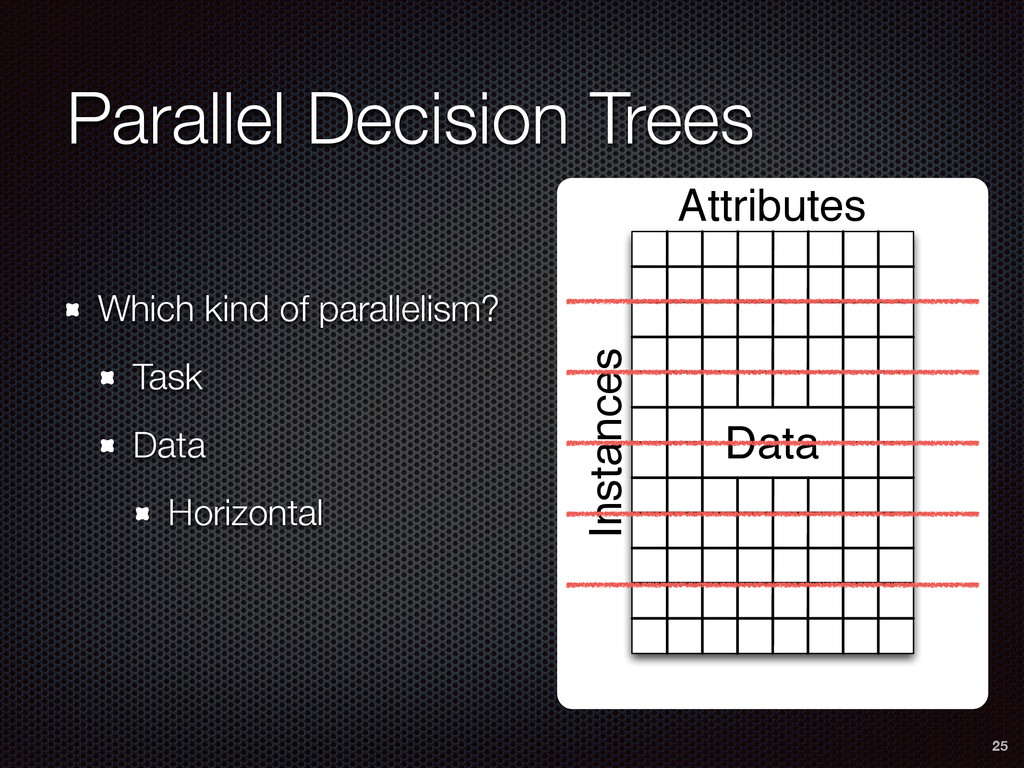
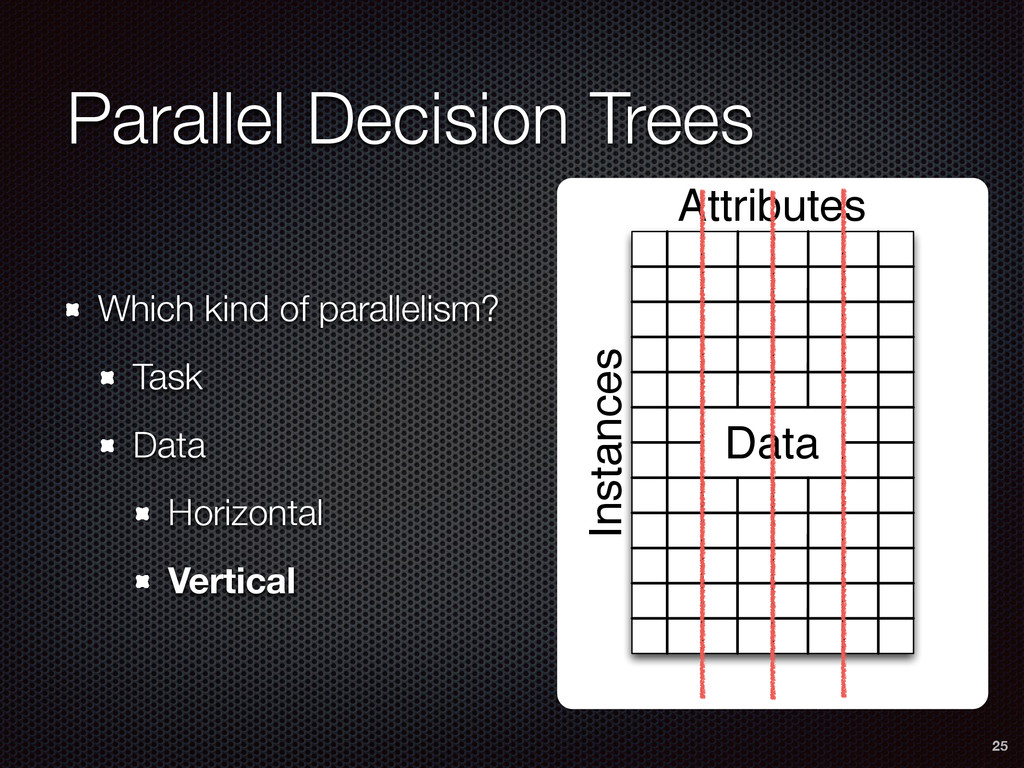
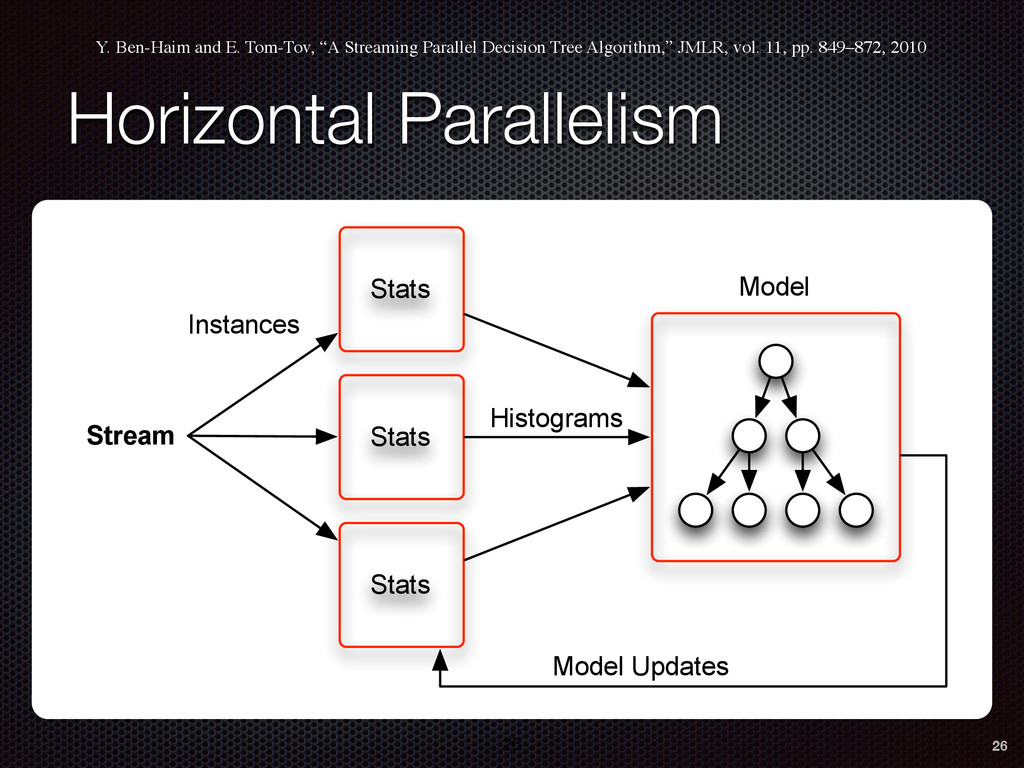
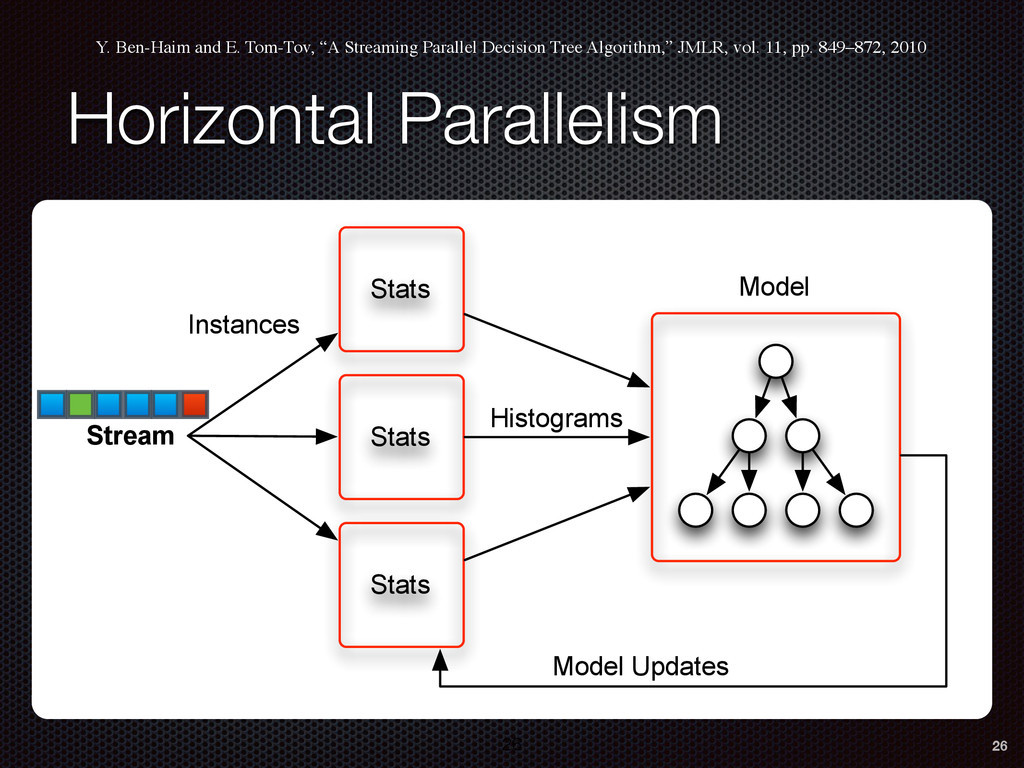
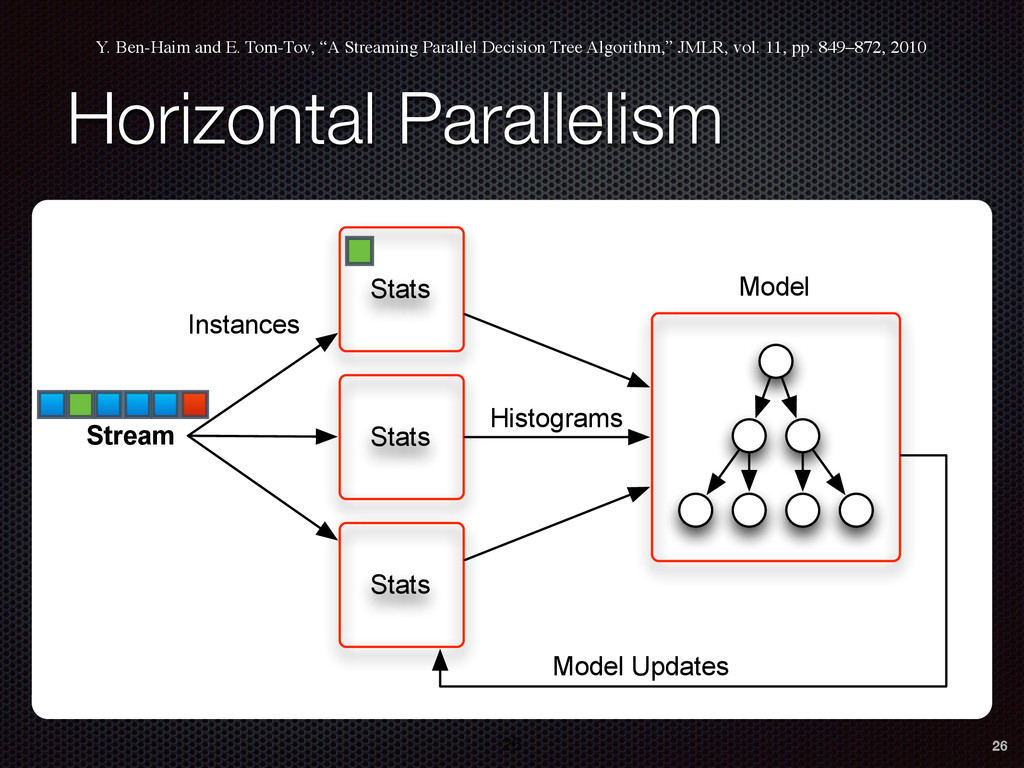
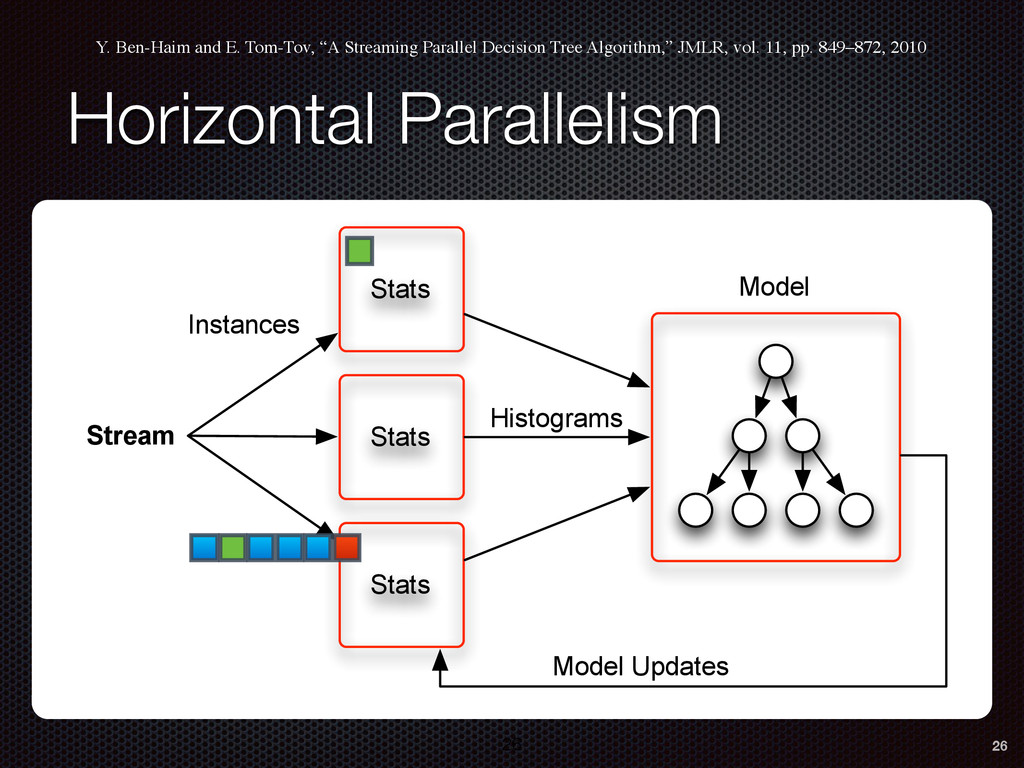
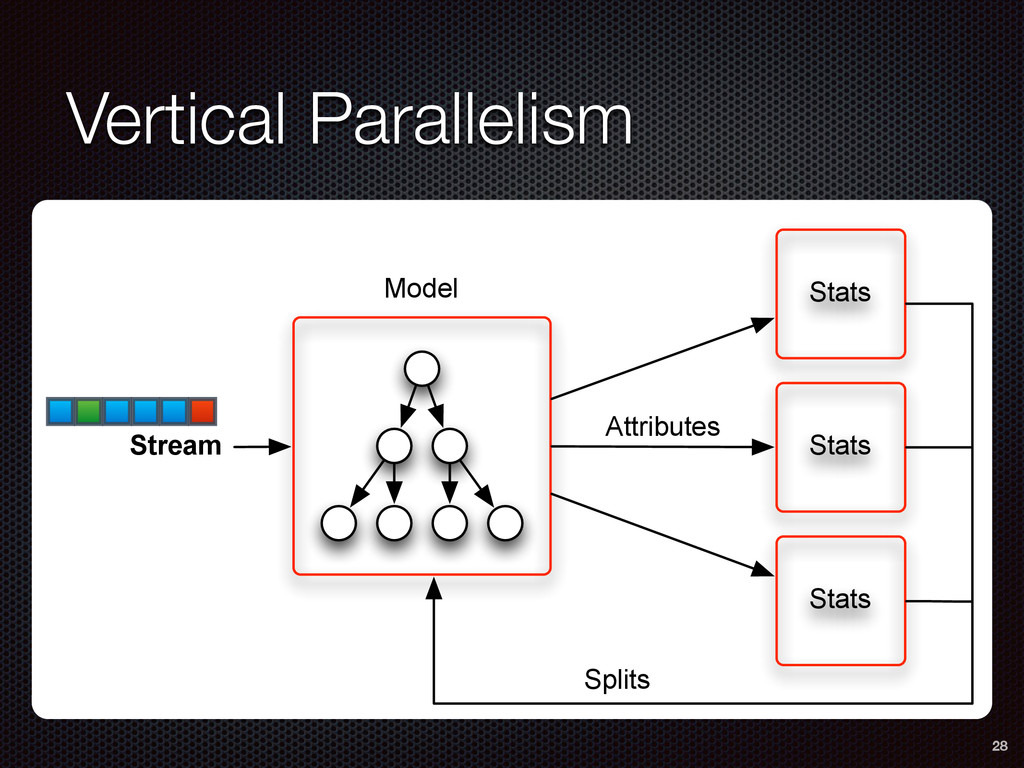
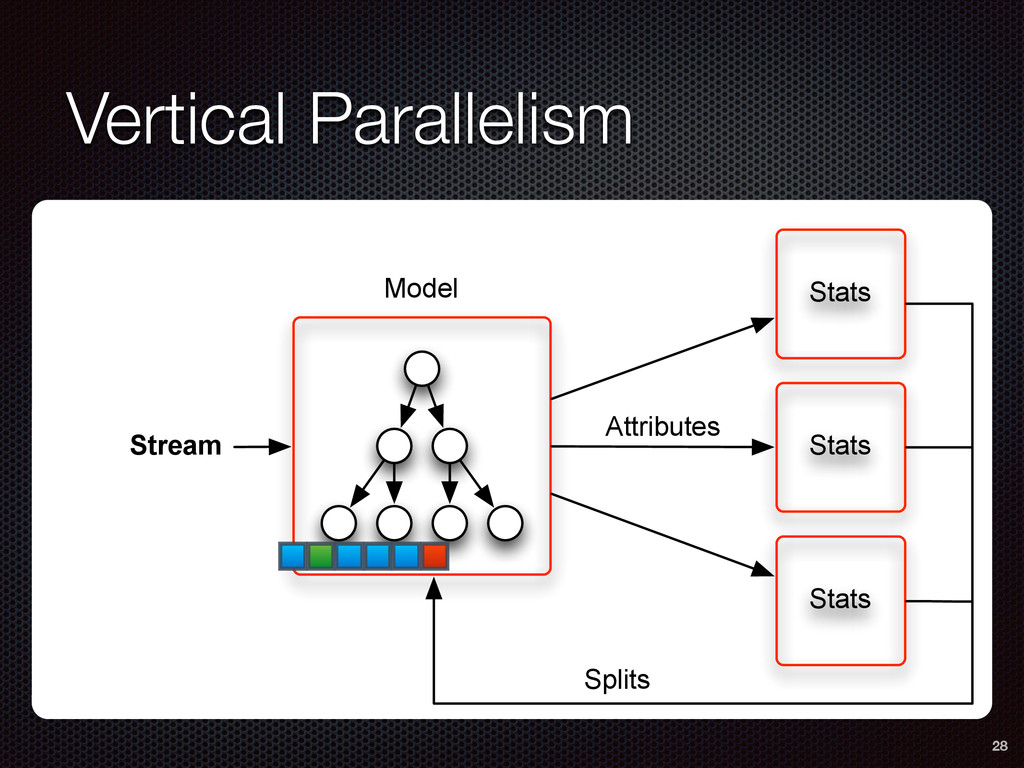
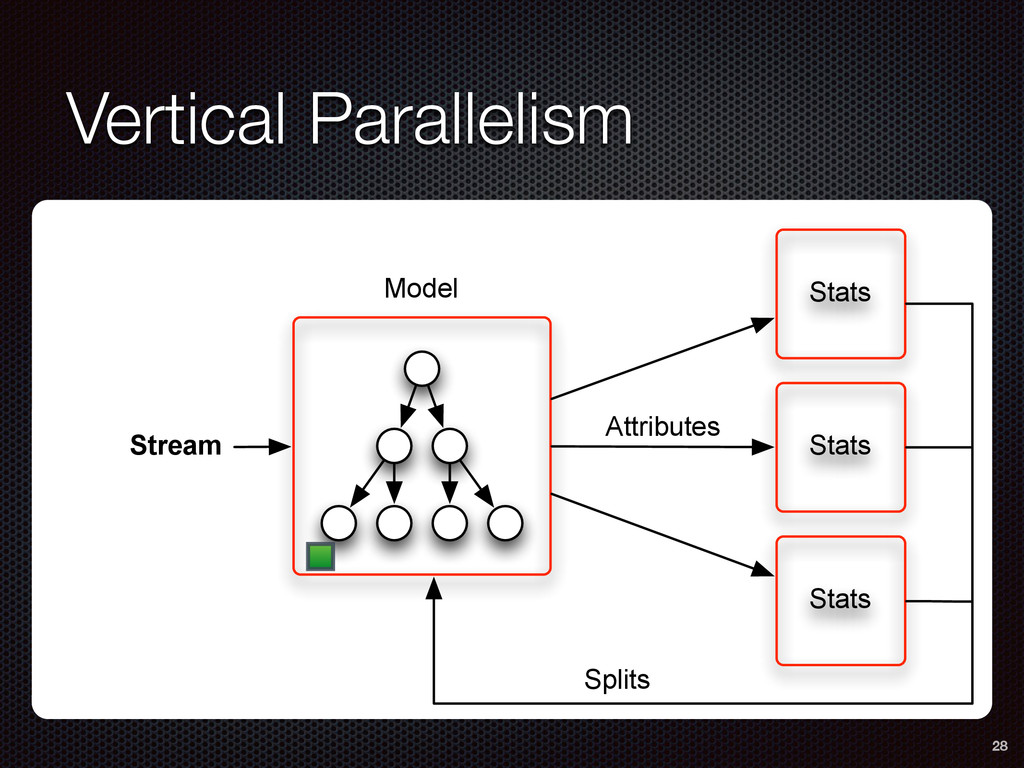
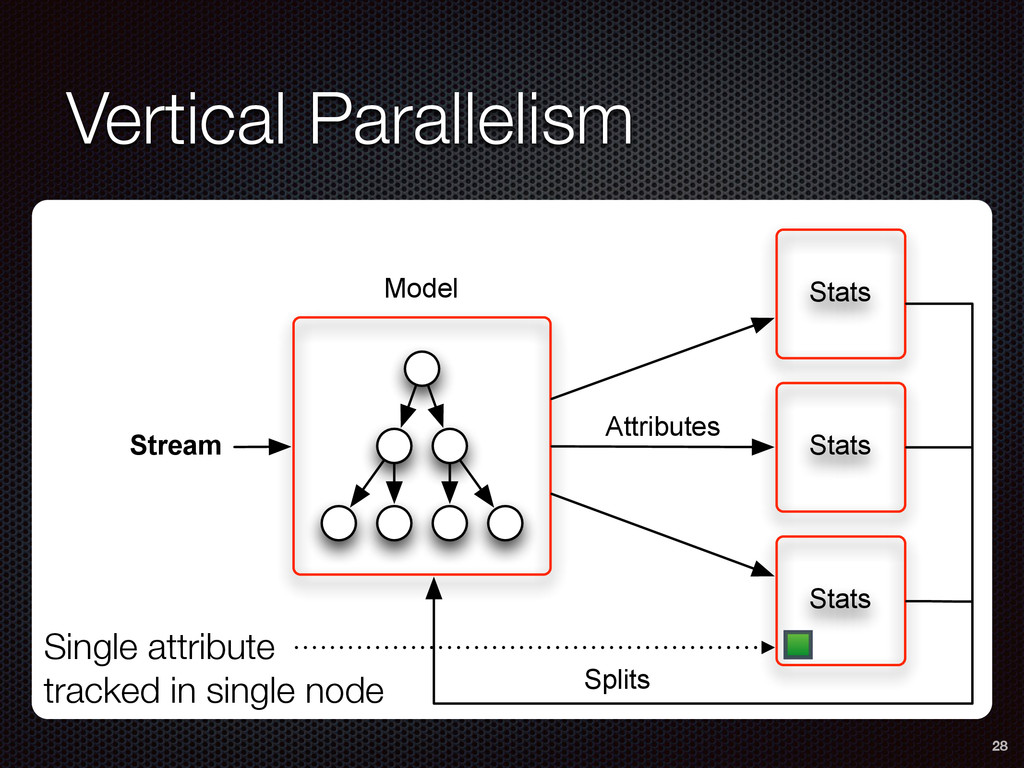
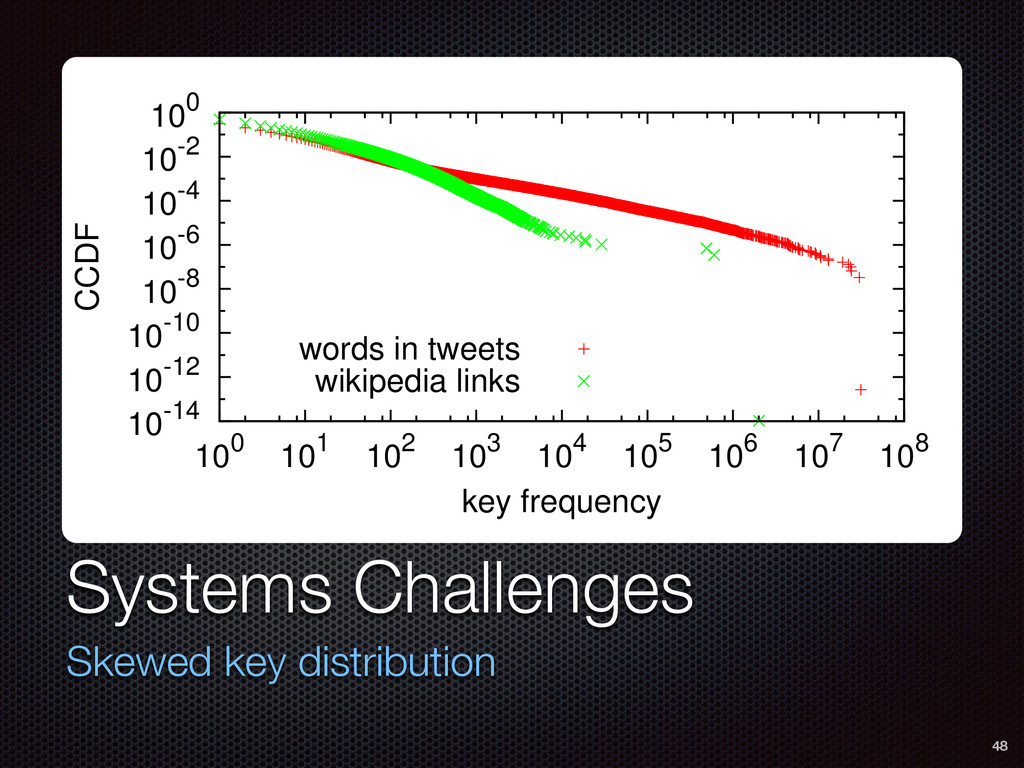
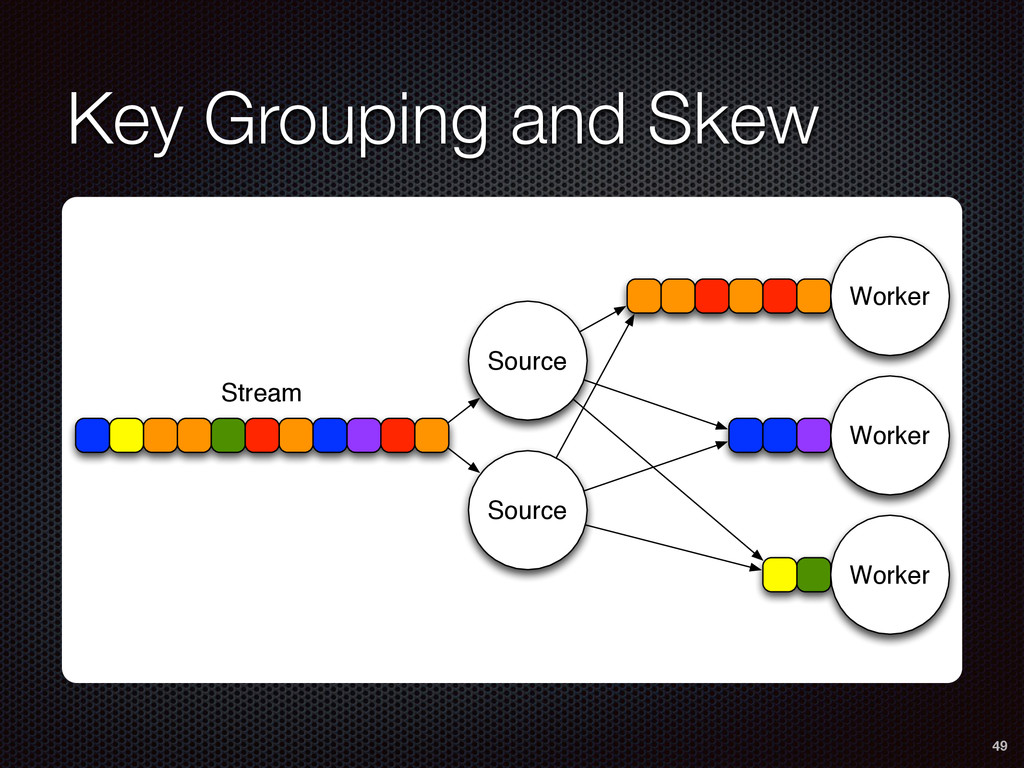
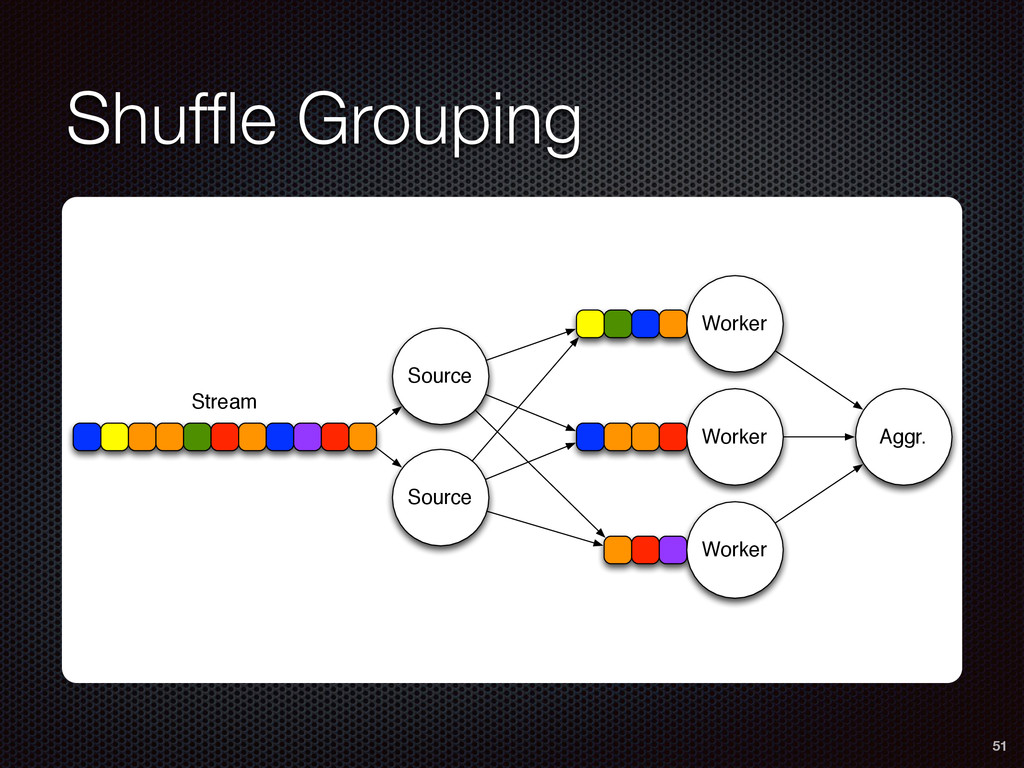
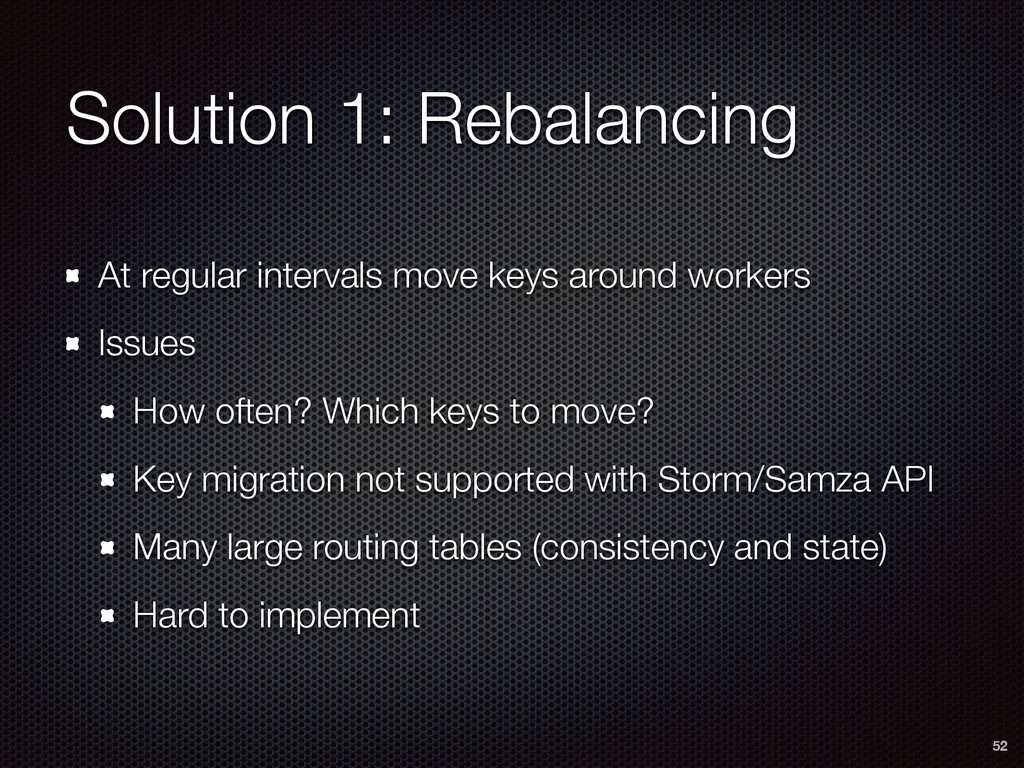
As a case study, we present one of SAMOA's main algorithms for classification, the Vertical Hoeffding Tree (VHT). Then, we propose a framework for online performance evaluation of streaming classifiers. We conclude by highlighting the issue of load balancingfrom a distributed systems perspective, and describing a generalizable solution.

More Decks by Gianmarco De Francisci Morales

Other Decks in Research

Transcript

  1. Big Data Streams The Next Frontier 
 Gianmarco De Francisci

    Morales
 Aalto University, Helsinki
 [email protected]
 @gdfm7
  2. Vision Algorithms & Systems Distributed stream mining platform Development and

    collaboration framework
 for researchers Library of state-of-the-art algorithms
 for practitioners 3
  3. Full Stack SAMOA
 (Scalable Advanced Massive Online Analysis) VHT +

    EVL
 (Vertical Hoeffding Tree)
 (Online Evaluation) PKG
 (Partial Key Grouping) 4 System Algorithm API
  4. Importance$of$O •  As$spam$trends$change retrain$the$model$with Importance Example: spam detection in comments

    on Yahoo News Trends change in time Need to retrain model with new data 6
  5. Evolution of SPEs 10 —2003 —2004 —2005 —2006 —2008 —2010

    —2011 —2013 —2014 Aurora STREAM Borealis SPC SPADE Storm S4 1st generation 2nd generation 3rd generation Abadi et al., “Aurora: a new model and architecture for data stream management,” VLDB Journal, 2003 Arasu et al., “STREAM: The Stanford Data Stream Management System,” Stanford InfoLab, 2004. Abadi et al., “The Design of the Borealis Stream Processing Engine,” in CIDR ’05 Amini et al., “SPC: A Distributed, Scalable Platform for Data Mining,” in DMSSP ’06 Gedik et al., “SPADE: The System S Declarative Stream Processing Engine,” in SIGMOD ’08 Neumeyer et al., “S4: Distributed Stream Computing Platform,” in ICDMW ’10 http://storm-project.net Samza http://samza.apache.org Flink http://flink.apache.org
  6. Actor Model 11 PE PE Input Stream PEI PEI PEI

    PEI PEI Output Stream Event routing
  7. System Algorithm API Apache SAMOA Scalable Advanced Massive Online Analysis


    G. De Francisci Morales, A. Bifet
 JMLR 2015 13
  8. Taxonomy 14 Data Mining Distributed Batch Hadoop Mahout Stream Storm,

    S4, Samza SAMOA Non Distributed Batch R, WEKA, … Stream MOA
  9. Parallel algorithms Classification (Vertical Hoeffding Tree) Clustering (CluStream) Regression (Adaptive

    Model Rules) Execution engines
 Status Status 16 https://samoa.incubator.apache.org
  10. Is SAMOA useful for you? Only if you need to

    deal with: Large fast data Evolving process (model updates) What is happening now? Use feedback in real-time Adapt to changes faster 17
  11. PE PE PEI PEI PEI PEI Groupings Key Grouping 


    (hashing) Shuffle Grouping
 (round-robin) All Grouping
 (broadcast) 18
  12. PE PE PEI PEI PEI PEI Groupings Key Grouping 


    (hashing) Shuffle Grouping
 (round-robin) All Grouping
 (broadcast) 19
  13. PE PE PEI PEI PEI PEI Groupings Key Grouping 


    (hashing) Shuffle Grouping
 (round-robin) All Grouping
 (broadcast) 19
  14. PE PE PEI PEI PEI PEI Groupings Key Grouping 


    (hashing) Shuffle Grouping
 (round-robin) All Grouping
 (broadcast) 19
  15. PE PE PEI PEI PEI PEI Groupings Key Grouping 


    (hashing) Shuffle Grouping
 (round-robin) All Grouping
 (broadcast) 20
  16. PE PE PEI PEI PEI PEI Groupings Key Grouping 


    (hashing) Shuffle Grouping
 (round-robin) All Grouping
 (broadcast) 20
  17. PE PE PEI PEI PEI PEI Groupings Key Grouping 


    (hashing) Shuffle Grouping
 (round-robin) All Grouping
 (broadcast) 20
  18. PE PE PEI PEI PEI PEI Groupings Key Grouping 


    (hashing) Shuffle Grouping
 (round-robin) All Grouping
 (broadcast) 21
  19. PE PE PEI PEI PEI PEI Groupings Key Grouping 


    (hashing) Shuffle Grouping
 (round-robin) All Grouping
 (broadcast) 21
  20. PE PE PEI PEI PEI PEI Groupings Key Grouping 


    (hashing) Shuffle Grouping
 (round-robin) All Grouping
 (broadcast) 21
  21. VHT Vertical Hoeffding Tree
 A. Murdopo, A. Bifet, G. De

    Francisci Morales, N. Kourtellis
 (under submission) 22 System Algorithm API
  22. Decision Tree Nodes are tests on attributes Branches are possible

    outcomes Leafs are class assignments
 
 23 Class Instance Attributes Road Tested? Mileage? Age? No Yes High ✅ ❌ Low Old Recent ✅ ❌ Car deal?
  23. Hoeffding Tree Sample of stream enough for near optimal decision

    Estimate merit of alternatives from prefix of stream Choose sample size based on statistical principles When to expand a leaf? Let x1 be the most informative attribute,
 x2 the second most informative one Hoeffding bound: split if 24 G ( x1, x2) > ✏ = r R 2 ln(1 / ) 2 n P. Domingos and G. Hulten, “Mining High-Speed Data Streams,” KDD ’00
  24. Horizontal Parallelism Y. Ben-Haim and E. Tom-Tov, “A Streaming Parallel

    Decision Tree Algorithm,” JMLR, vol. 11, pp. 849–872, 2010 26 Stats Stats Stats Stream Histograms Model Instances Model Updates 26
  25. Horizontal Parallelism Y. Ben-Haim and E. Tom-Tov, “A Streaming Parallel

    Decision Tree Algorithm,” JMLR, vol. 11, pp. 849–872, 2010 26 Stats Stats Stats Stream Histograms Model Instances Model Updates 26
  26. Horizontal Parallelism Y. Ben-Haim and E. Tom-Tov, “A Streaming Parallel

    Decision Tree Algorithm,” JMLR, vol. 11, pp. 849–872, 2010 26 Stats Stats Stats Stream Histograms Model Instances Model Updates 26
  27. Horizontal Parallelism Y. Ben-Haim and E. Tom-Tov, “A Streaming Parallel

    Decision Tree Algorithm,” JMLR, vol. 11, pp. 849–872, 2010 26 Stats Stats Stats Stream Histograms Model Instances Model Updates 26
  28. Horizontal Parallelism Y. Ben-Haim and E. Tom-Tov, “A Streaming Parallel

    Decision Tree Algorithm,” JMLR, vol. 11, pp. 849–872, 2010 26 Stats Stats Stats Stream Histograms Model Instances Model Updates 26
  29. Horizontal Parallelism Y. Ben-Haim and E. Tom-Tov, “A Streaming Parallel

    Decision Tree Algorithm,” JMLR, vol. 11, pp. 849–872, 2010 26 Stats Stats Stats Stream Histograms Model Instances Model Updates 26
  30. Horizontal Parallelism Y. Ben-Haim and E. Tom-Tov, “A Streaming Parallel

    Decision Tree Algorithm,” JMLR, vol. 11, pp. 849–872, 2010 26 Stats Stats Stats Stream Histograms Model Instances Model Updates 26
  31. Horizontal Parallelism Y. Ben-Haim and E. Tom-Tov, “A Streaming Parallel

    Decision Tree Algorithm,” JMLR, vol. 11, pp. 849–872, 2010 26 Stats Stats Stats Stream Histograms Model Instances Model Updates Single attribute tracked in multiple node 26
  32. Horizontal Parallelism Y. Ben-Haim and E. Tom-Tov, “A Streaming Parallel

    Decision Tree Algorithm,” JMLR, vol. 11, pp. 849–872, 2010 26 Stats Stats Stats Stream Histograms Model Instances Model Updates Aggregation to compute splits 26
  33. Hoeffding Tree Profiling 27 Other 6% Split 24% Learn 70%

    CPU time for training
 100 nominal and 100 numeric attributes
  34. Advantages of Vertical High number of attributes => high level

    of parallelism
 (e.g., documents) Vs task parallelism Parallelism observed immediately Vs horizontal parallelism Reduced memory usage (no model replication) Parallelized split computation 29
  35. Performance 31 35 0 50 100 150 200 250 MHT

    VHT2-par-3 Execution Time (seconds) Classifier Profiling Results for text-10000 with 100000 instances t_calc t_comm t_serial Throughput VHT2-par-3: 2631 inst/sec MHT : 507 inst/sec
  36. EVL Efficient Online Evaluation 
 of Big Data Stream Classifiers

    A. Bifet, G. De Francisci Morales, J. Read, G. Holmes, B. Pfahringer
 KDD 2015 32 System Algorithm API
  37. Why? When is a classifier better than another? Statistically Online


 33 Classifier 1 Classifier 2 Stream - - - Evaluation
  38. I1: Validation Methodology Distributed Theory suggests k-fold Cross-validation Split-validation Bootstrap

    validation 36 Validation Methodology Classifier (fold) } k classifiers in parallel
  39. I1: Validation Methodology Distributed Theory suggests k-fold Cross-validation Split-validation Bootstrap

    validation 37 Cross-Validation Classifier (fold) Classifier (fold) Classifier (fold) Classifier (fold) Train Test
  40. I1: Validation Methodology Distributed Theory suggests k-fold Cross-validation Split-validation Bootstrap

    validation 38 Split-Validation Classifier (fold) Classifier (fold) Classifier (fold) Classifier (fold) Train Test
  41. I1: Validation Methodology Distributed Theory suggests k-fold Cross-validation Split-validation Bootstrap

    validation 39 Bootstrap Validation Classifier (fold) Classifier (fold) Classifier (fold) Classifier (fold) Train Test 1 2 Training weights ~ Poisson(1) 0 0
  42. I2: Statistical Testing Often misunderstood, hard to do correctly Non-parametric

    tests McNemar’s test Wilcoxon’s signed-rank test Sign test (omitted for brevity) 40
  43. McNemar’s Test Example as trial a = number of examples

    where C1 is right & 
 C2 is wrong H0 => M ~ 2
 
 
 41 C1 \ C2 Correct Incorrect Correct - a Incorrect b - M = sign(a b) ⇥ (a b)2 (a + b)
  44. Wilcoxon’s Test Fold as trial Rank absolute value of performance

    difference (ascending) Sum ranks of differences with same sign Compare minimum sum to critical value (z-score) H0 => W ~ Normal 42 Table 1: Comparison of two classifiers with Sign test Wilcoxon’s signed-rank test. Class. A Class. B Di↵ Rank 77.98 77.91 0.07 4 72.26 72.27 -0.01 1 76.95 76.97 -0.02 2 77.94 76.57 1.37 7 72.23 71.63 0.60 5 76.90 75.48 1.42 8 77.93 75.75 2.18 9 72.37 71.33 1.04 6 76.93 74.54 2.39 10 77.97 77.94 0.03 3 4. STATISTICAL TESTS FOR COMPAR CLASSIFIERS The three most used statistical tests for comparing
  45. Experiment: Type I & II Error Test for false positives

    Randomized classifiers with different seeds (RF) Test for false negatives Add random noise filter 43 p = p0 ⇥ (1 p noise ) + (1 p0) ⇥ p noise c
  46. FP: Type I Error 2: Average fraction of null hypothesis

    rejection for di↵erent combina datasets. The first column group concerns Type I errors, and the o No change C bootstrap cv split boo McNemar non-prequential 0.71 0.52 0.66 McNemar prequential 0.77 0.80 0.42 Sign test non-prequentiall 0.11 0.11 0.10 Sign test prequential 0.12 0.12 0.09 Wilcoxon non-prequential 0.11 0.11 0.14 Wilcoxon prequential 0.11 0.10 0.19 Avg. time non-prequential (s) 883 1105 415 Avg. time prequential (s) 813 1202 109 tors with concept drift most commonly found in the T
  47. FN: Type II Error 2: Average fraction of null hypothesis

    rejection for di↵erent combina datasets. The first column group concerns Type I errors, and the o No change C bootstrap cv split boo McNemar non-prequential 0.71 0.52 0.66 McNemar prequential 0.77 0.80 0.42 Sign test non-prequentiall 0.11 0.11 0.10 Sign test prequential 0.12 0.12 0.09 Wilcoxon non-prequential 0.11 0.11 0.14 Wilcoxon prequential 0.11 0.10 0.19 Avg. time non-prequential (s) 883 1105 415 Avg. time prequential (s) 813 1202 109 tors with concept drift most commonly found in the T hypothesis rejection for di↵erent combinations of validation procedu n group concerns Type I errors, and the other two column groups c No change Change p noise = 0.05 C bootstrap cv split bootstrap cv split boo ntial 0.71 0.52 0.66 0.86 0.80 0.73 0.77 0.80 0.42 0.88 0.94 0.56 tiall 0.11 0.11 0.10 0.77 0.82 0.44 0.12 0.12 0.09 0.77 0.83 0.44 ntial 0.11 0.11 0.14 0.79 0.84 0.51 0.11 0.10 0.19 0.80 0.84 0.54 ential (s) 883 1105 415 877 1121 422 l (s) 813 1202 109 820 1214 111 most commonly found in the There is little di↵erence
  48. Lessons Learned Statistical units: prefer folds to examples Wilcoxon’s ≻

    McNemar’s Use data wisely Cross-validation ≻ Split-vaildation Bootstrap good tradeoff Caveat: using dependent folds as independent trials risky 46
  49. PKG Partial Key Grouping
 M. A. U. Nasir, G. De

    Francisci Morales, D. Garcia-Soriano, N. Kourtellis, M. Serafini, “The Power of Both Choices: Practical Load Balancing for Distributed Stream Processing Engines”, ICDE 2015 47 System Algorithm API
  50. 10-14 10-12 10-10 10-8 10-6 10-4 10-2 100 100 101

    102 103 104 105 106 107 108 CCDF key frequency words in tweets wikipedia links Systems Challenges Skewed key distribution 48
  51. Problem Statement Input stream of messages Load of worker Imbalance

    of the system Goal: partitioning function that minimizes imbalance 50 m = ht, k, vi Li(t) = |{h⌧, k, vi : P⌧ (k) = i ^ ⌧  t}| Pt : K ! N i 2 W I ( t ) = max i ( Li( t )) avg i ( Li( t )) , for i 2 W
  52. Solution 1: Rebalancing At regular intervals move keys around workers

    Issues How often? Which keys to move? Key migration not supported with Storm/Samza API Many large routing tables (consistency and state) Hard to implement 52
  53. Solution 2: PoTC Balls and bins problem For each ball,

    pick two bins uniformly at random Put the ball in the least loaded one Issues Consensus and state to remember choice Load information in distributed system 53
  54. Solution 3: PKG Fully distributed adaptation of PoTC, handles skew

    Consensus and state to remember choice Key splitting:
 assign each key independently with PoTC Load information in distributed system Local load estimation:
 estimate worker load locally at each source 54
  55. Comparison 56 Stream Grouping Pros Cons Key Grouping Memory efficient

    Load imbalance Shuffle Grouping Load balance Memory overhead Aggregation O(W) Partial Key Grouping Memory efficient Load balance Aggregation O(1)
  56. Experimental Design What is the effect of key splitting? How

    does local estimation compare to a global oracle? How does PKG perform in a real system? Measures: imbalance, throughput, memory, latency Datasets: Twitter, Wikipedia, graphs, synthetic 57
  57. Effect of Key Splitting 58 Average Imbalance 0% 1% 2%

    3% 4% Number of workers 5 10 50 100 PKG Off-Greedy PoTC KG
  58. Local vs Global 59 10-10 10-9 10-8 10-7 10-6 10-5

    10-4 10-3 10-2 10-1 5 10 50 100 Fraction of Imbalance workers TW G L5 5 10 50 100 workers WP L10 5 10 50 100 workers CT L15 5 LN1 Fig. 2: Fraction of average imbalance with respect to total number of messages workers and number of sources. 5 10 50 100 workers W L5 5 10 50 100 workers WP L10 5 10 50 100 workers CT L15 5 LN1 L2 ction of average imbalance with respect to total number of messages fo d number of sources. 100 5 10 50 100 workers WP L10 5 10 50 100 workers CT L15 5 10 50 100 workers LN1 L20 rage imbalance with respect to total number of messages for each datas sources. 5 10 50 100 workers P L10 5 10 50 100 workers CT L15 5 10 50 100 workers LN1 L20 5 LN2 ance with respect to total number of messages for each dataset, for diffe 0 5 10 50 100 workers CT L15 5 10 50 100 workers LN1 L20 5 10 50 100 workers LN2 H ect to total number of messages for each dataset, for different number 10-10 10-9 10-8 10-7 10-6 10-5 10-4 10-3 10-2 10-1 5 10 50 100 workers TW G L5 5 10 50 100 workers WP L10 5 10 50 100 workers CT L15 g. 2: Fraction of average imbalance with respect to total number of mes rkers and number of sources. 10-10 10-9 10-8 10-7 10-6 10-5 10-4 10-3 10-2 10-1 5 10 50 100 Fraction of Imbalance workers TW G L5 5 10 50 100 workers WP L10 5 10 50 100 workers CT L15 Fig. 2: Fraction of average imbalance with respect to total number of m workers and number of sources.
  59. Throughput vs Memory 60 0 200 400 600 800 1000

    1200 1400 1600 0 0.2 0.4 0.6 0.8 1 Throughput (keys/s) (a) CPU delay (ms) PKG SG KG 1000 1100 1200 0 1.105 2.105 3.105 4.105 (b) Memory (counters) 10s 30s 60s 300s 300s 600s 600s PKG SG KG Fig. 5: (a) Throughput for PKG, SG and KG for different CPU delays. (b) Throughput for PKG and SG vs. average memory for different aggregation periods.
  60. Impact Open source https://github.com/gdfm/partial-key-grouping Integrated in Apache Storm 0.10 STORM-632,

    STORM-637 Integrating it in Kafka (Samza) and Flink KAFKA-2091, KAFKA-2092, FLINK-1725 61
  61. Conclusions Mining big data streams is an open frontier Needs

    collaboration between 
 algorithms and systems communities SAMOA: a platform for mining big data streams And for collaboration on distributed stream mining 62 System Algorithm API