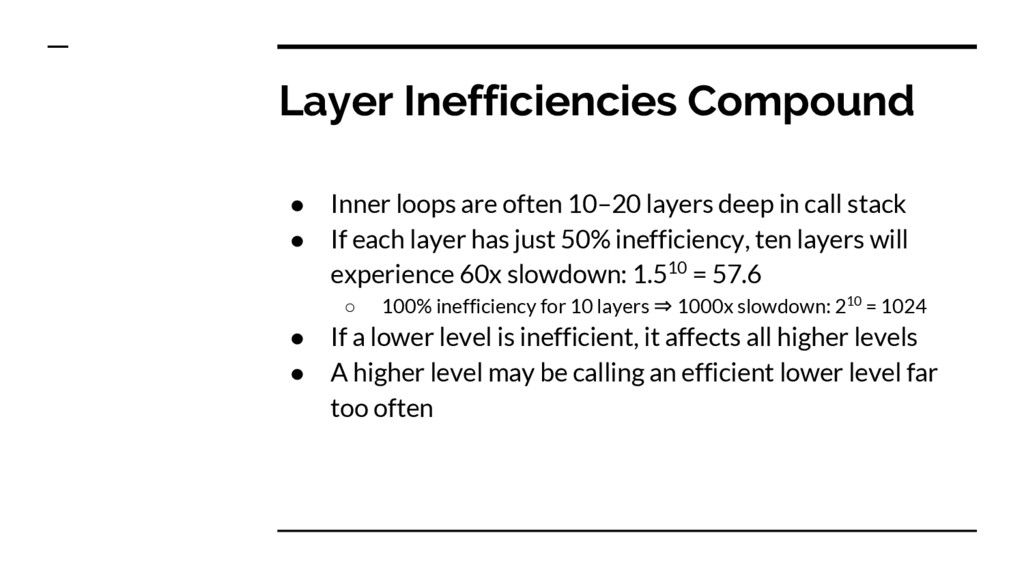
deep in call stack • If each layer has just 50% inefficiency, ten layers will experience 60x slowdown: 1.510 = 57.6 ◦ 100% inefficiency for 10 layers ⇒ 1000x slowdown: 210 = 1024 • If a lower level is inefficient, it affects all higher levels • A higher level may be calling an efficient lower level far too often
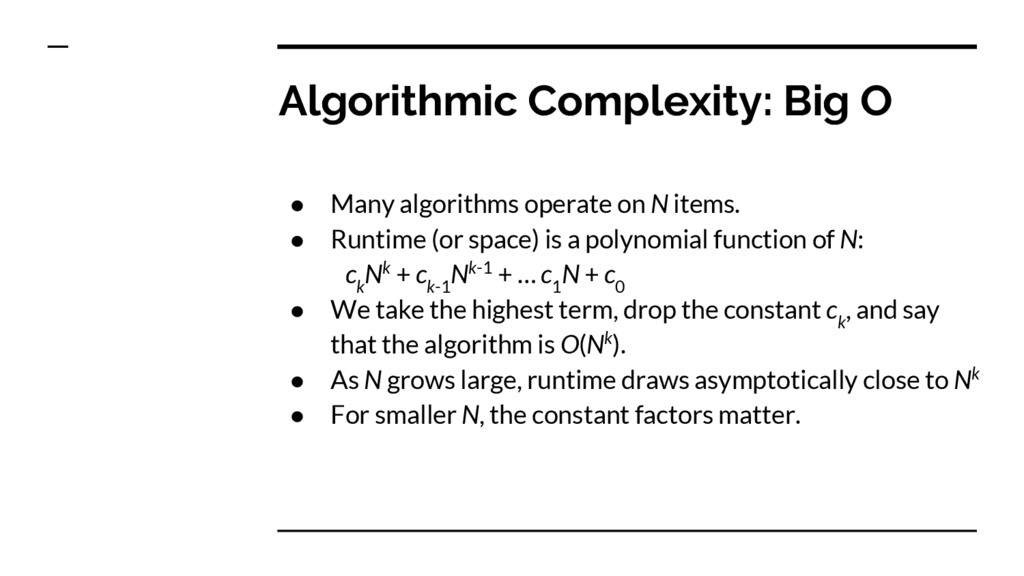
items. • Runtime (or space) is a polynomial function of N: c k Nk + c k-1 Nk-1 + … c 1 N + c 0 • We take the highest term, drop the constant c k , and say that the algorithm is O(Nk). • As N grows large, runtime draws asymptotically close to Nk • For smaller N, the constant factors matter.
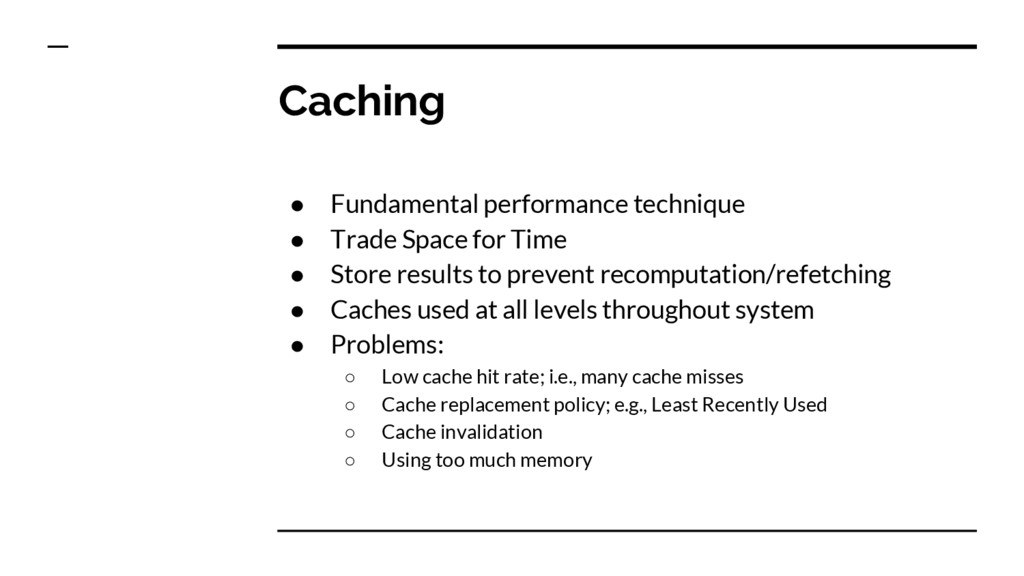
• Store results to prevent recomputation/refetching • Caches used at all levels throughout system • Problems: ◦ Low cache hit rate; i.e., many cache misses ◦ Cache replacement policy; e.g., Least Recently Used ◦ Cache invalidation ◦ Using too much memory
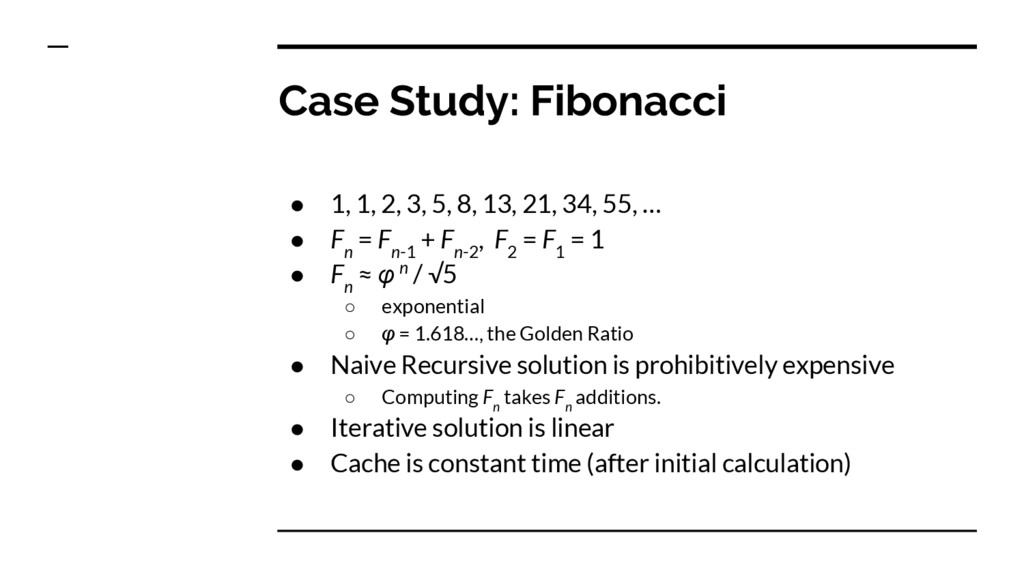
13, 21, 34, 55, … • F n = F n-1 + F n-2 , F 2 = F 1 = 1 • F n ≈ φ n / √5 ◦ exponential ◦ φ = 1.618…, the Golden Ratio • Naive Recursive solution is prohibitively expensive ◦ Computing F n takes F n additions. • Iterative solution is linear • Cache is constant time (after initial calculation)
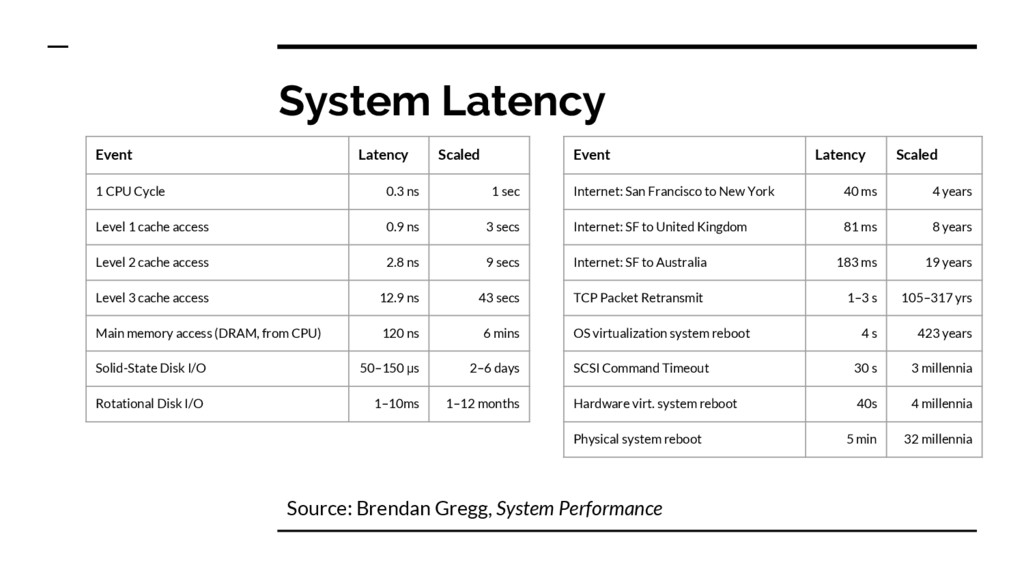
Level 1 cache access 0.9 ns 3 secs Level 2 cache access 2.8 ns 9 secs Level 3 cache access 12.9 ns 43 secs Main memory access (DRAM, from CPU) 120 ns 6 mins Solid-State Disk I/O 50–150 µs 2–6 days Rotational Disk I/O 1–10ms 1–12 months Event Latency Scaled Internet: San Francisco to New York 40 ms 4 years Internet: SF to United Kingdom 81 ms 8 years Internet: SF to Australia 183 ms 19 years TCP Packet Retransmit 1–3 s 105–317 yrs OS virtualization system reboot 4 s 423 years SCSI Command Timeout 30 s 3 millennia Hardware virt. system reboot 40s 4 millennia Physical system reboot 5 min 32 millennia System Latency Source: Brendan Gregg, System Performance
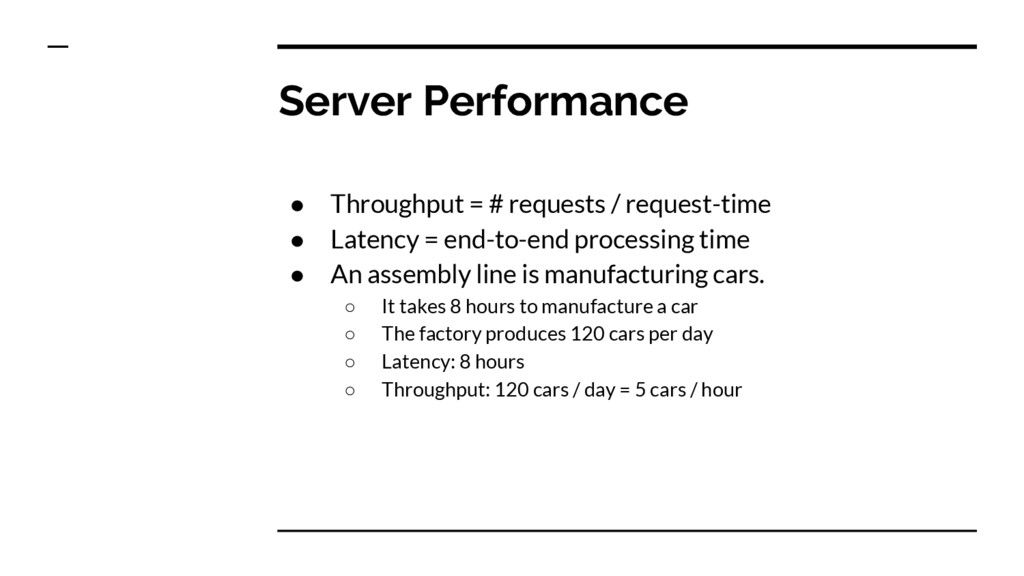
Latency = end-to-end processing time • An assembly line is manufacturing cars. ◦ It takes 8 hours to manufacture a car ◦ The factory produces 120 cars per day ◦ Latency: 8 hours ◦ Throughput: 120 cars / day = 5 cars / hour
or worrying about, the speed of noncritical parts of their programs, and these attempts at efficiency actually have a strong negative impact when debugging and maintenance are considered. We should forget about small efficiencies, say about 97% of the time: premature optimization is the root of all evil. Yet we should not pass up our opportunities in that critical 3%.” — Donald Knuth
runtime • Changes with high expectations often disappoint • Correctness is more important than efficiency • Metrics & Instrumentation • Logs • Profiling
Scale Up (Vertical) ◦ More CPUs, more RAM. ◦ You can’t buy (or afford) a 1,000,000-core system with petabyte RAM • Scale Out (Horizontal) ◦ Add more and more commodity machines • Bottlenecks • Scale Down ◦ Embedded systems ◦ More containers per host