AGT IoT Events Offering Investors Value Prop Presentation
This deck was created as a value proposition introduction for the AGT Social Internet of Things (IoT) events offering to potential investors and partners.
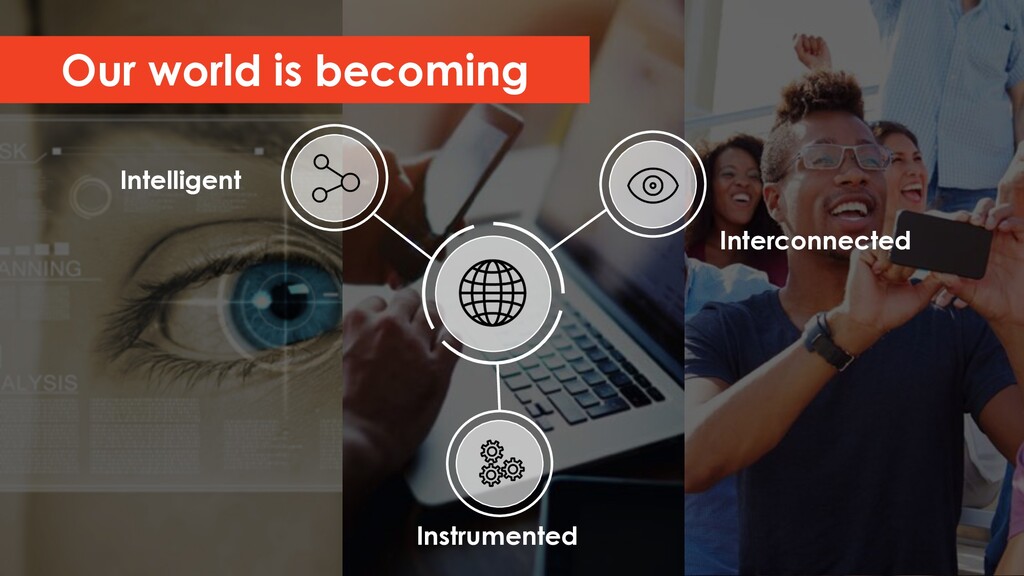
Connected vehicles Traffic Web sites Machine-to-Machine Apps Mobile Energy E-Health Our world is becoming Smart infrastructure Advertising Personalized content Smart building
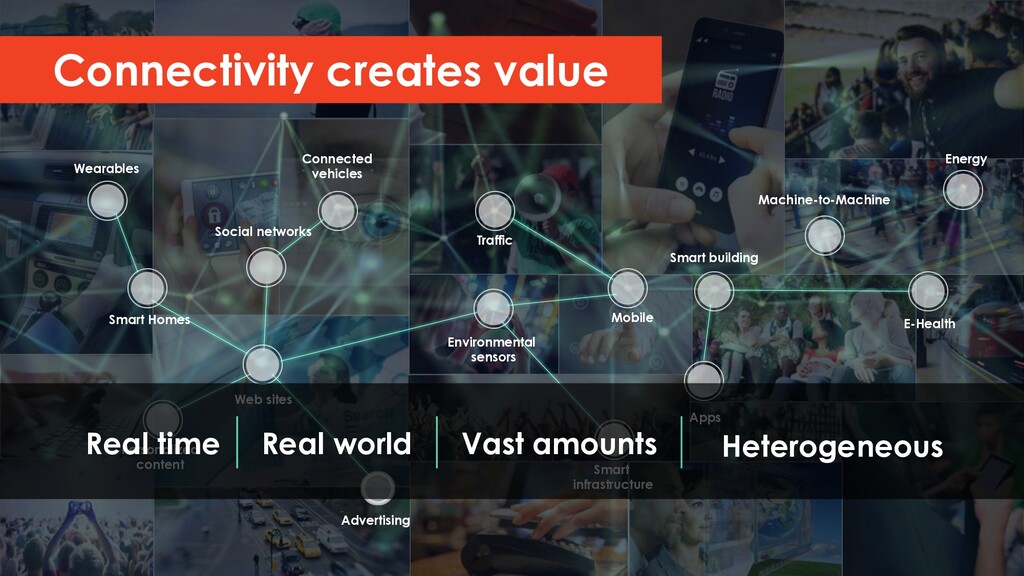
Web sites Machine-to-Machine Apps Mobile Energy E-Health Smart infrastructure Advertising Personalized content Smart building Connectivity creates value Real time Real world Vast amounts Heterogeneous
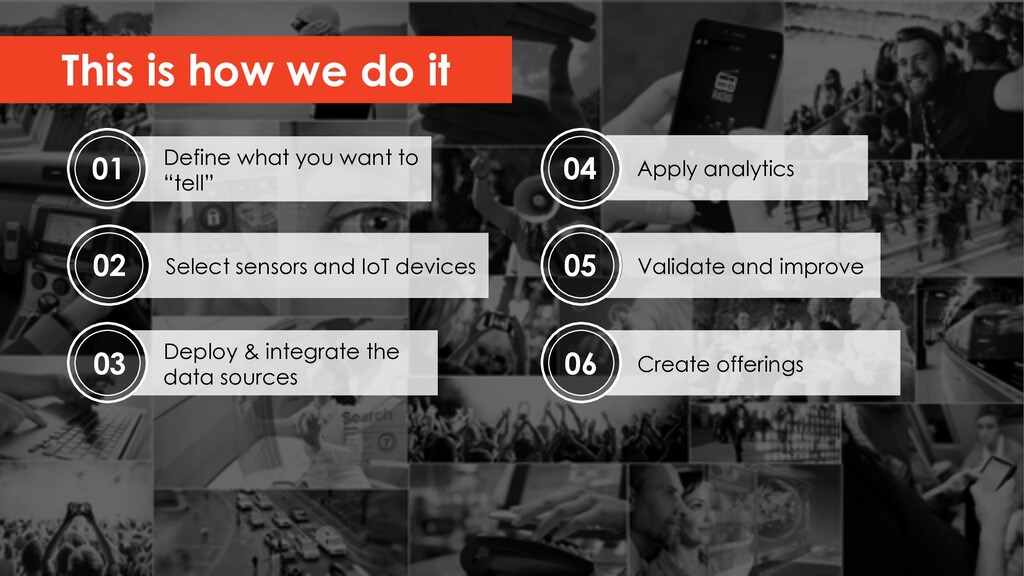
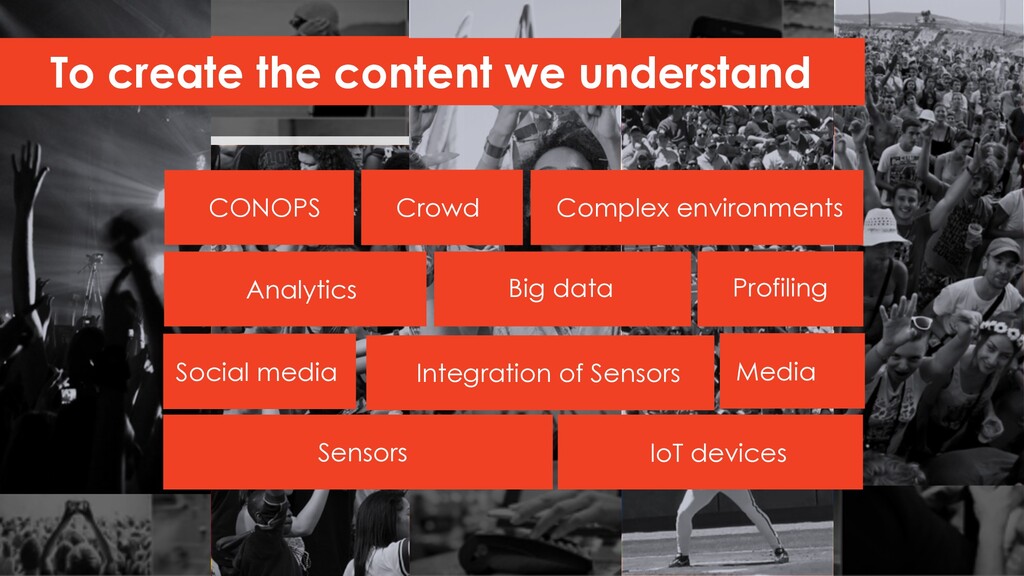
Define what you want to “tell” 01 Select sensors and IoT devices 02 03 Deploy & integrate the data sources This is how we do it To create the content we understand CONOPS Crowd Complex environments Sensors Big data Profiling Integration of Sensors Media Social media IoT devices Analytics
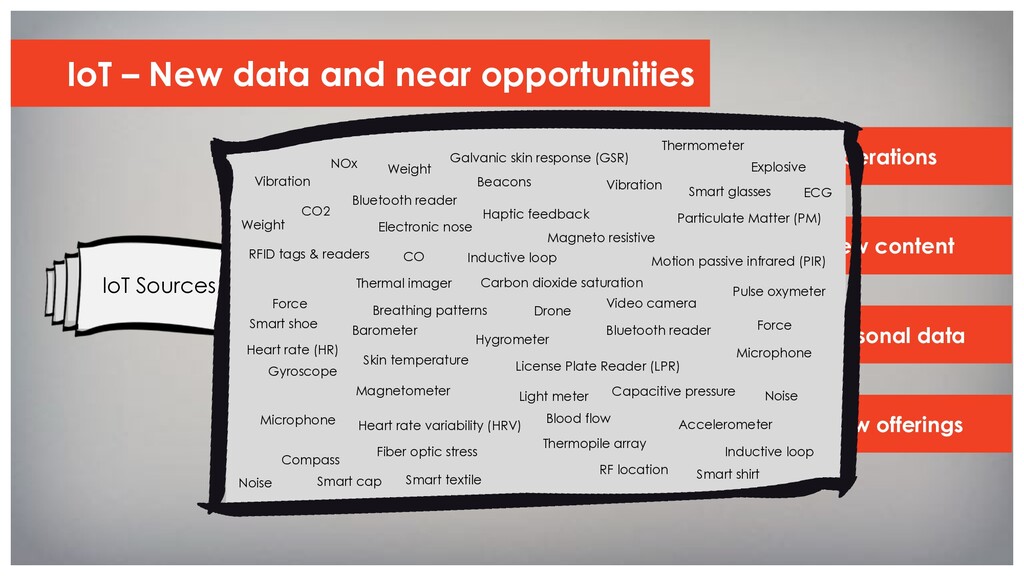
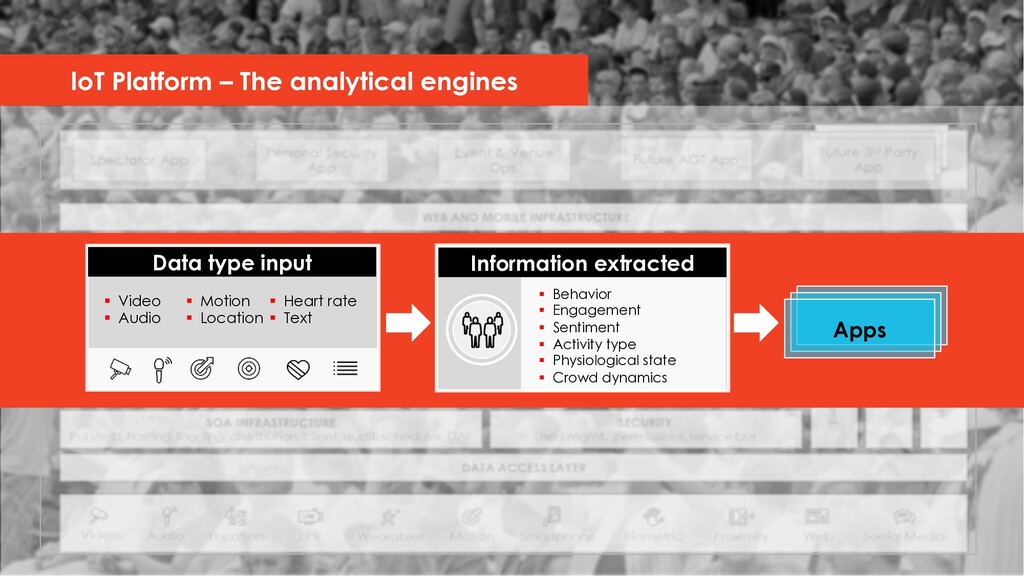
- from data to applications Endless applications New data layer New IoT platforms Collect Connect Analyze Venue Crowd Individual Social IoT data Performance Sensor data User generated data
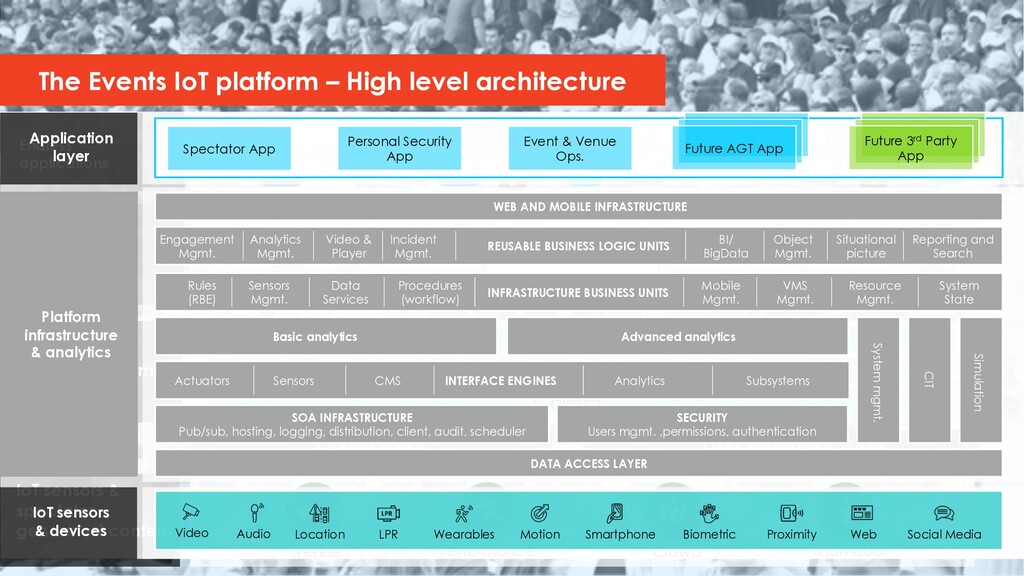
layer IoT sensors & spectator generated content New IoT platforms Collect Connect Analyze Venue Crowd Individual Performance Sensor data User generate data Audio LPR Location Video Motion Smartphone Proximity Wearables Social Media Web Biometric DATA ACCESS LAYER SOA INFRASTRUCTURE Pub/sub, hosting, logging, distribution, client, audit, scheduler SECURITY Users mgmt. ,permissions, authentication Actuators Sensors CMS Analytics Subsystems INTERFACE ENGINES Basic analytics Advanced analytics System mgmt. Simulation CIT INFRASTRUCTURE BUSINESS UNITS Rules (RBE) Sensors Mgmt. Data Services Procedures (workflow) Mobile Mgmt. VMS Mgmt. Resource Mgmt. System State REUSABLE BUSINESS LOGIC UNITS Engagement Mgmt. Analytics Mgmt. Video & Player Incident Mgmt. BI/ BigData Object Mgmt. Situational picture Reporting and Search WEB AND MOBILE INFRASTRUCTURE Spectator App Personal Security App Event & Venue Ops. Future 3rd Party App Future AGT App Application layer Platform infrastructure & analytics IoT sensors & devices The Events IoT platform – High level architecture
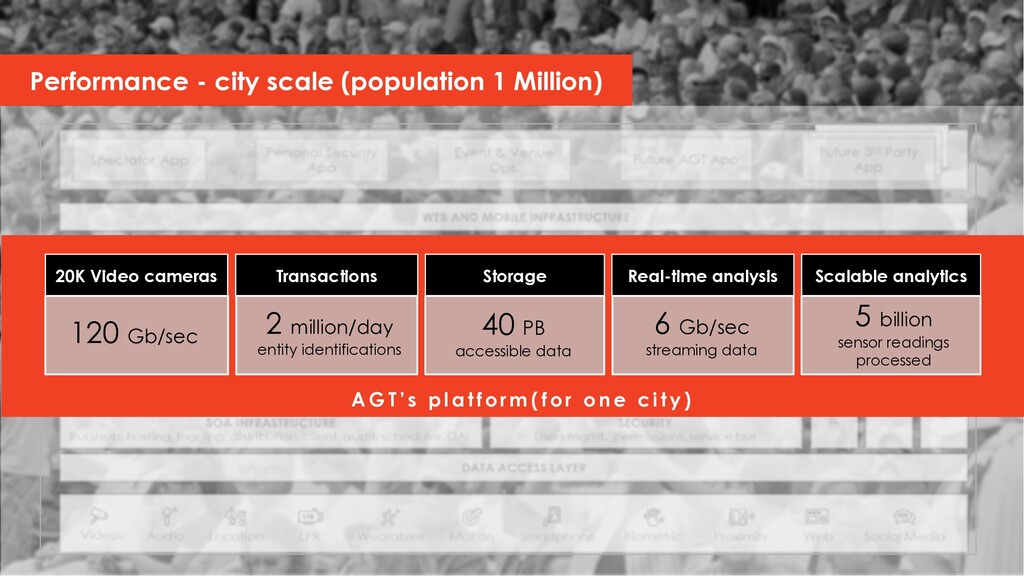
(population 1 Million) 20K Video cameras 120 Gb/sec Transactions 2 million/day entity identifications Storage 40 PB accessible data Real-time analysis 6 Gb/sec streaming data Scalable analytics 5 billion sensor readings processed A G T ’ s p l a t f o r m ( f o r o n e c i t y )
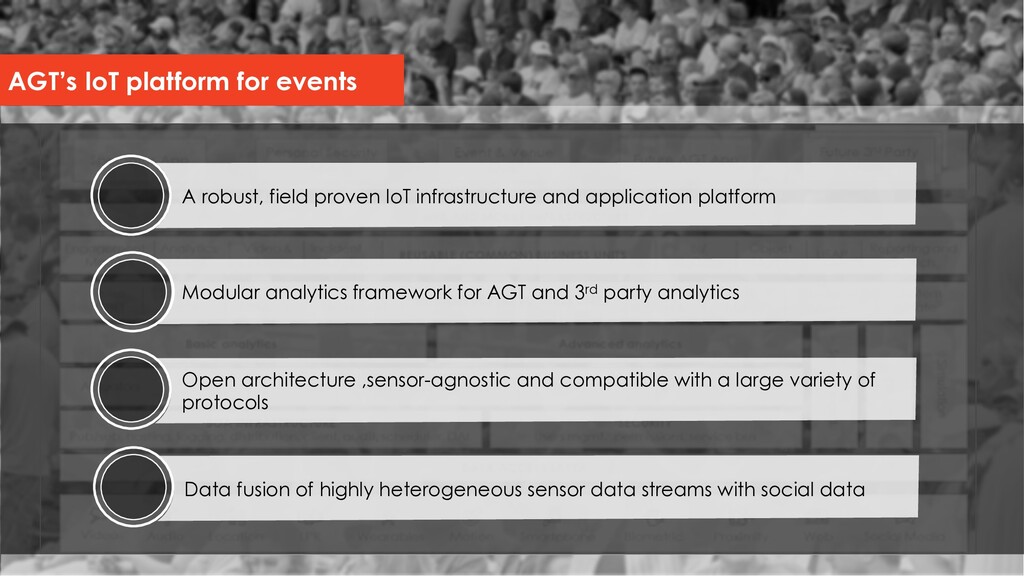
infrastructure and application platform Modular analytics framework for AGT and 3rd party analytics Open architecture ,sensor-agnostic and compatible with a large variety of protocols Data fusion of highly heterogeneous sensor data streams with social data
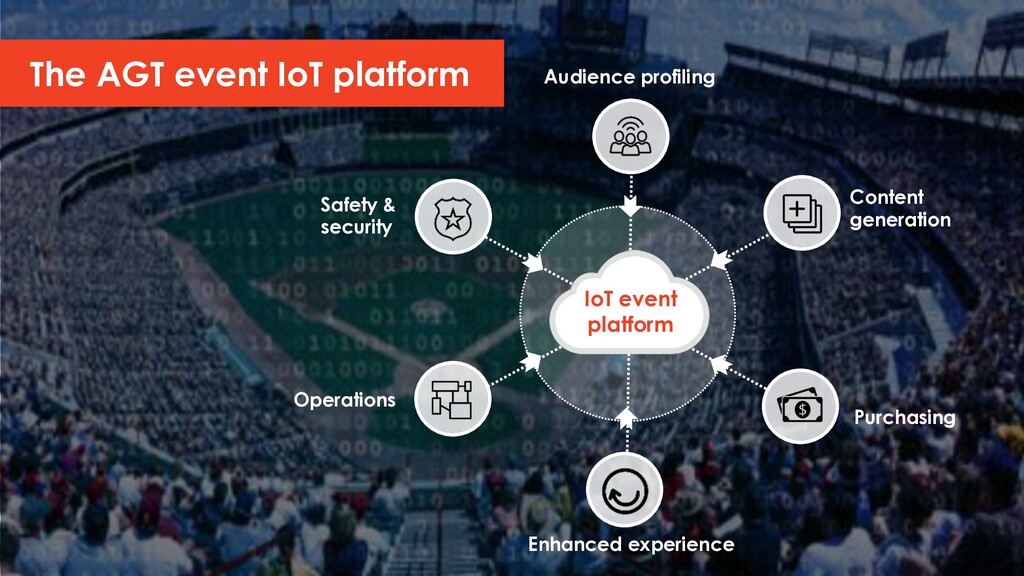
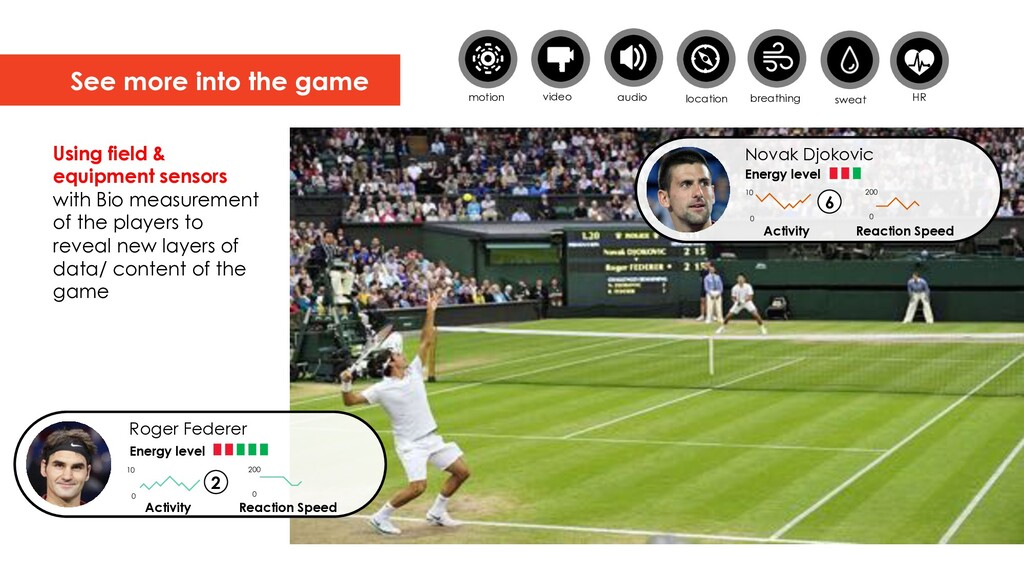
► Reveal new layers of data/ content about the game About the fans ► The story of the crowd Interaction between fans and teams ► New ways to participate and create content Behind the scenes ► A social IoT medium for for a talent to share with his fans Around the stadium ► New stories about the crowd before and after the game Games & gambling ► IoT data that fuels additional monetizable engagement Personalized event content ► Capture YOUR big moments of the event based on IoT gathered and analyzed data
players to reveal new layers of data/ content of the game See more into the game ` Roger Federer Novak Djokovic Activity 0 10 Reaction Speed 0 200 Activity 0 10 Reaction Speed 0 200 Energy level Energy level motion video location audio HR breathing sweat 2 6
establish ongoing ‘state of the crowd’: vibes, sentiments, activity, demographics Run video analytics to obtain a new insight on the crowd loyalty to the performer and brands wearables motion video Image processing video analysis location audio sentiment analytics 21% of Barcelona fans are wearing the Barcelona colors 50% of Real Madrid fans are wearing the Real colors Fan loyalty 12k people are wearing Nike hats Brand loyalty
digital contest board capturing excitement Incentivizing the fans through capturing the most enthusiastic fans on the big video screens Community manager driving engagement via haptic and visual signaling INSANE QUIET motion video audio location haptic
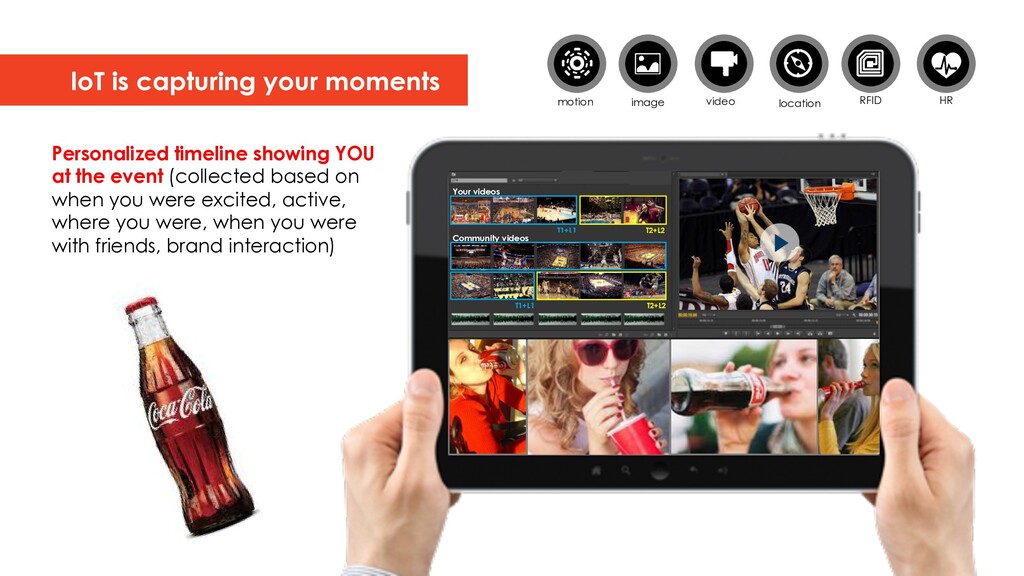
videos Community videos Personalized timeline showing YOU at the event (collected based on when you were excited, active, where you were, when you were with friends, brand interaction) motion video image location RFID HR
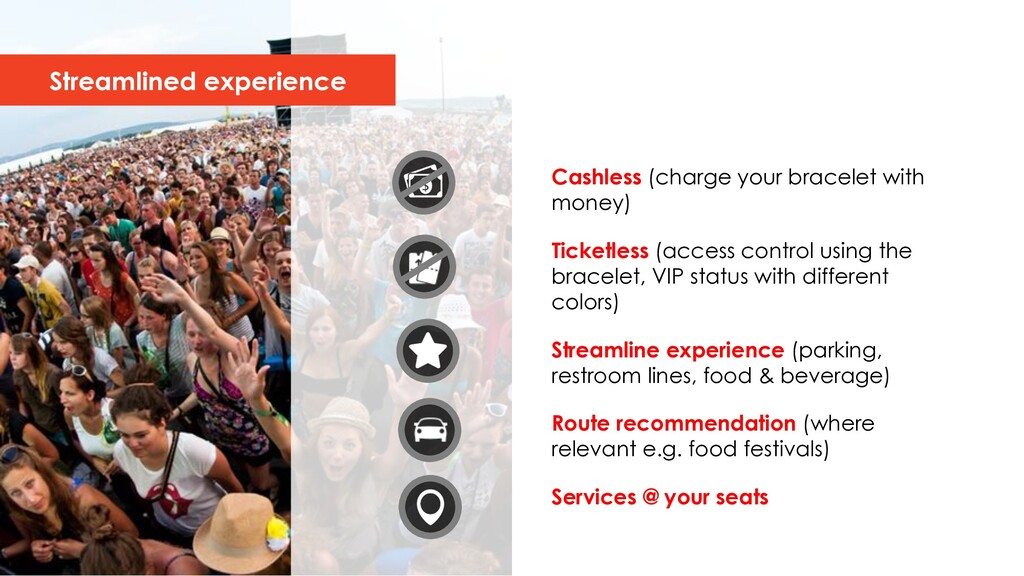
the bracelet, VIP status with different colors) Streamline experience (parking, restroom lines, food & beverage) Route recommendation (where relevant e.g. food festivals) Services @ your seats Streamlined experience
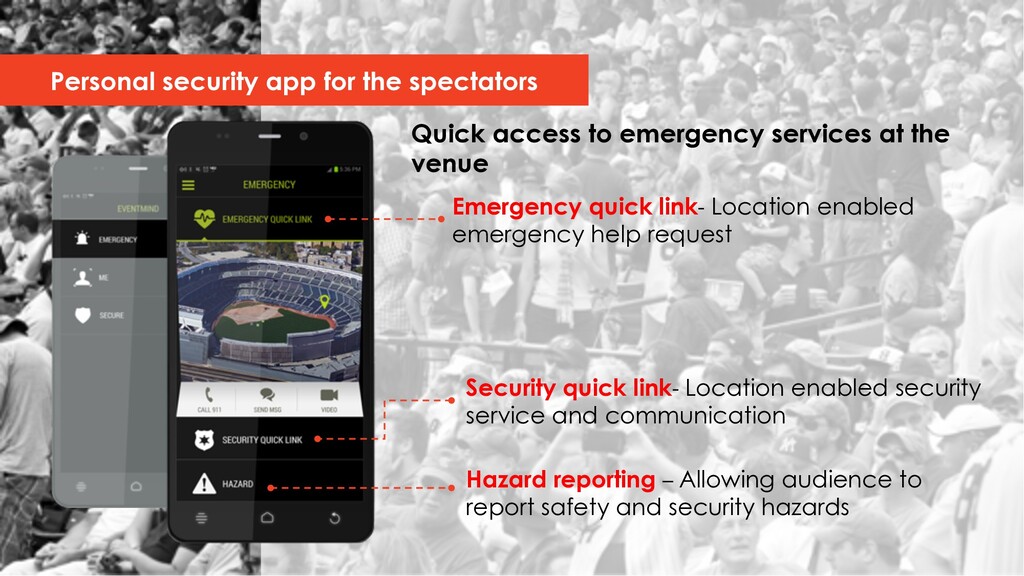
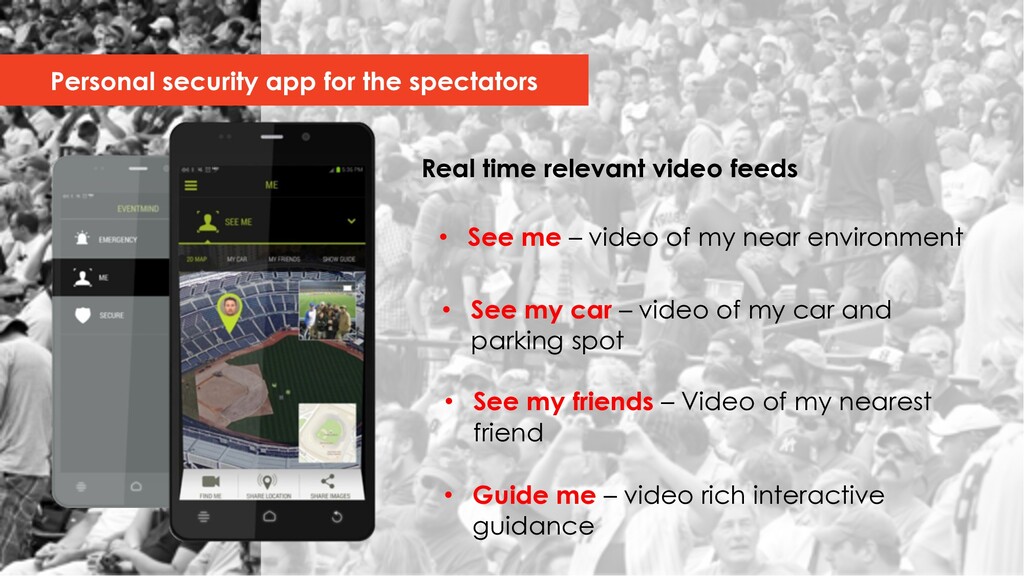
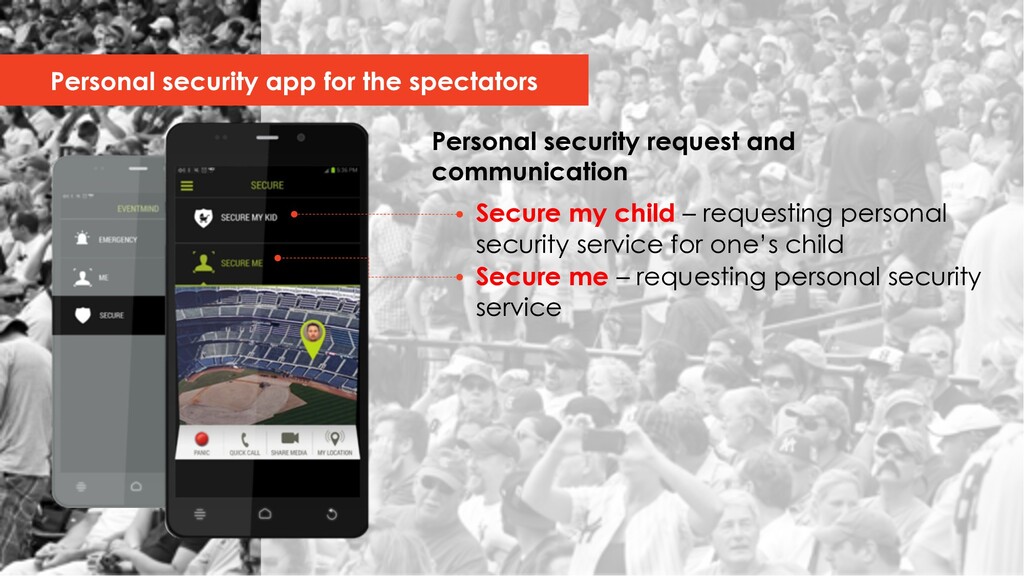
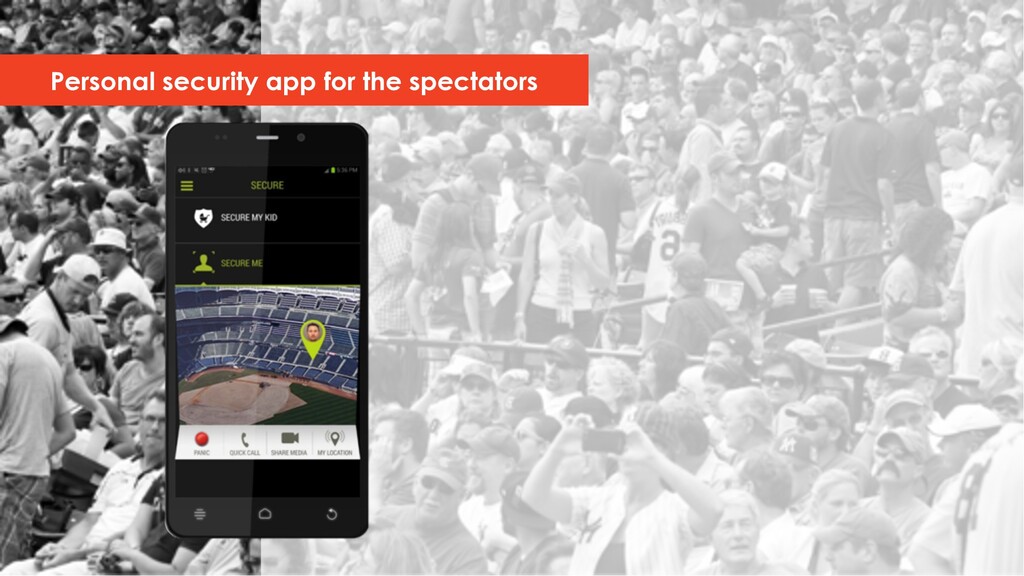
app for the spectators Emergency quick link- Location enabled emergency help request Hazard reporting – Allowing audience to report safety and security hazards Security quick link- Location enabled security service and communication
spectators • See my friends – Video of my nearest friend • Guide me – video rich interactive guidance • See my car – video of my car and parking spot • See me – video of my near environment