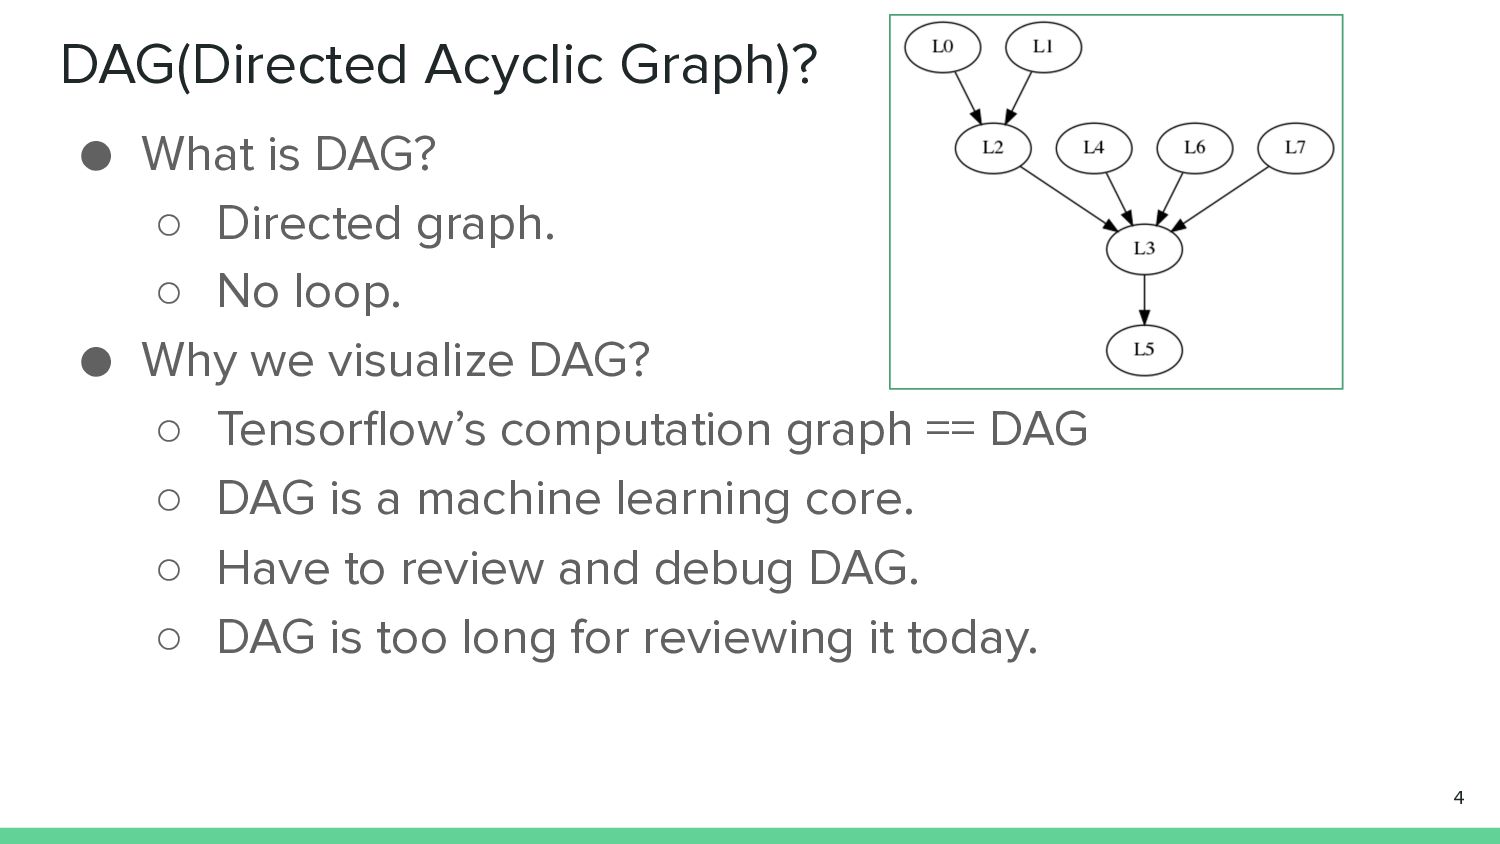
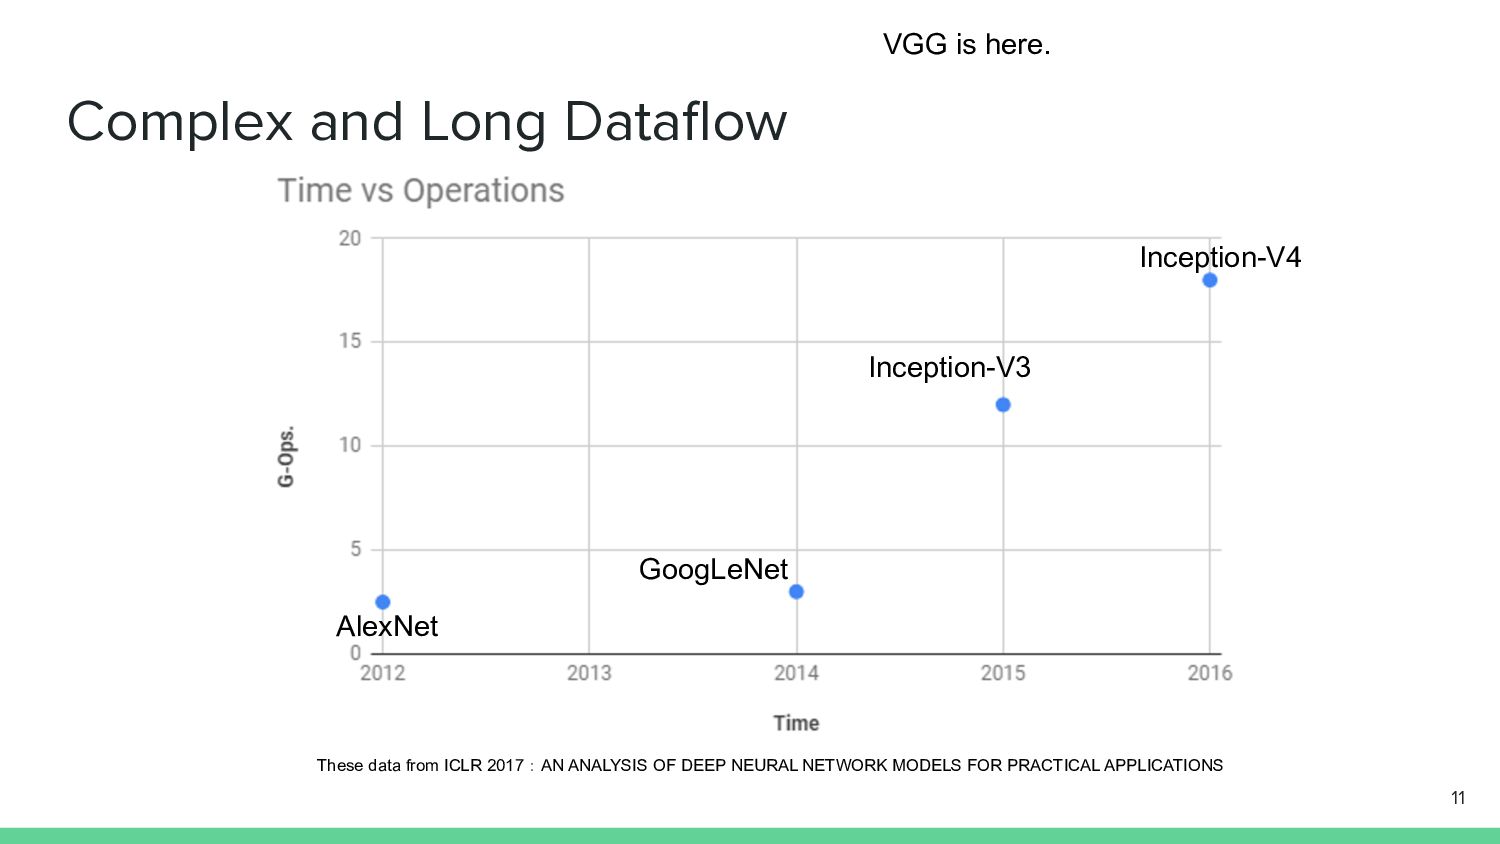
◦ No loop. • Why we visualize DAG? ◦ Tensorflow’s computation graph == DAG ◦ DAG is a machine learning core. ◦ Have to review and debug DAG. ◦ DAG is too long for reviewing it today. 4
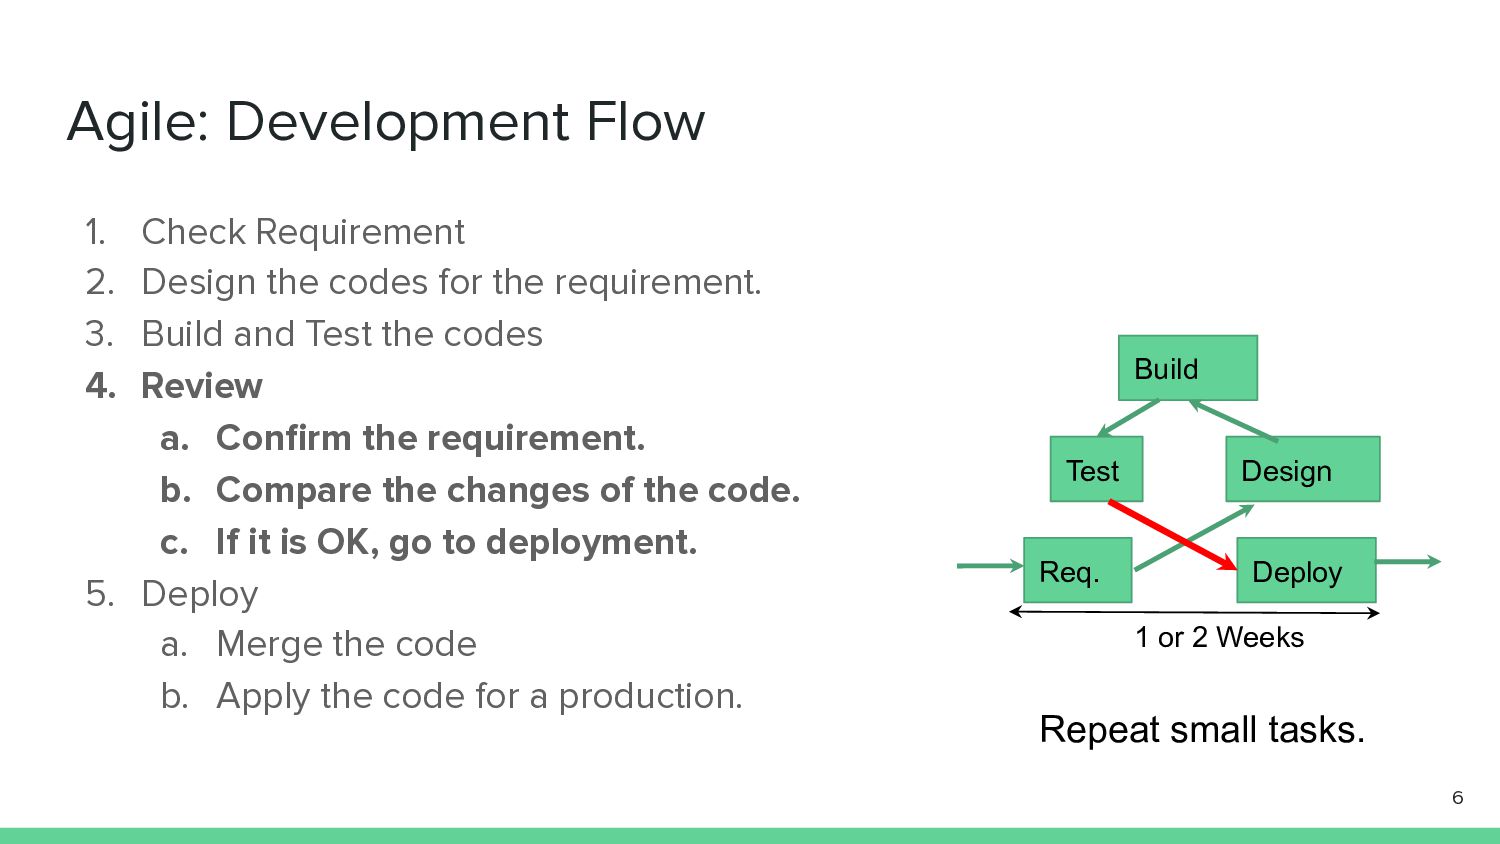
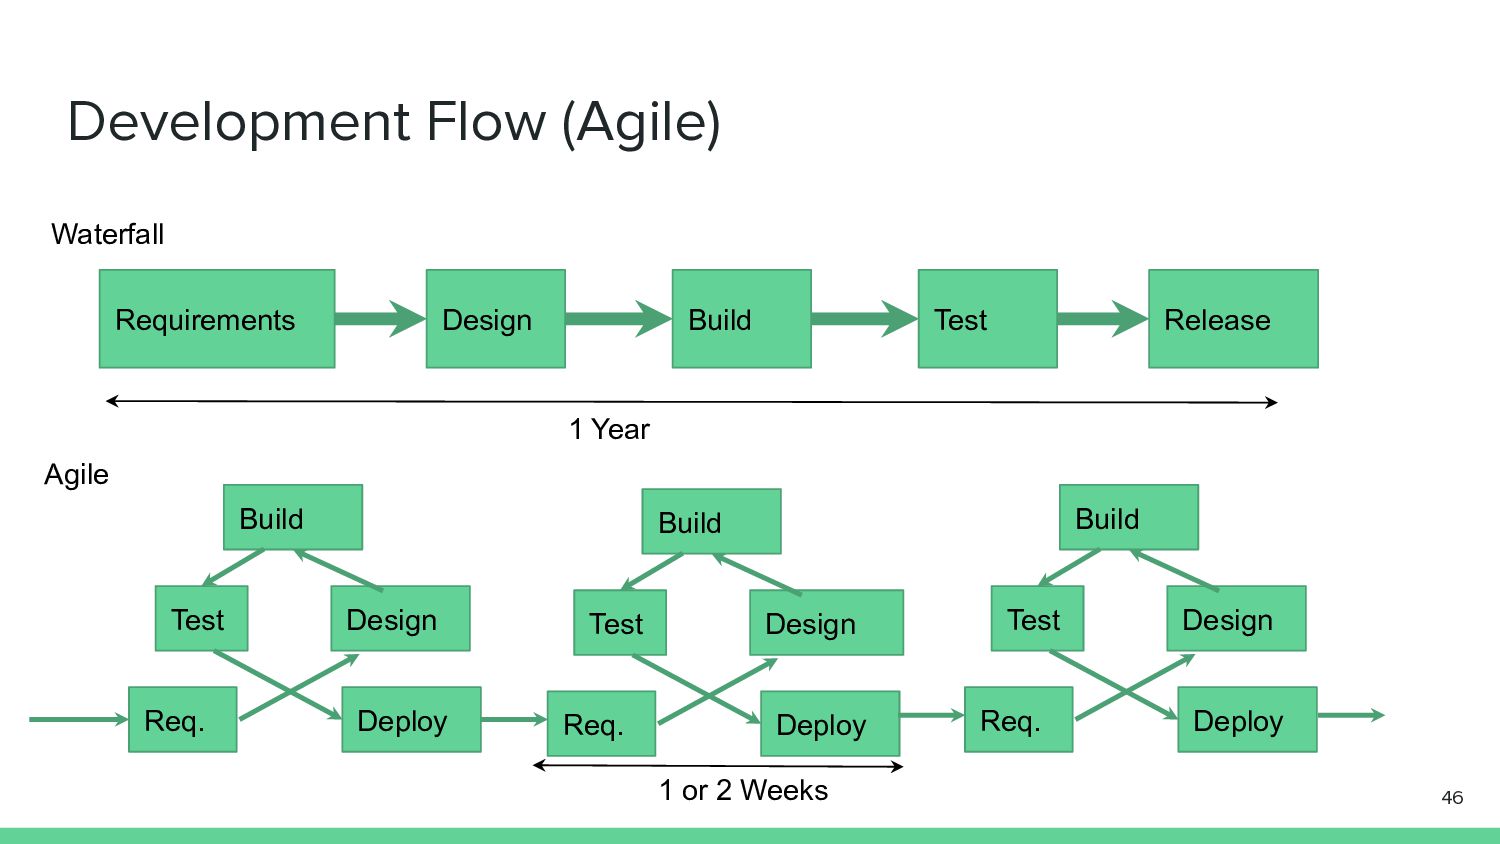
for the requirement. 3. Build and Test the codes 4. Review a. Confirm the requirement. b. Compare the changes of the code. c. If it is OK, go to deployment. 5. Deploy a. Merge the code b. Apply the code for a production. 6 Req. Design Build Deploy Test 1 or 2 Weeks Repeat small tasks.
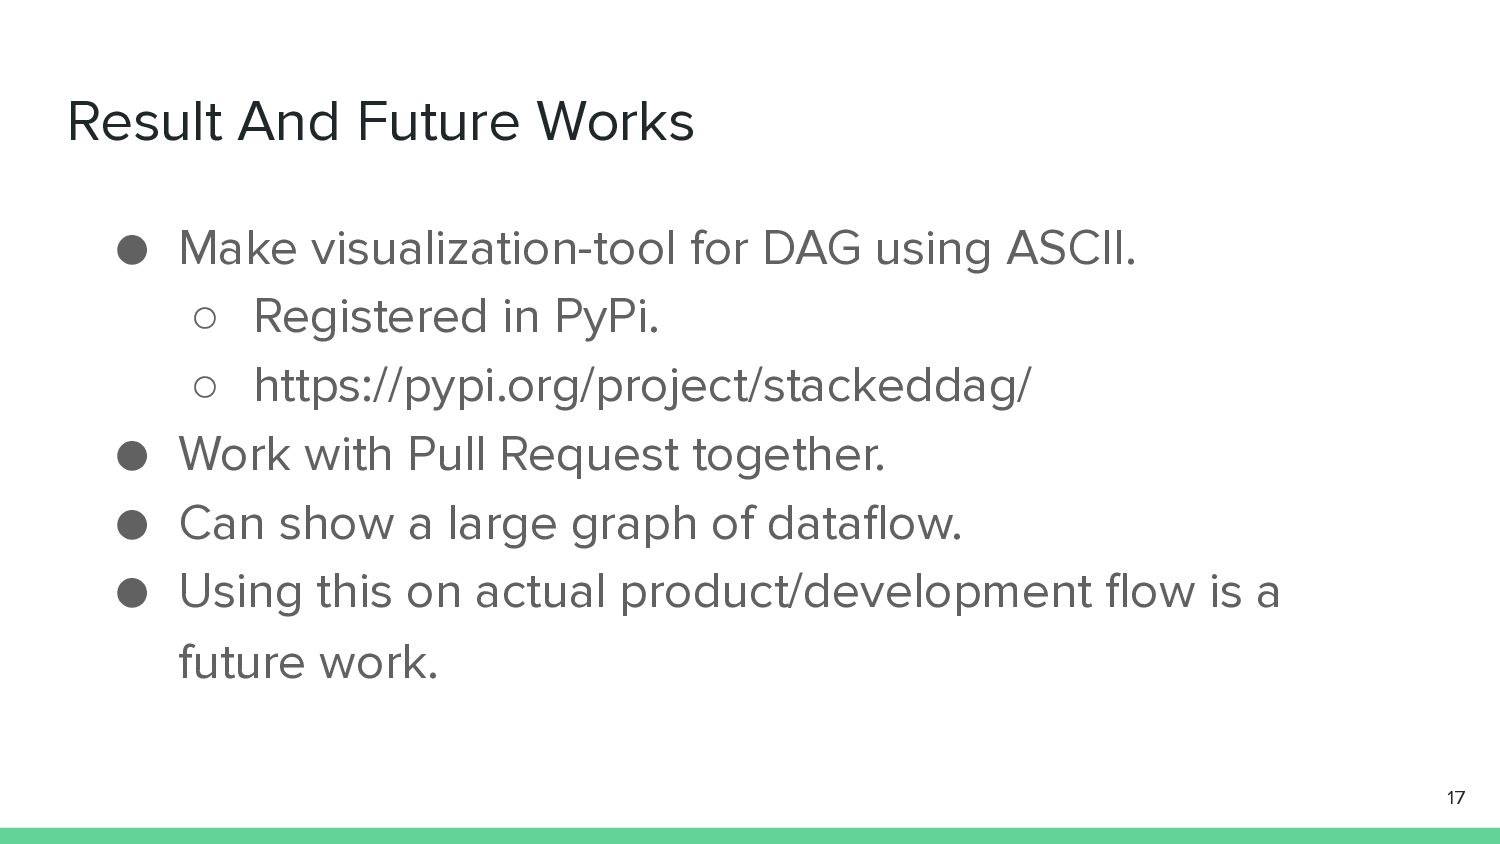
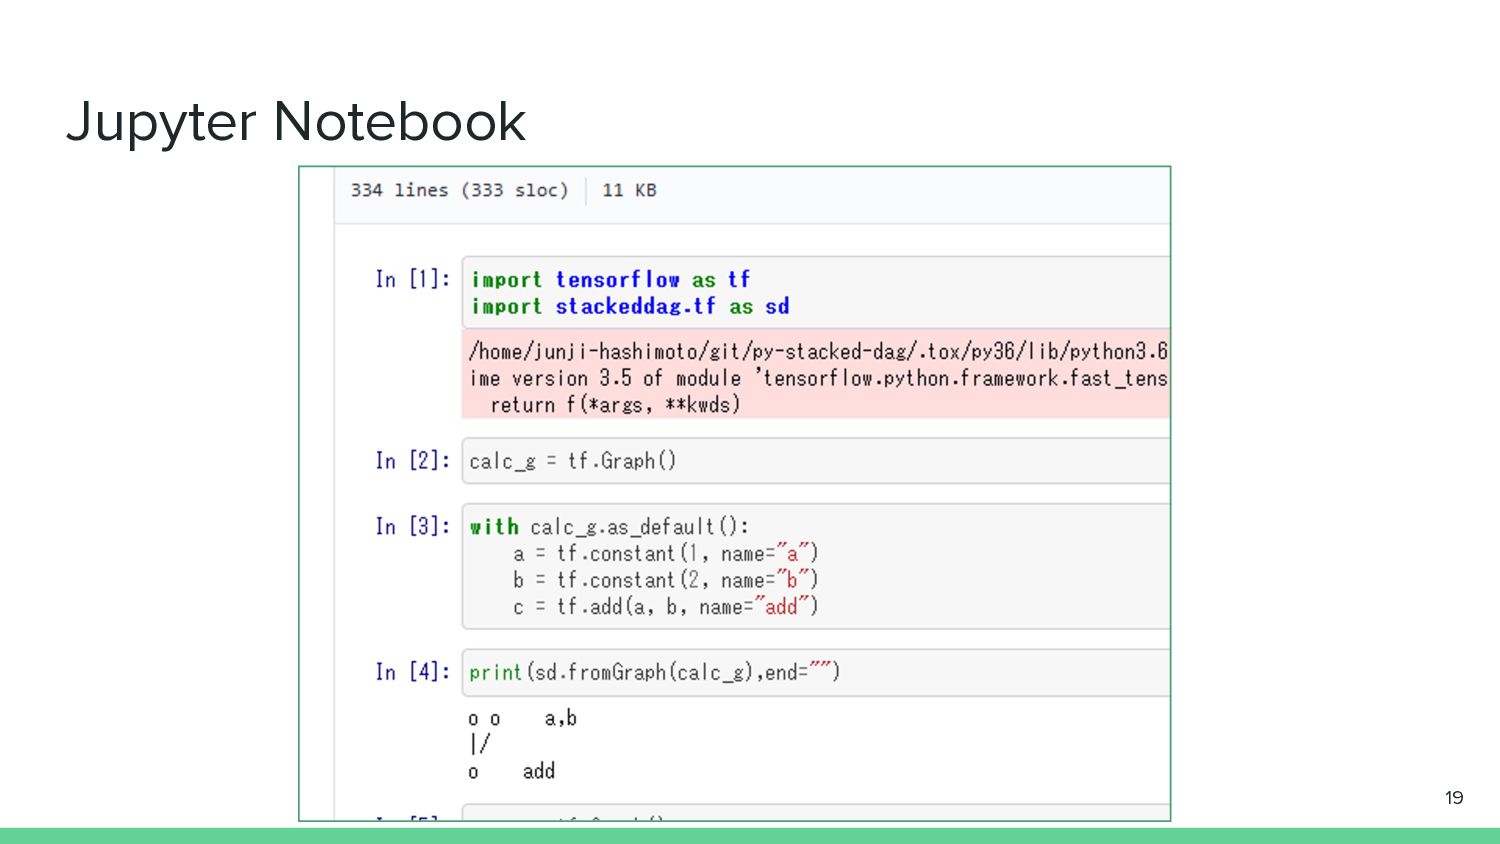
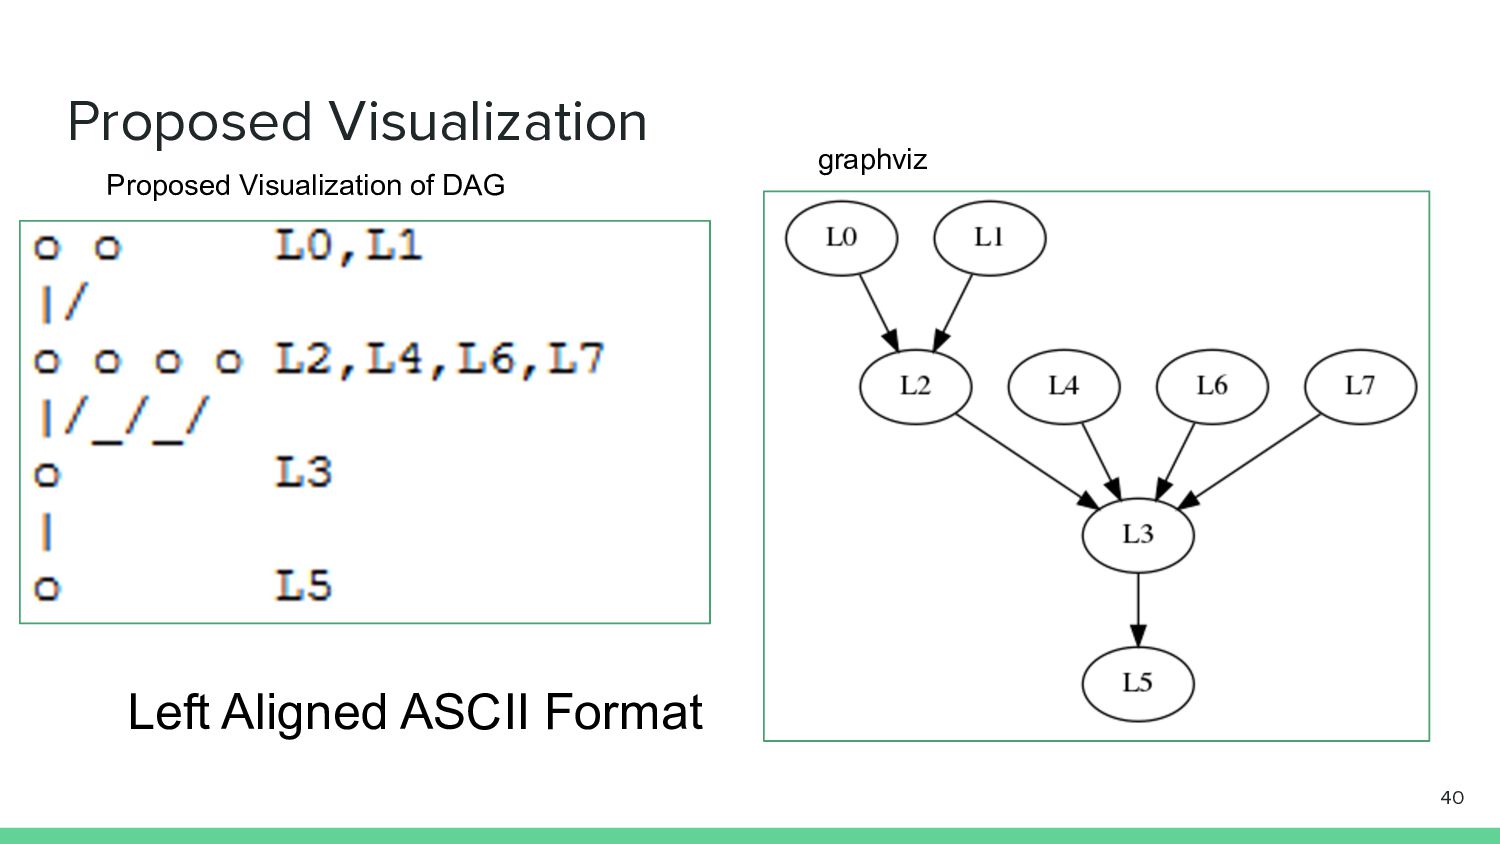
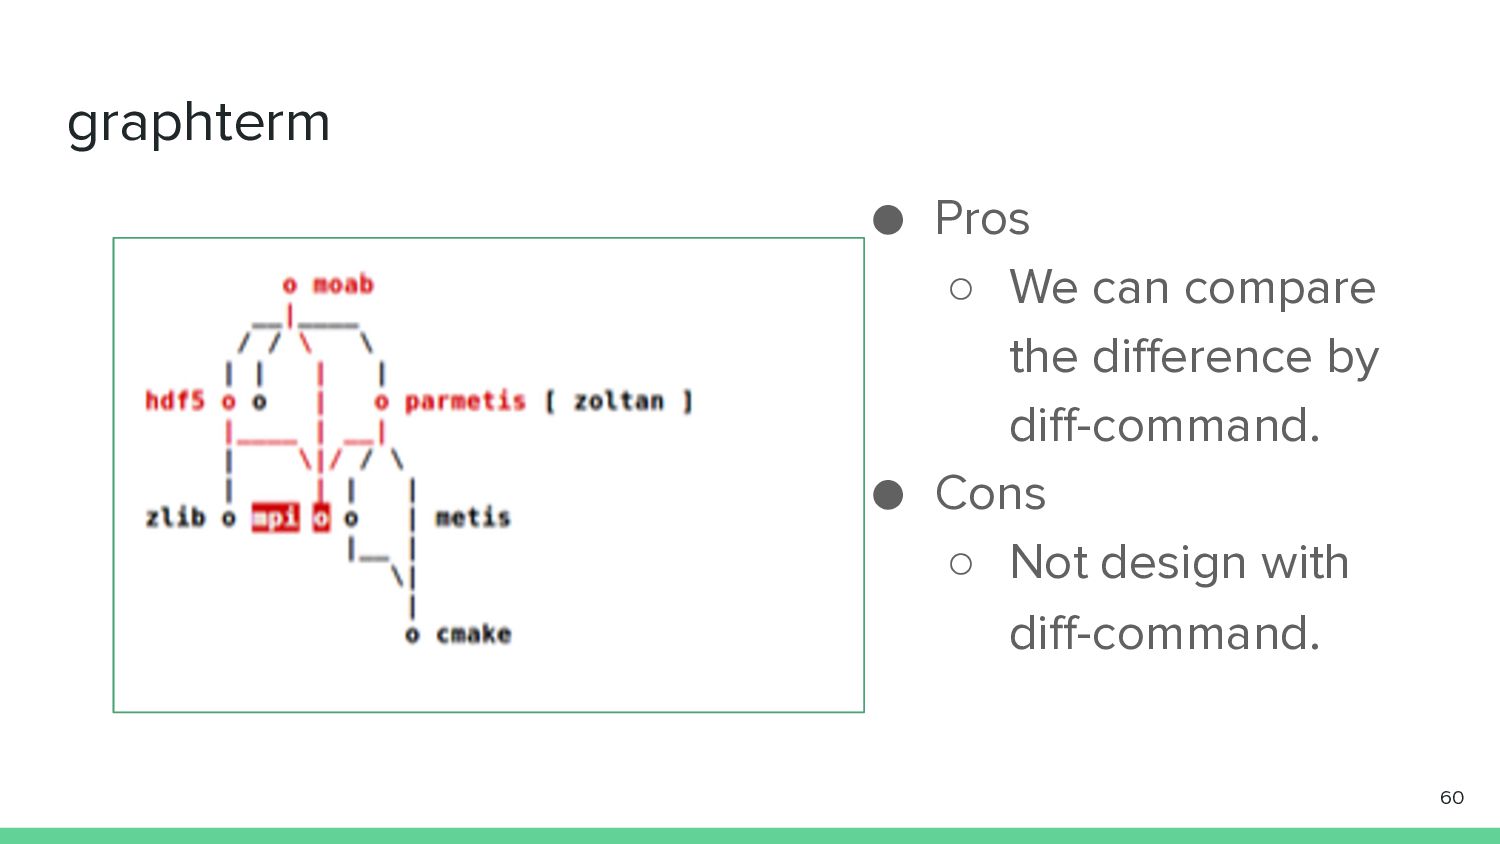
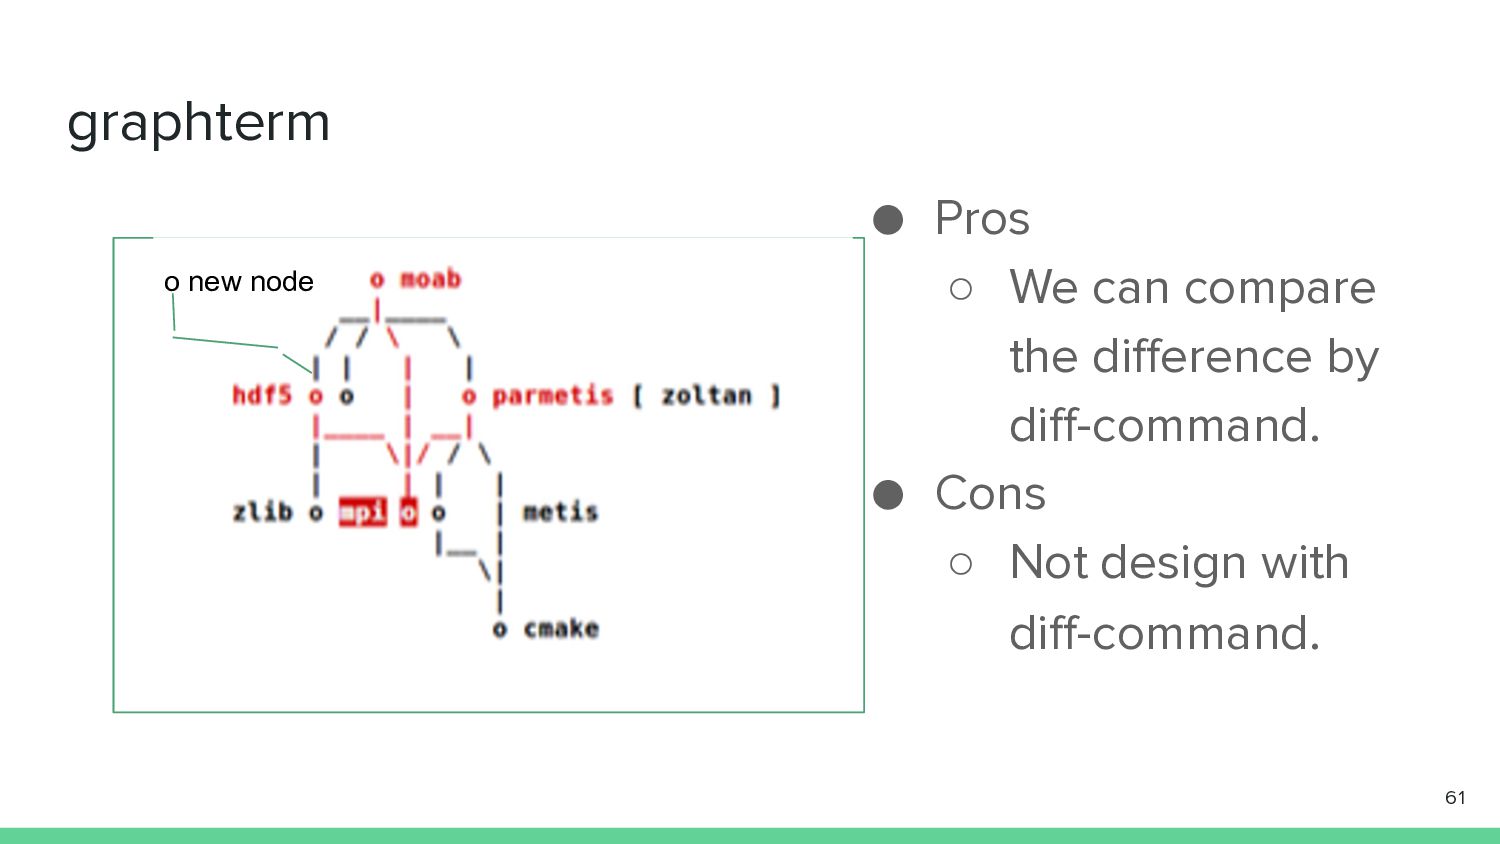
ASCII. ◦ Registered in PyPi. ◦ https://pypi.org/project/stackeddag/ • Work with Pull Request together. • Can show a large graph of dataflow. • Using this on actual product/development flow is a future work. 17
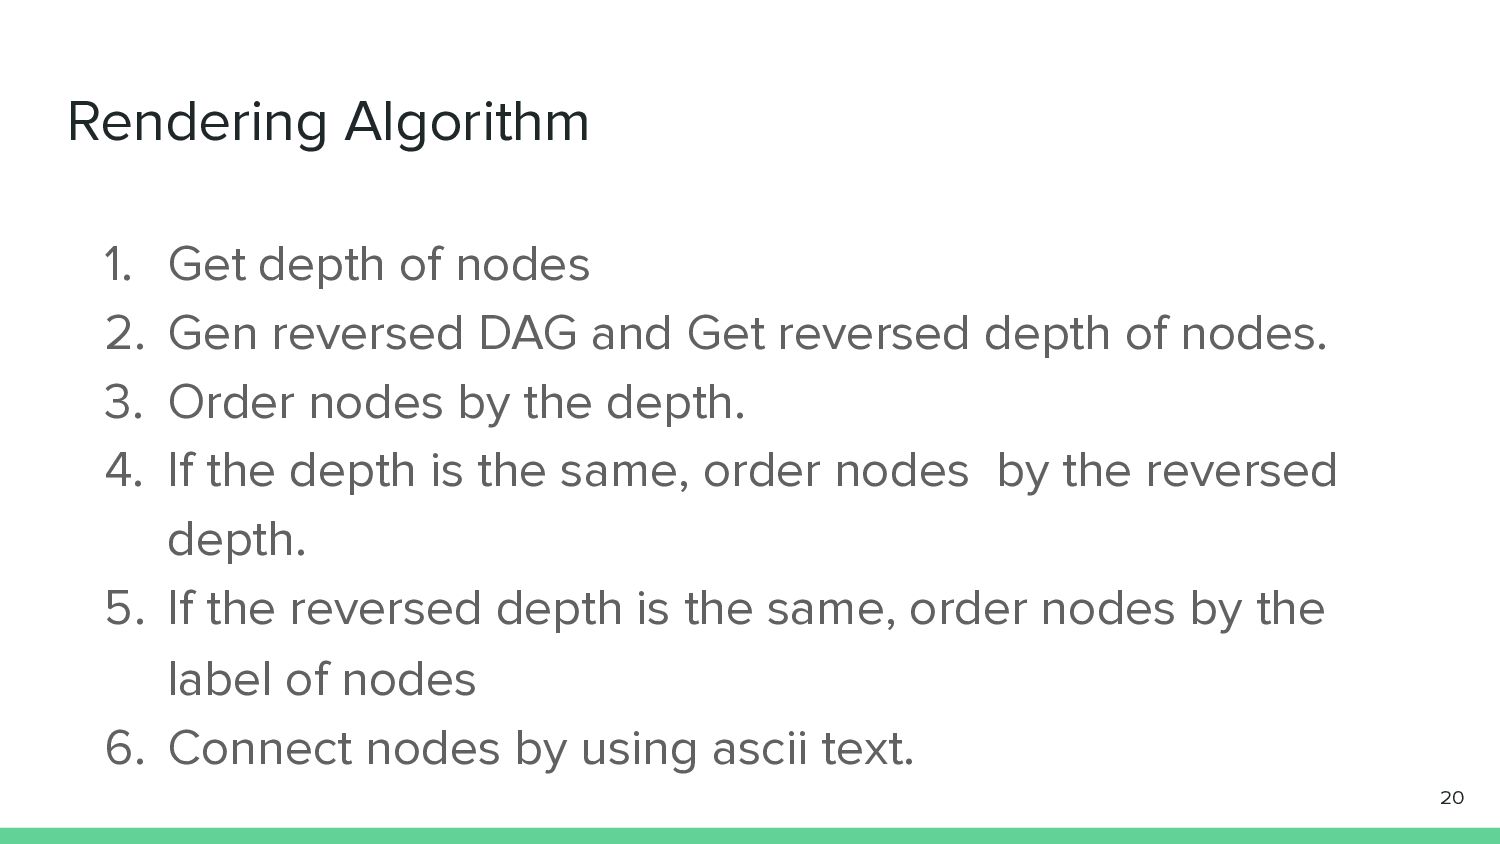
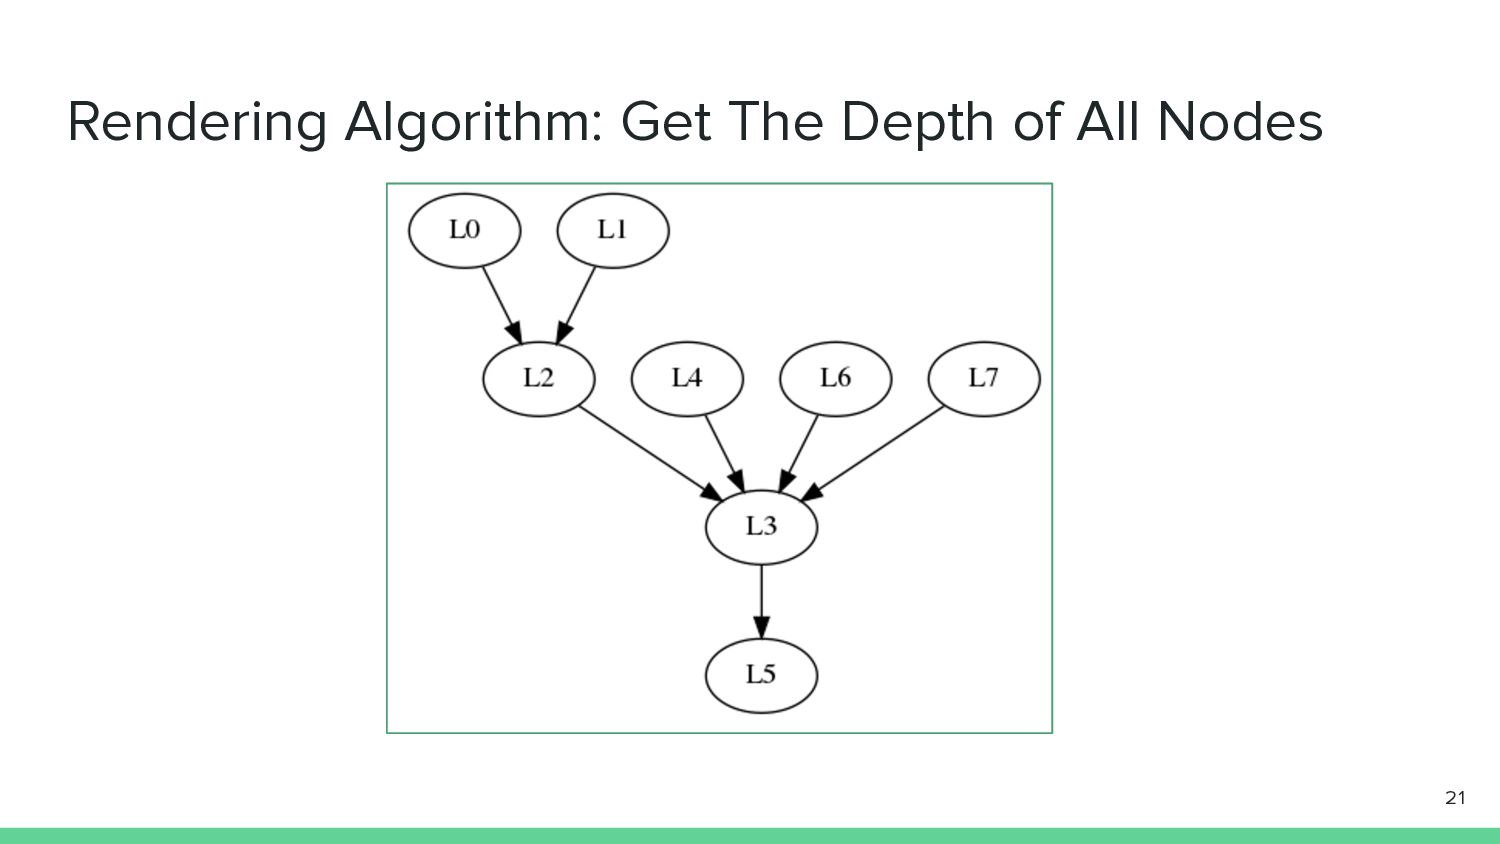
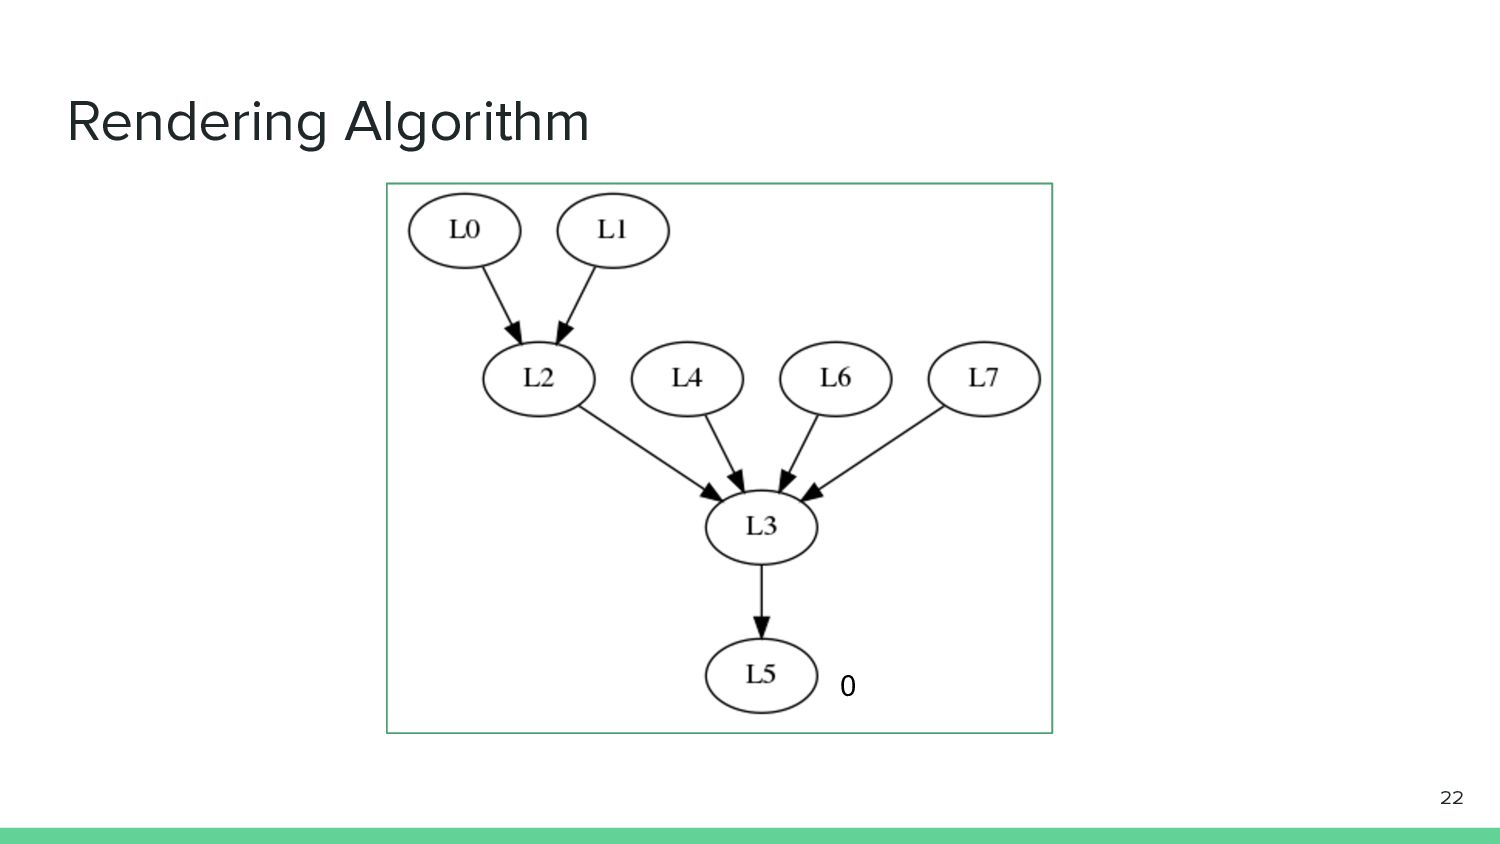
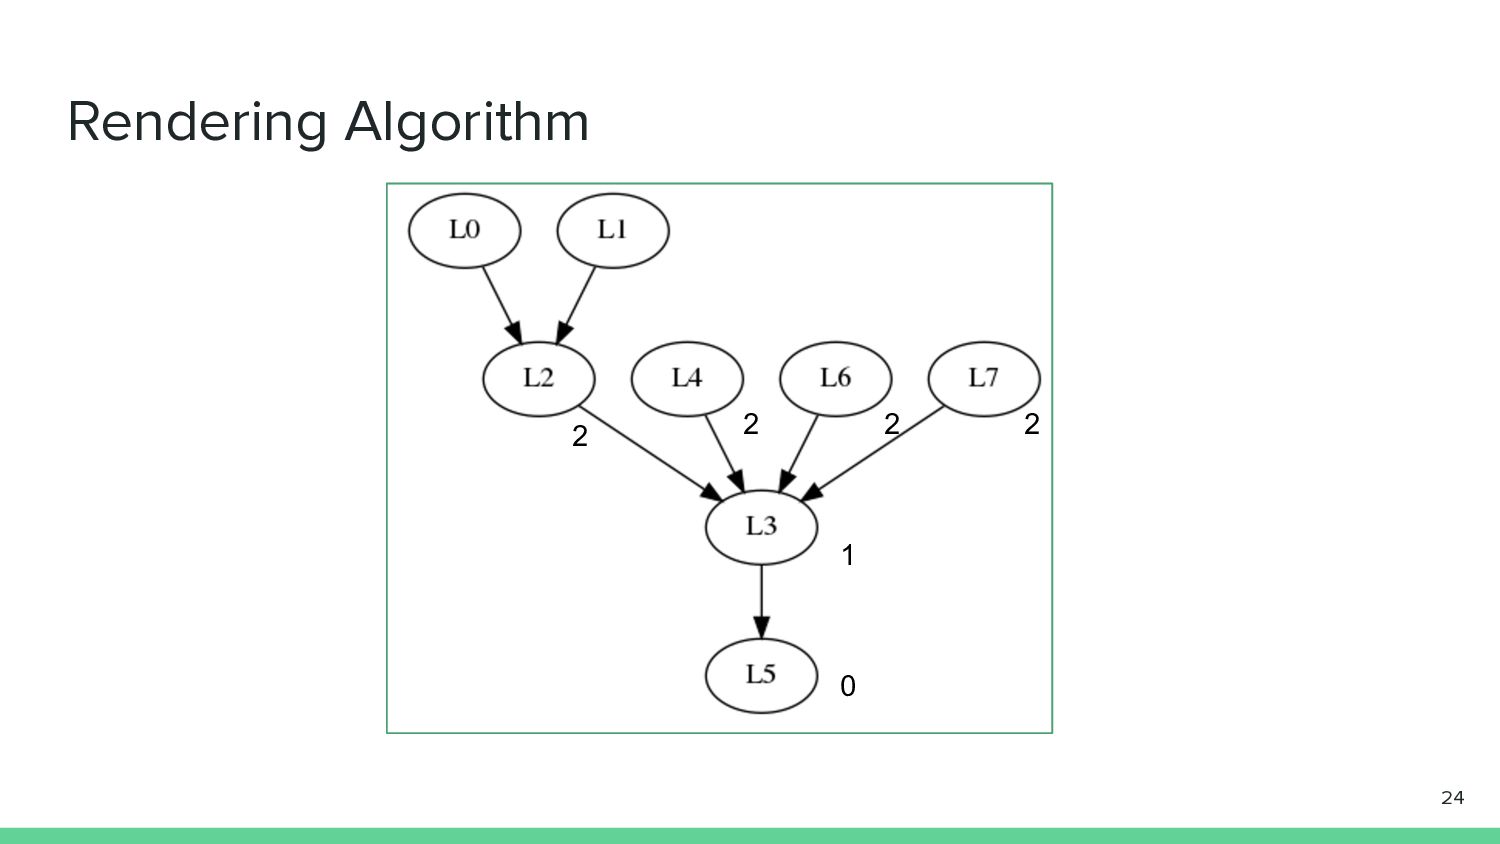
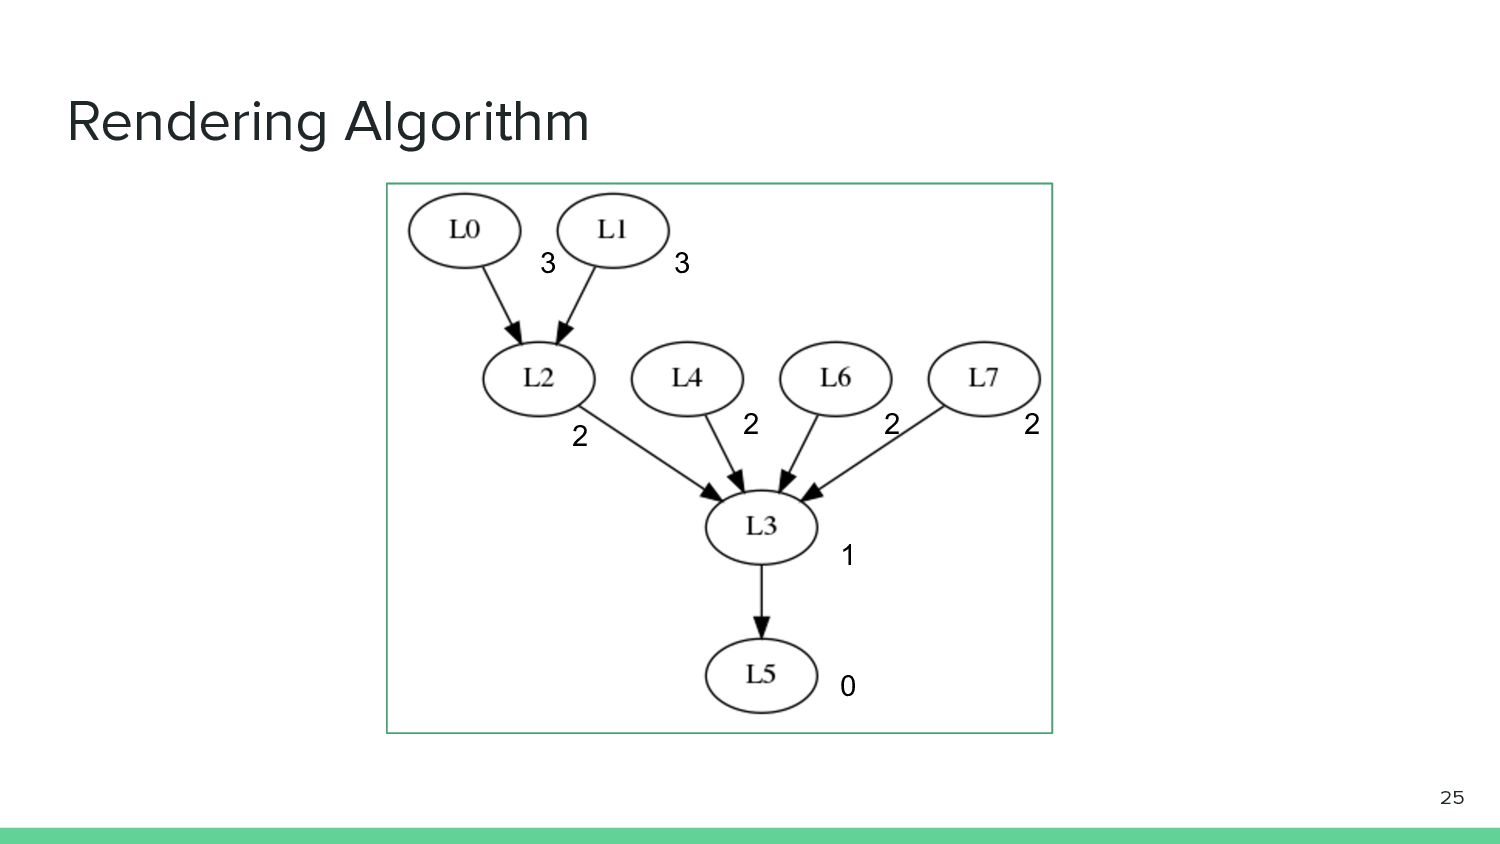
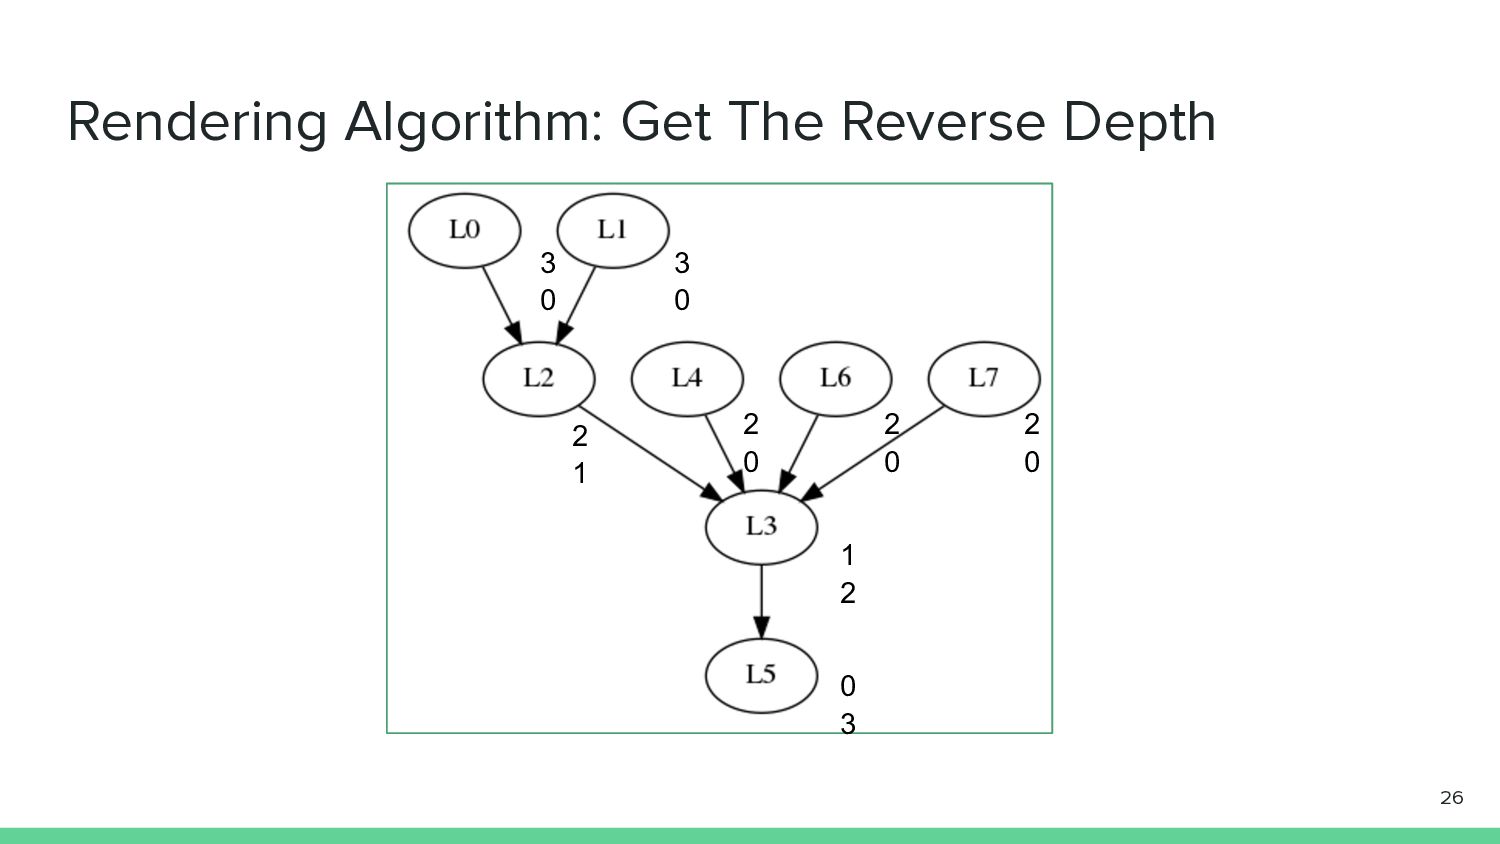
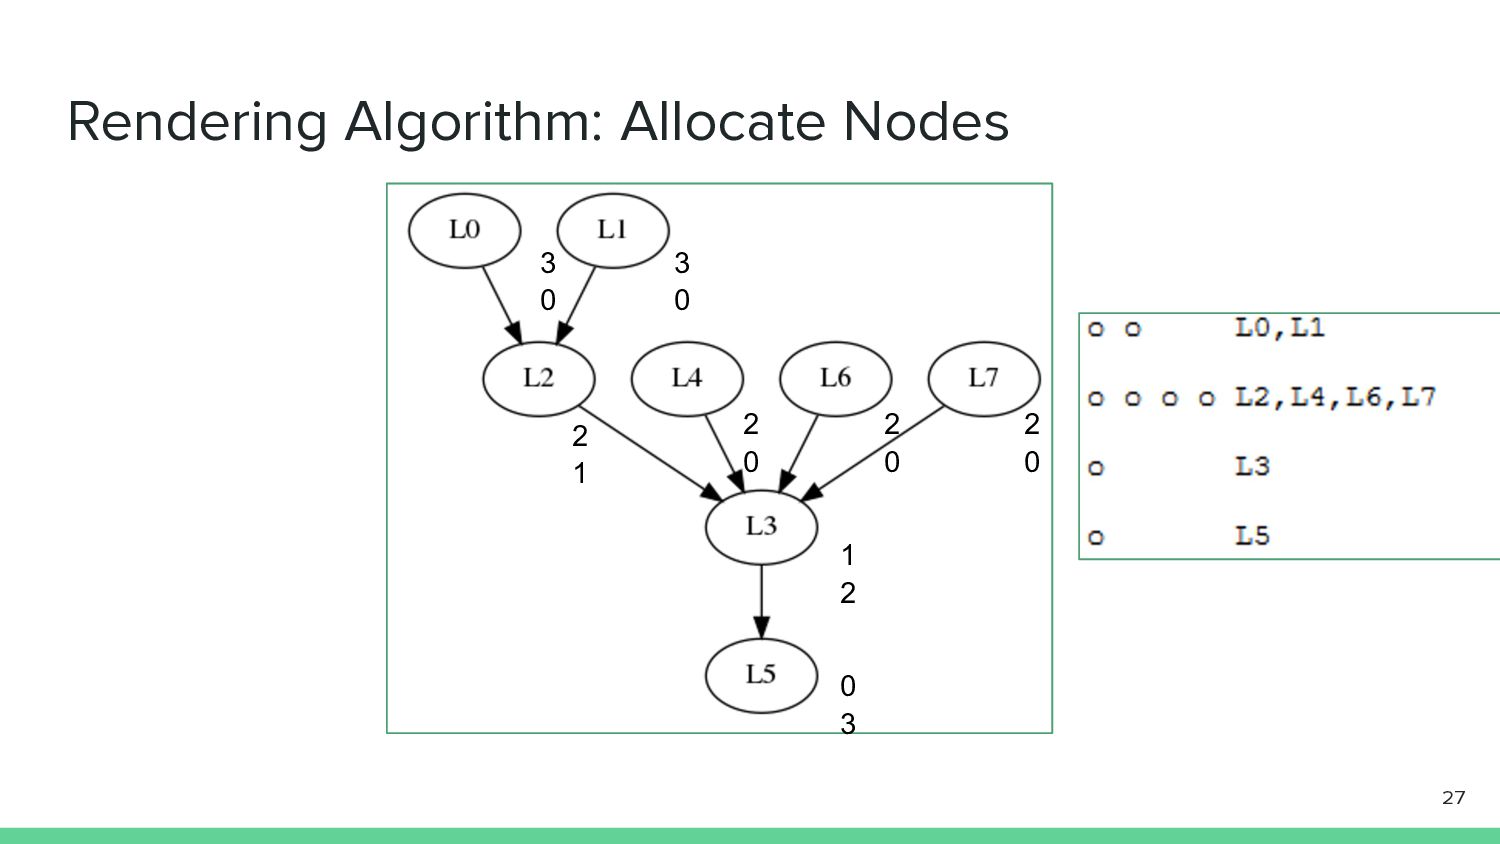
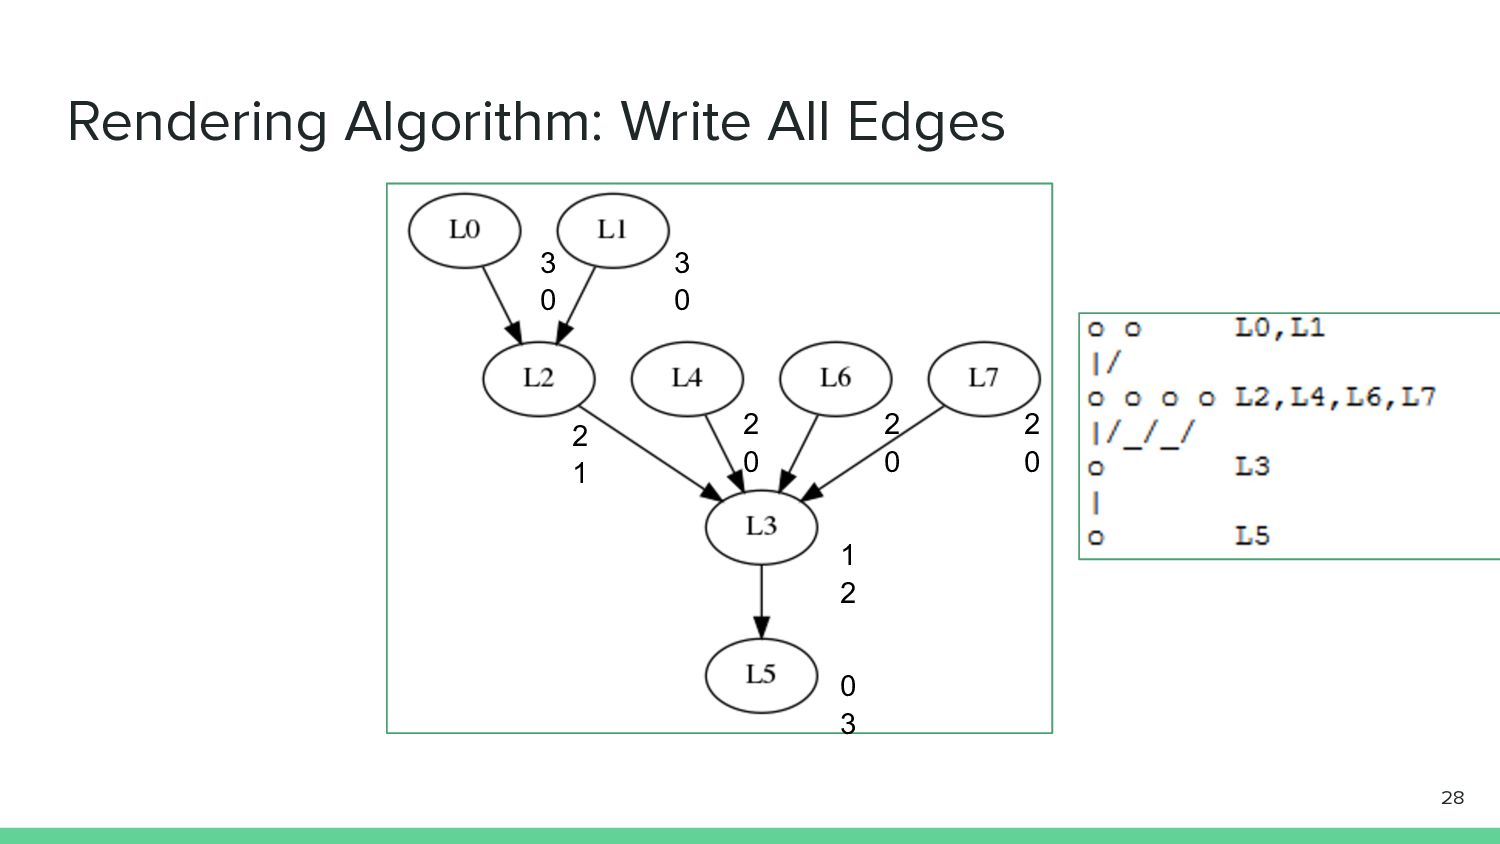
DAG and Get reversed depth of nodes. 3. Order nodes by the depth. 4. If the depth is the same, order nodes by the reversed depth. 5. If the reversed depth is the same, order nodes by the label of nodes 6. Connect nodes by using ascii text. 20
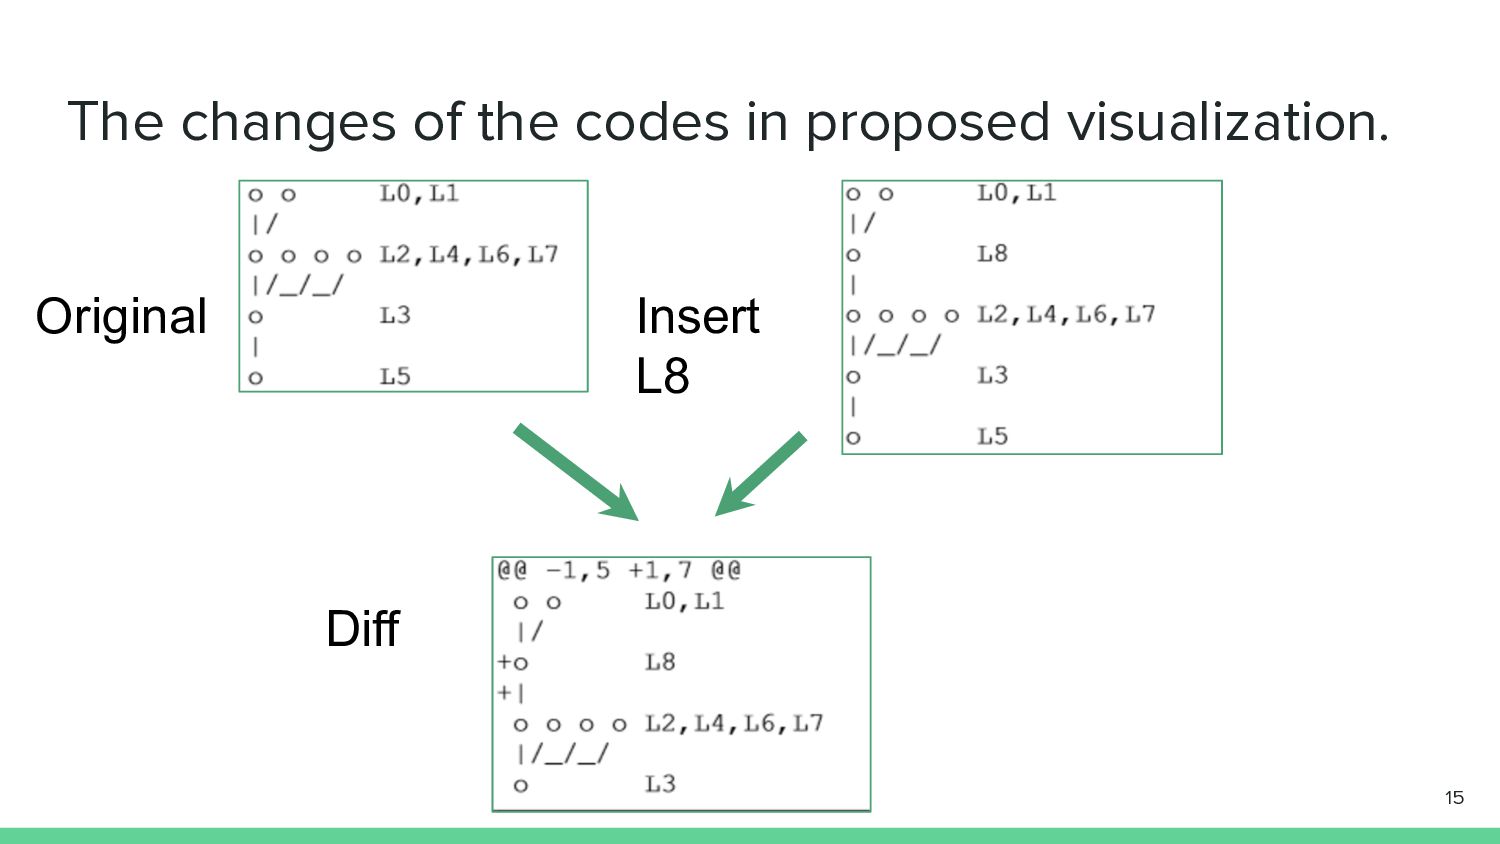
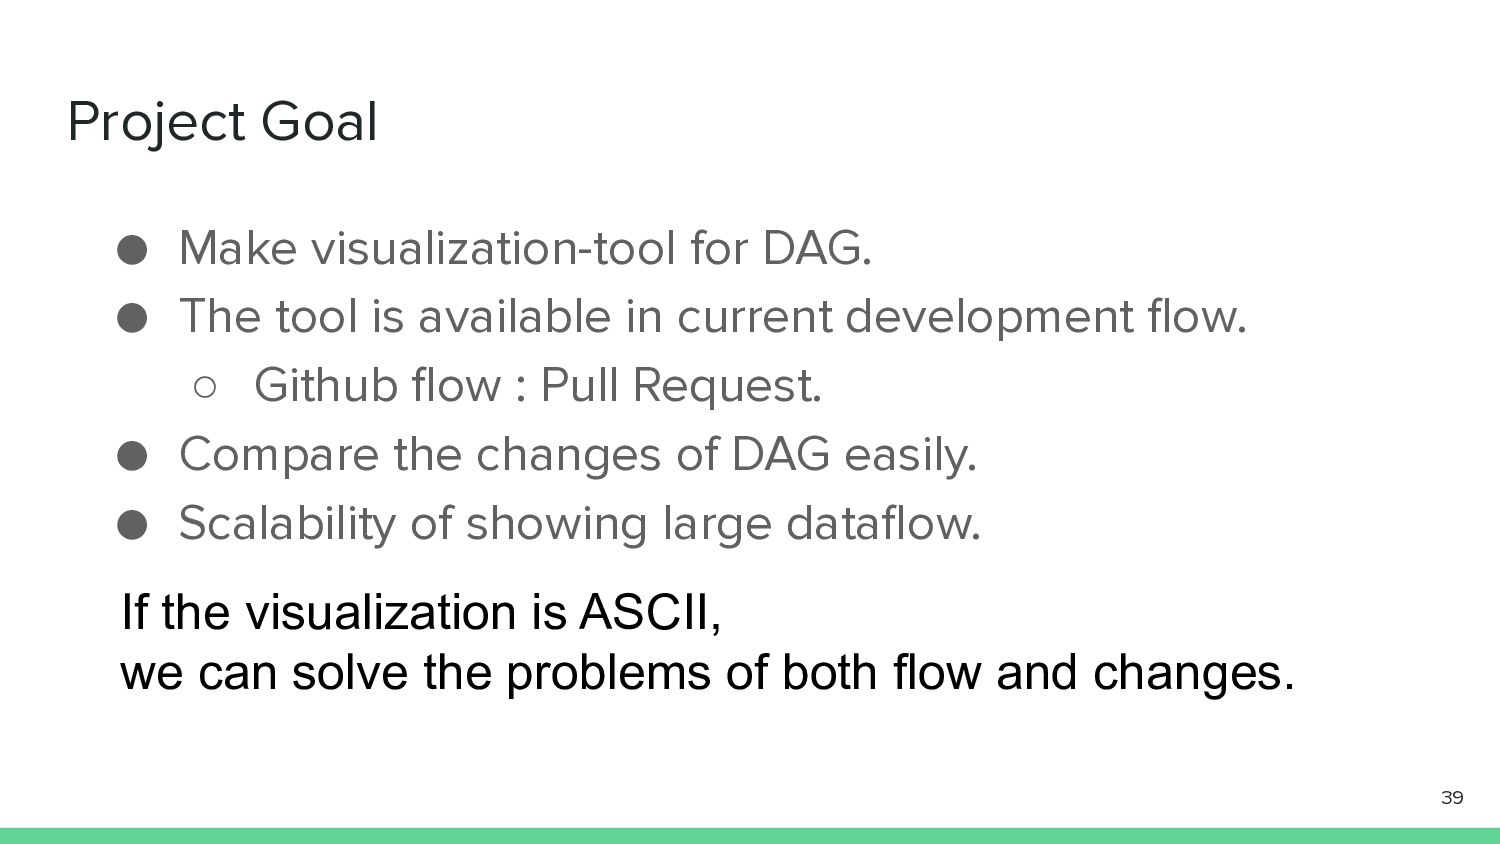
is available in current development flow. ◦ Github flow : Pull Request. • Compare the changes of DAG easily. • Scalability of showing large dataflow. 39 If the visualization is ASCII, we can solve the problems of both flow and changes.
a visualization tool on today’s development flow. ◦ We need a visualization tool for the dataflow. • How to visualize Dataflow(As Conventional Method) • Requirement of what we improve ◦ reviewable ◦ compact ◦ fast • Conventional Method 41
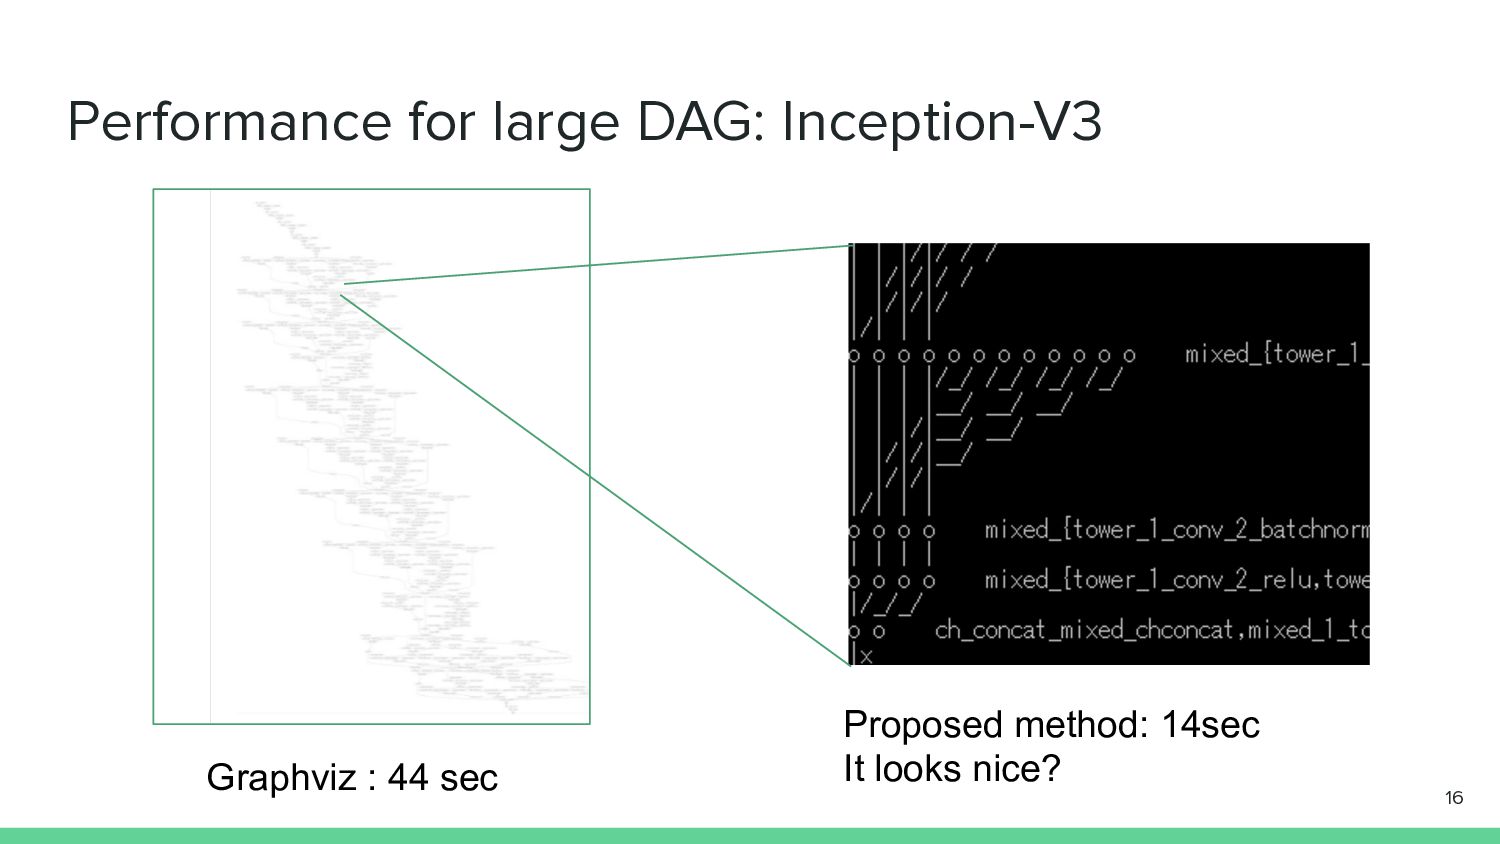
• Why we focus on a visualization of DAG? Why we use ASCII? • Compare with other visualization. • Left Aligned ASCII DAG • About rendering algorithm • Evaluation by using Google Inception V3 • Results and Future works 43
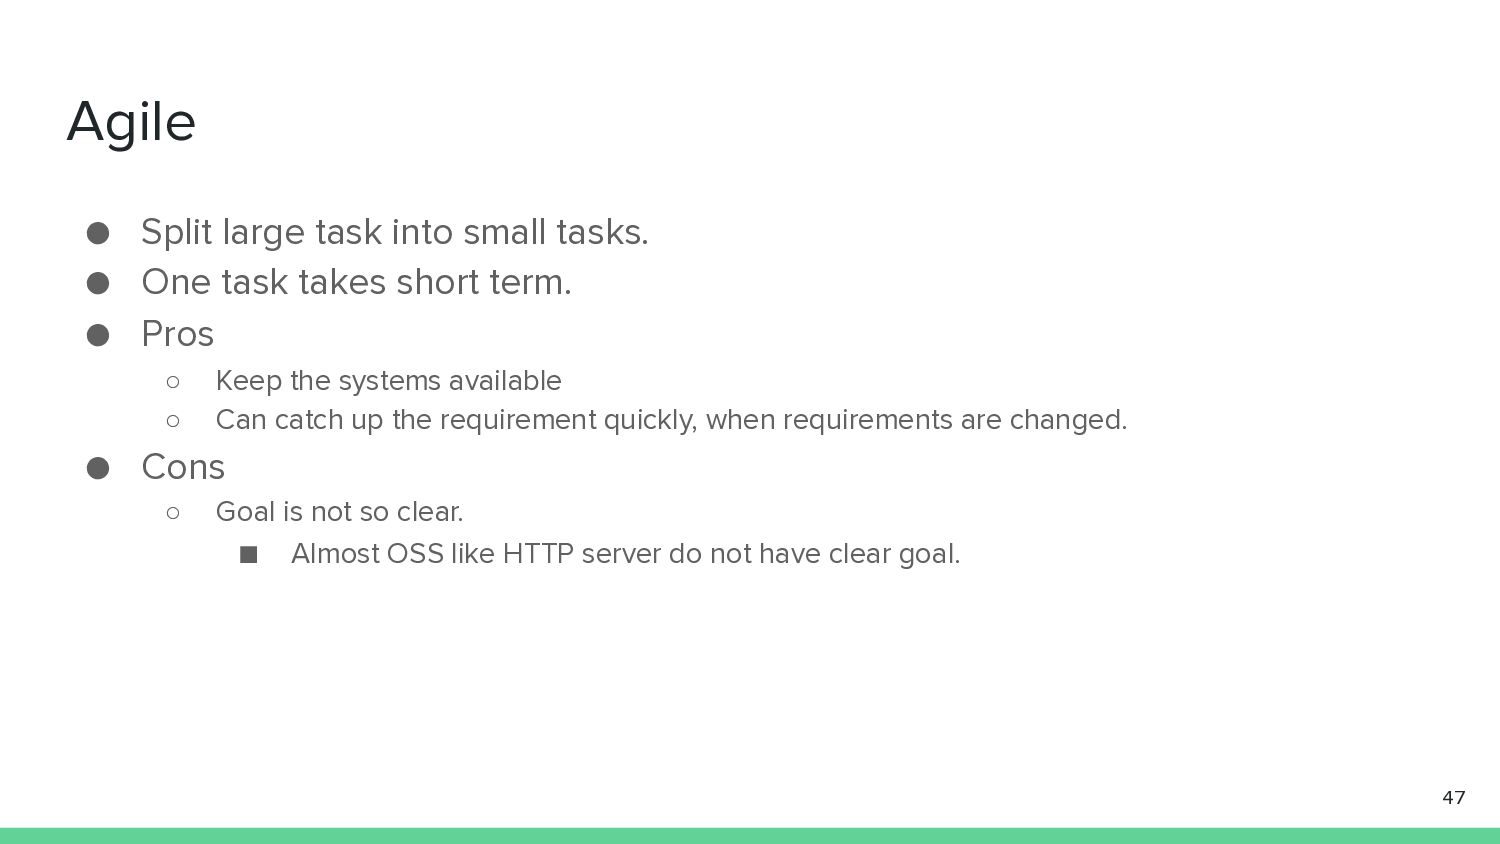
task takes short term. • Pros ◦ Keep the systems available ◦ Can catch up the requirement quickly, when requirements are changed. • Cons ◦ Goal is not so clear. ▪ Almost OSS like HTTP server do not have clear goal. 47
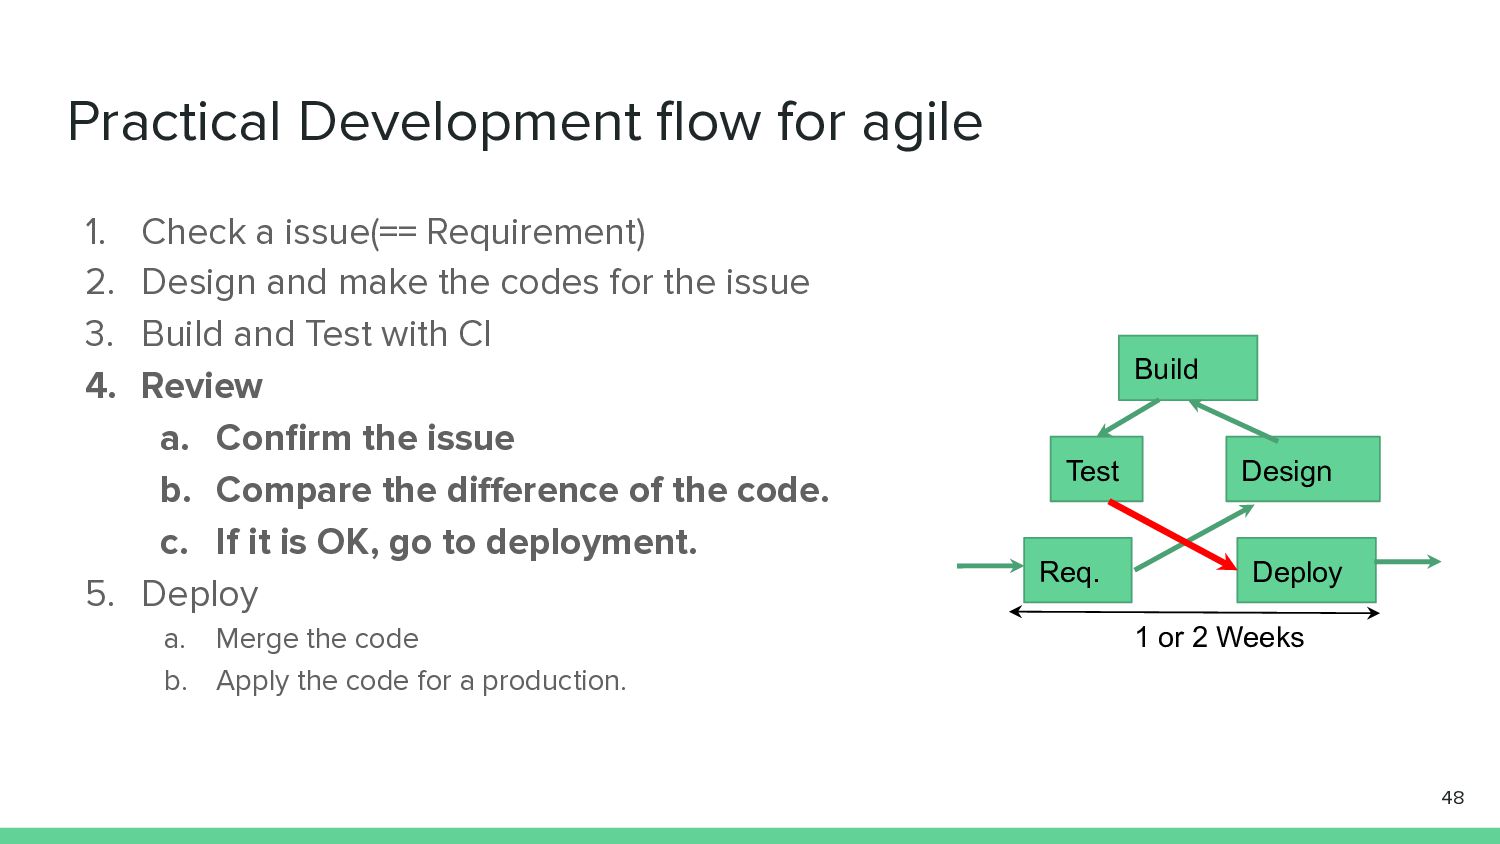
2. Design and make the codes for the issue 3. Build and Test with CI 4. Review a. Confirm the issue b. Compare the difference of the code. c. If it is OK, go to deployment. 5. Deploy a. Merge the code b. Apply the code for a production. 48 Req. Design Build Deploy Test 1 or 2 Weeks
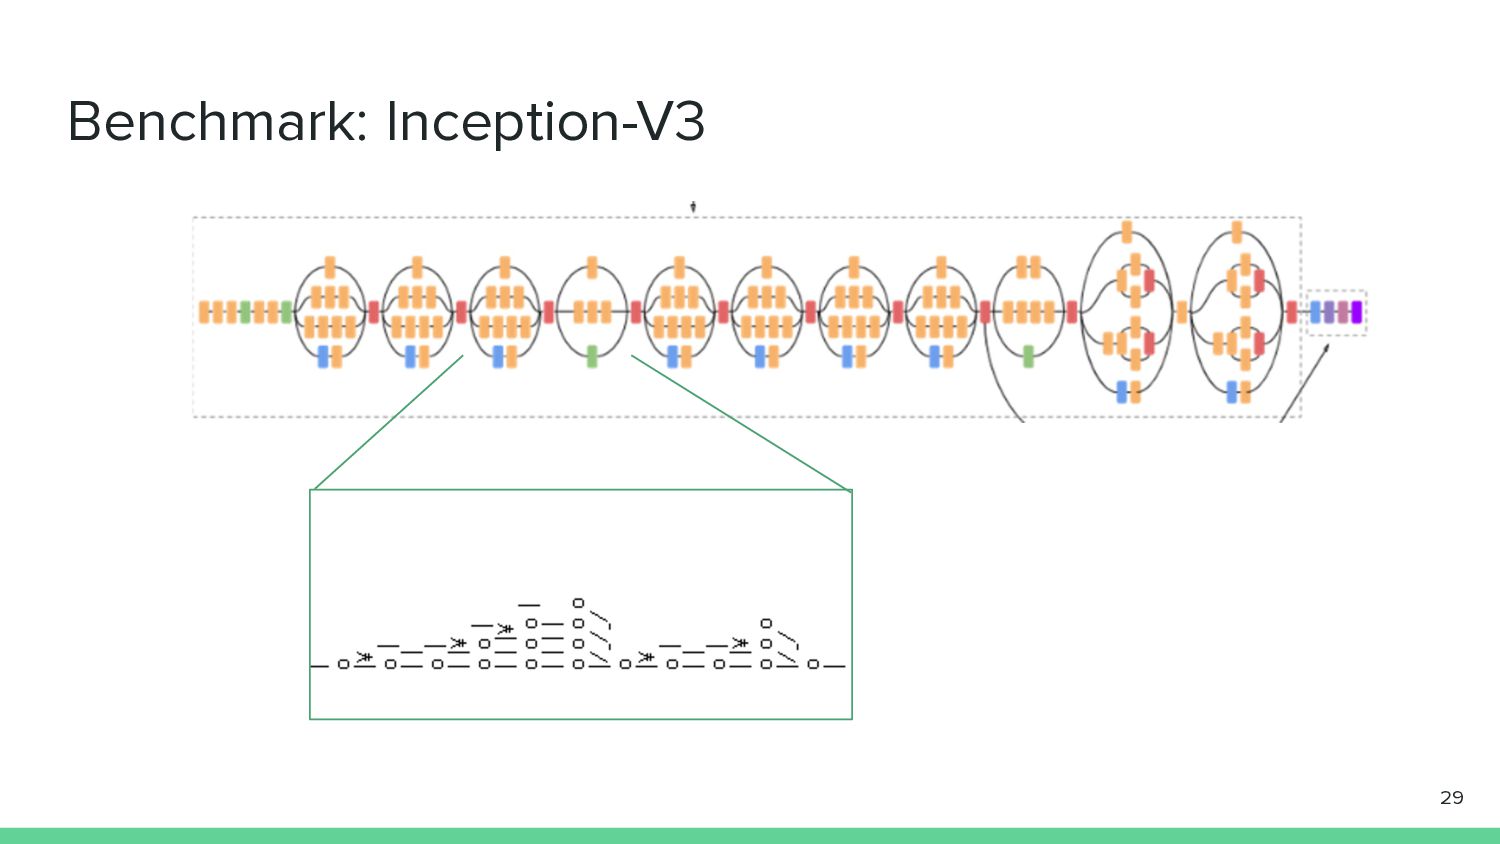
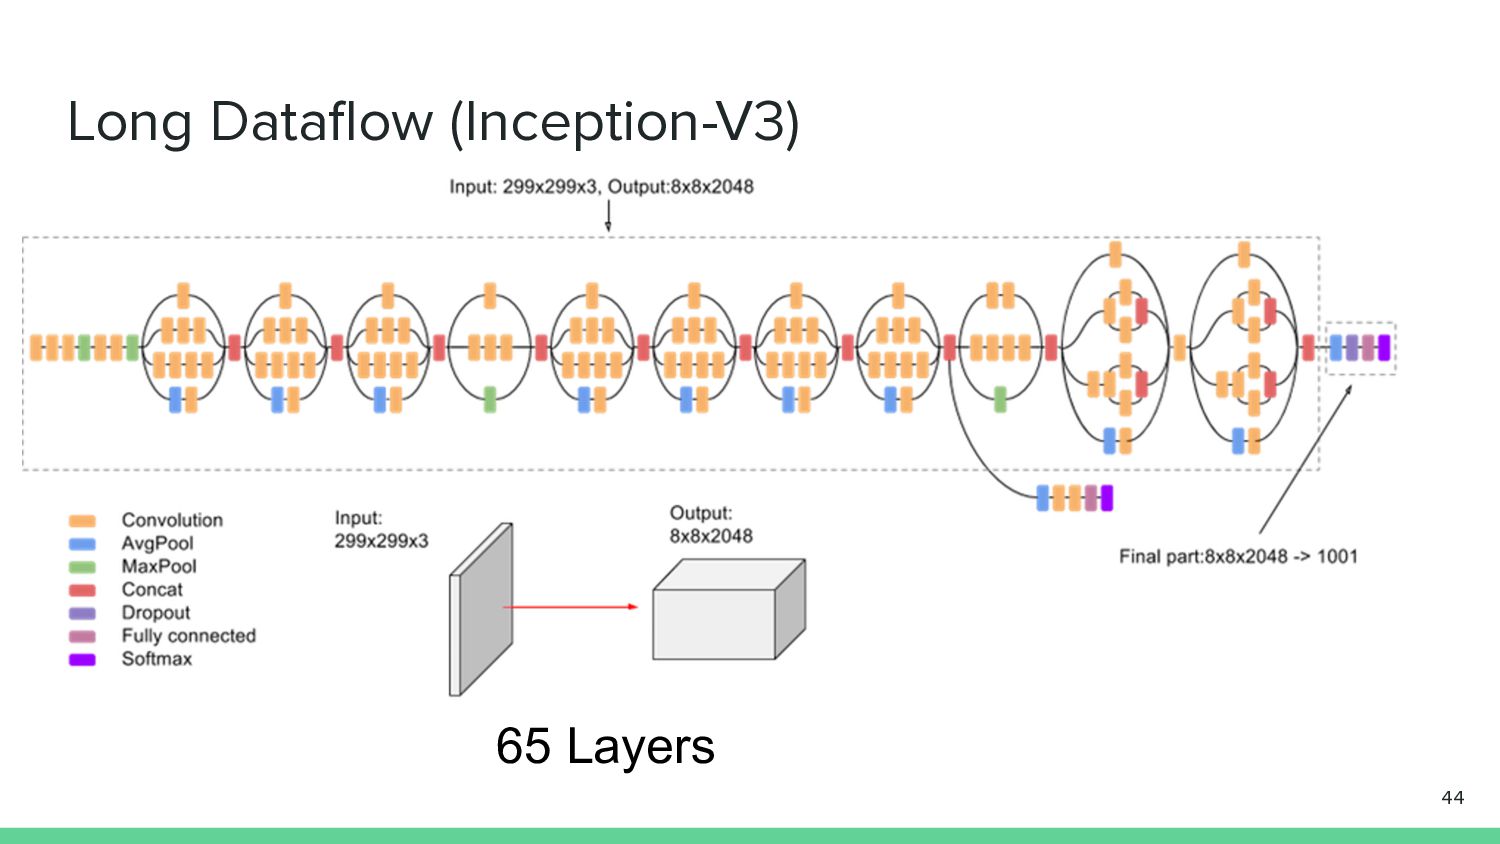
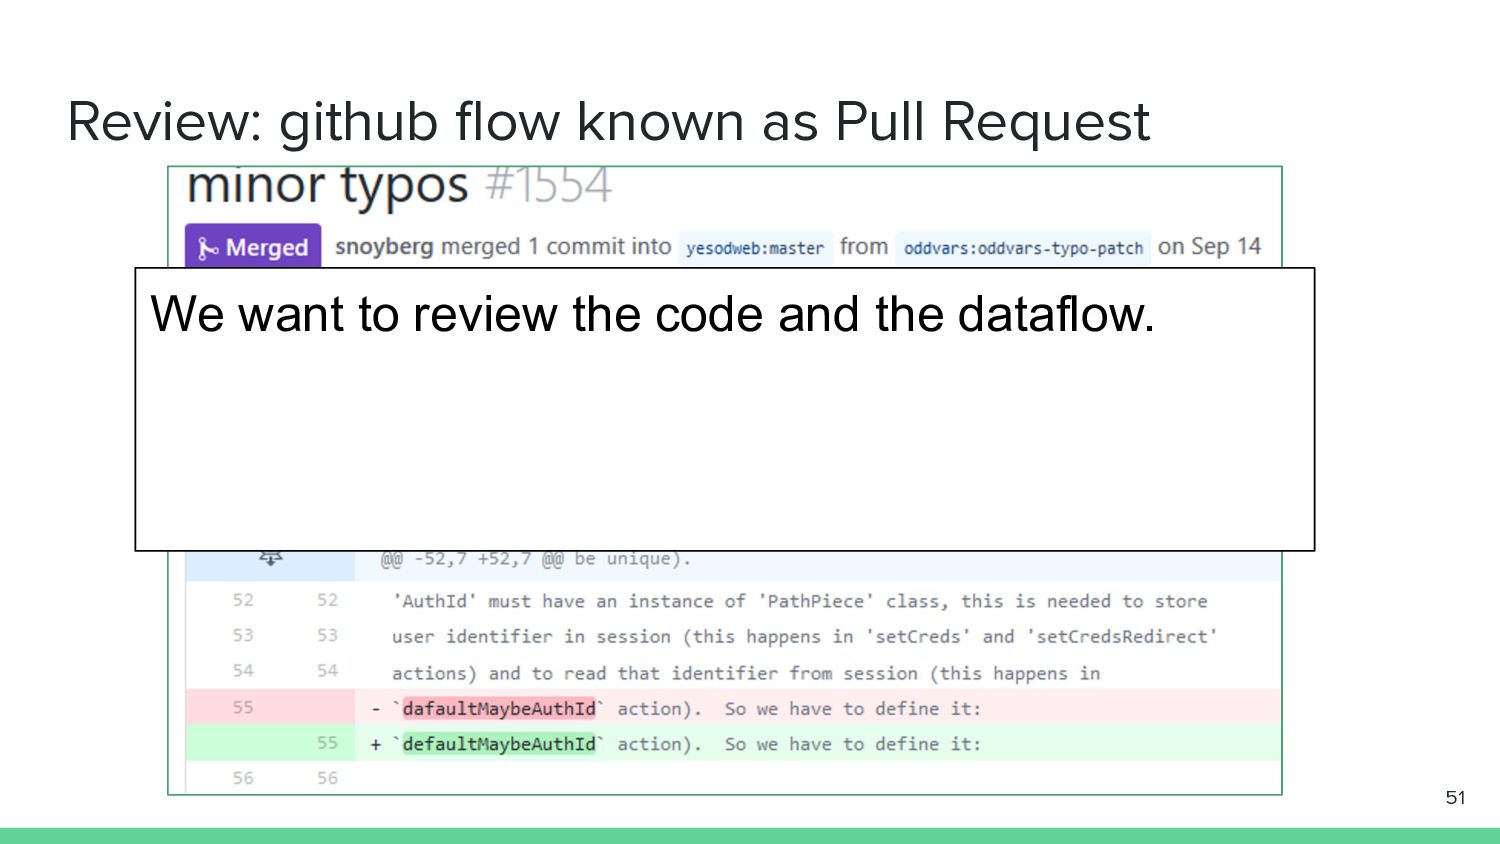
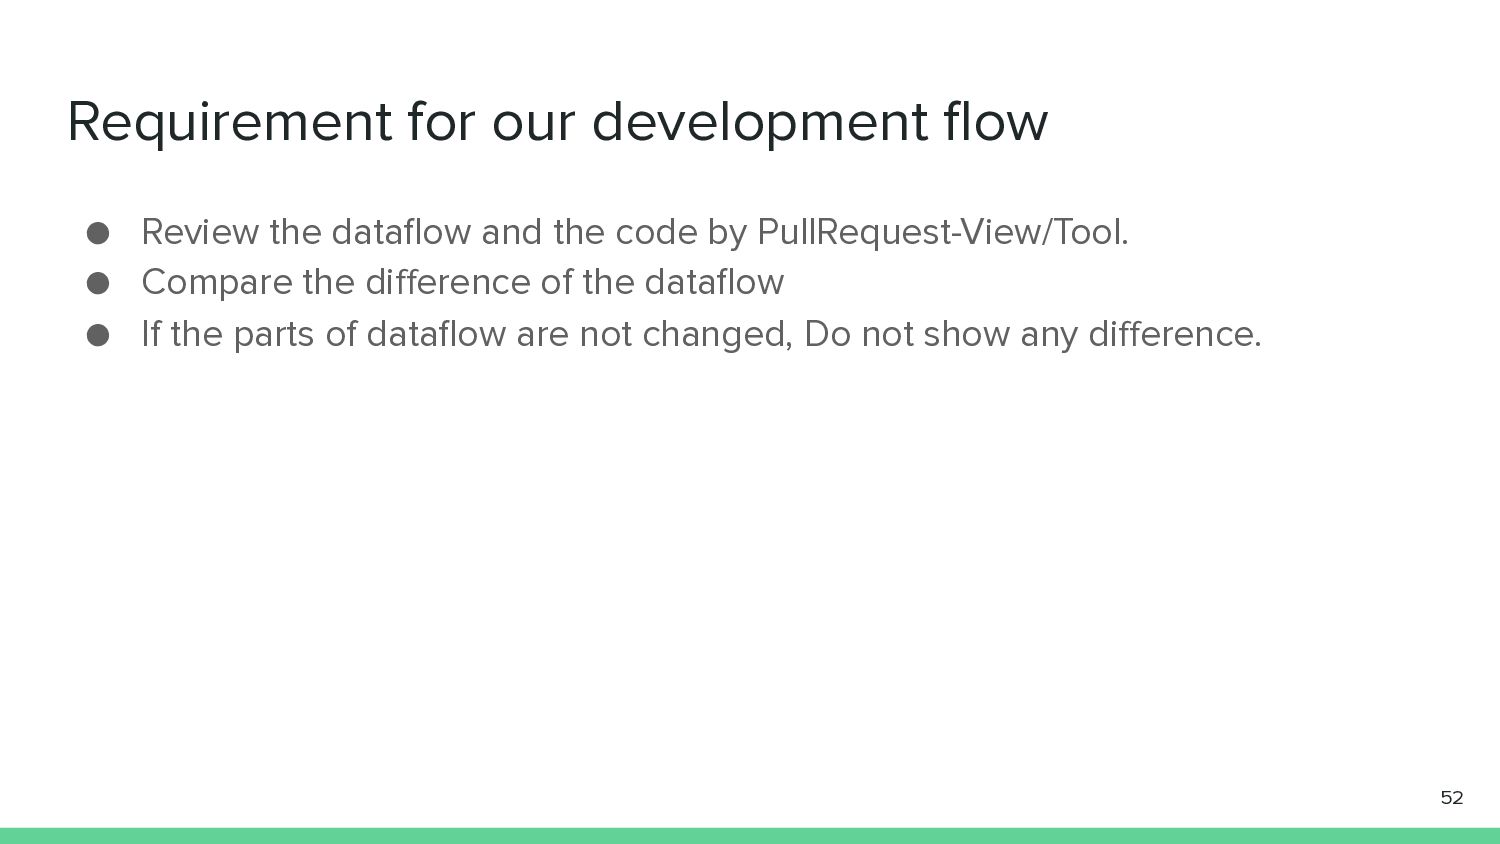
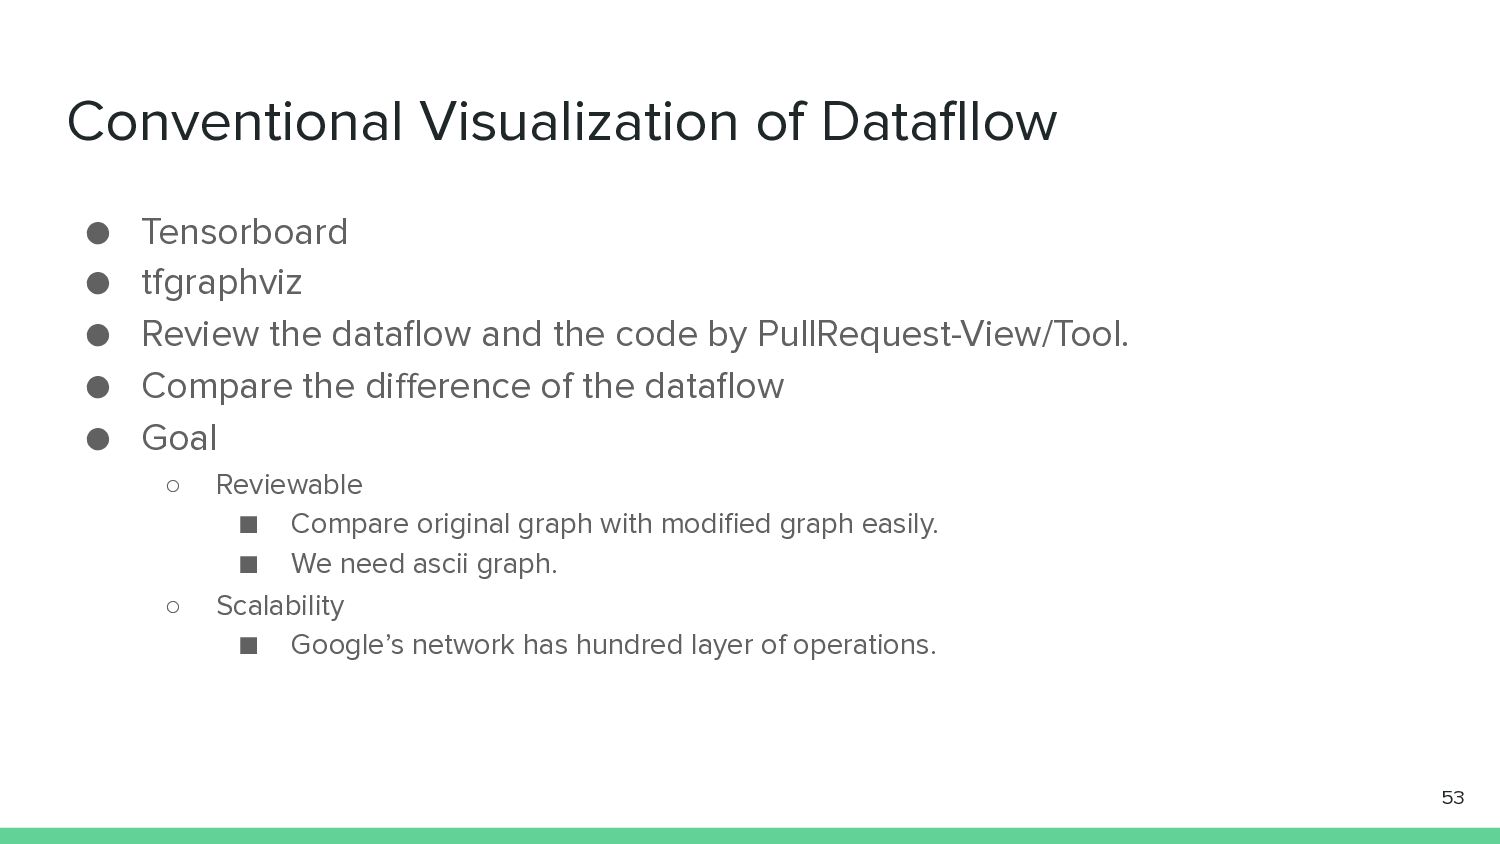
the dataflow and the code by PullRequest-View/Tool. • Compare the difference of the dataflow • Goal ◦ Reviewable ▪ Compare original graph with modified graph easily. ▪ We need ascii graph. ◦ Scalability ▪ Google’s network has hundred layer of operations. 53