Share
Embed
Monitoring Reactive Microservices
Slides from my JavaOne 2016 presentation about how to monitor reactive microservices.
h3nk3
September 22, 2016
Transcript
52 slides
-
• “TRADITIONAL” AND REACTIVE APPLICATIONS • MICROSERVICES • MONITORING (DIFFERENT
TYPES OF) APPLICATIONS • CHALLENGES IN MONITORING AND MITIGATIONS • PEEKING INTO FUTURE<THE> • FAST DATA AND PRODUCTION MONITORING • LIGHTBEND MONITORING AGENDA -
IT IS 2016 AND WE STILL USE • Synchronous local/remote
calls • Single machine apps - scaling is an afterthought • Non resilient approaches Result: brittle, non-scaling applications -
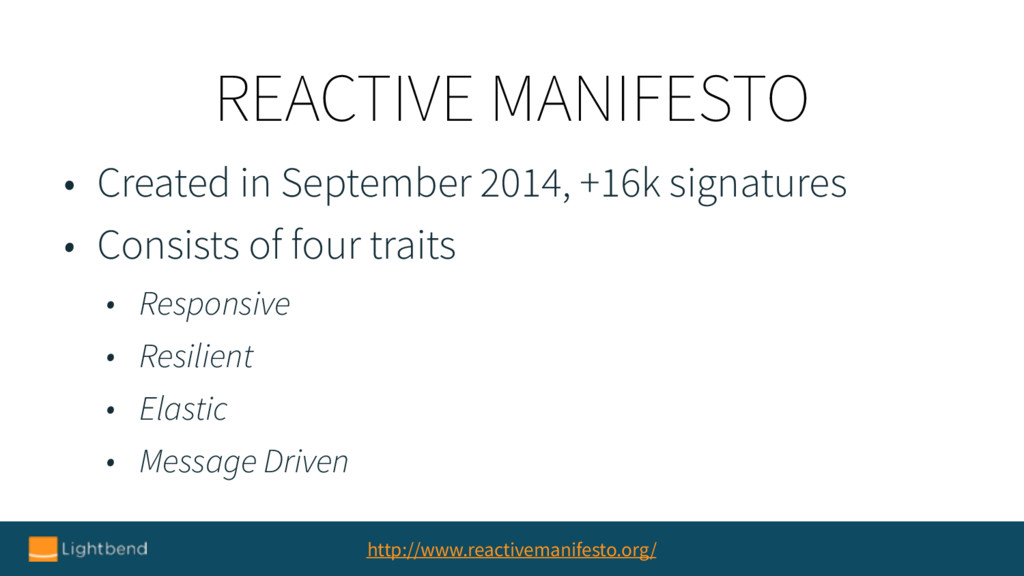
REACTIVE MANIFESTO http://www.reactivemanifesto.org/ • Created in September 2014, +16k signatures
• Consists of four traits • Responsive • Resilient • Elastic • Message Driven -
RESPONSIVE A responsive application is quick to react to all
users • under blue and grey skies • regardless of load of system, time of day, day of year • ensures a consistently positive user experience -
RESILIENT Things can and will go wrong! • A resilient
application applies proper design and architecture principles • Resiliency tends to be the weakest links in applications • Your application should be resilient on all levels -
ELASTIC Your app should be able to scale UP and
OUT • UP: Utilize all hardware on the machine • OUT: Spread over multiple nodes Elasticity and resiliency of hand in hand when creating consistently responsive applications. -
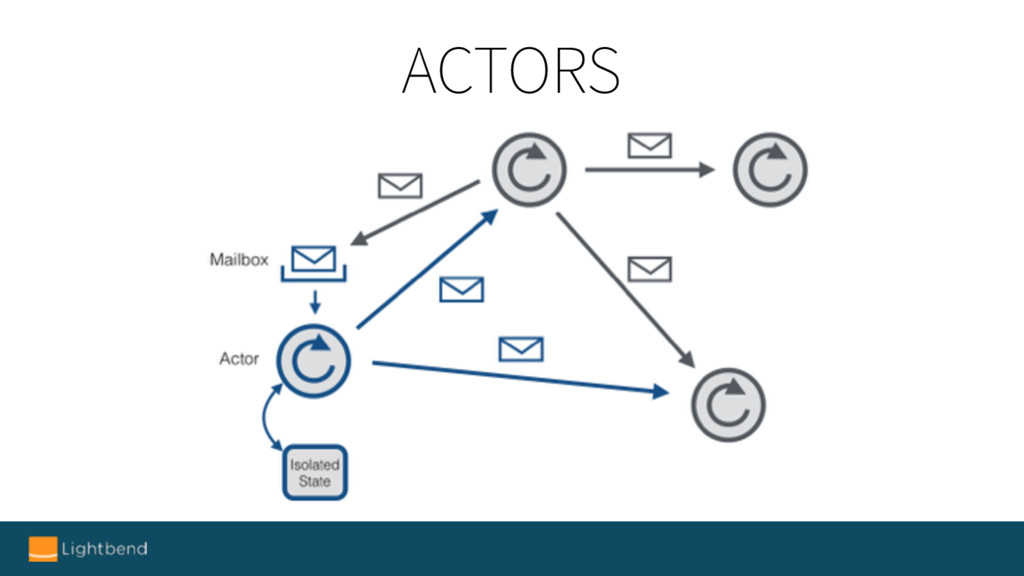
MESSAGE DRIVEN • A message-driven architecture is the foundation of
a reactive application. • Using this approach, correctly, will enable your application to be both asynchronous and distributed. -
RECIPES FOR MICROSERVICES • Isolate everything • Act autonomously •
Do one thing and do it well • Own your state • Embrace asynchronous message passing -
SYNCHRONOUS APPS • Metrics based on entry/exit points • Context
packed stack traces are available • Logs are (more) descriptive • Thread locals can be used to transfer contexts -
ASYNCH STACK TRACE [info] at cinnamon.sample.failure.B$$anonfun$receive$2.applyOrElse(FailureDemo.scala:102) [info] at akka.actor.Actor$class.aroundReceive(Actor.scala:467) [info]
at cinnamon.sample.failure.B.aroundReceive(FailureDemo.scala:86) [info] at akka.actor.ActorCell.receiveMessage(ActorCell.scala:516) [info] at akka.actor.ActorCell.invoke(ActorCell.scala) [info] at akka.dispatch.Mailbox.processMailbox(Mailbox.scala:238) [info] at akka.dispatch.Mailbox.run$$original(Mailbox.scala:220) [info] at akka.dispatch.Mailbox.run(Mailbox.scala:29) [info] at akka.dispatch.ForkJoinExecutorConfigurator$AkkaForkJoinTask.exec(AbstractDispatcher.scala:397) [info] at scala.concurrent.forkjoin.ForkJoinTask.doExec(ForkJoinTask.java:260) [info] at scala.concurrent.forkjoin.ForkJoinPool$WorkQueue.runTask(ForkJoinPool.java:1339) [info] at scala.concurrent.forkjoin.ForkJoinPool.runWorker(ForkJoinPool.java:1979) [info] at scala.concurrent.forkjoin.ForkJoinWorkerThread.run(ForkJoinWorkerThread.java:107) -
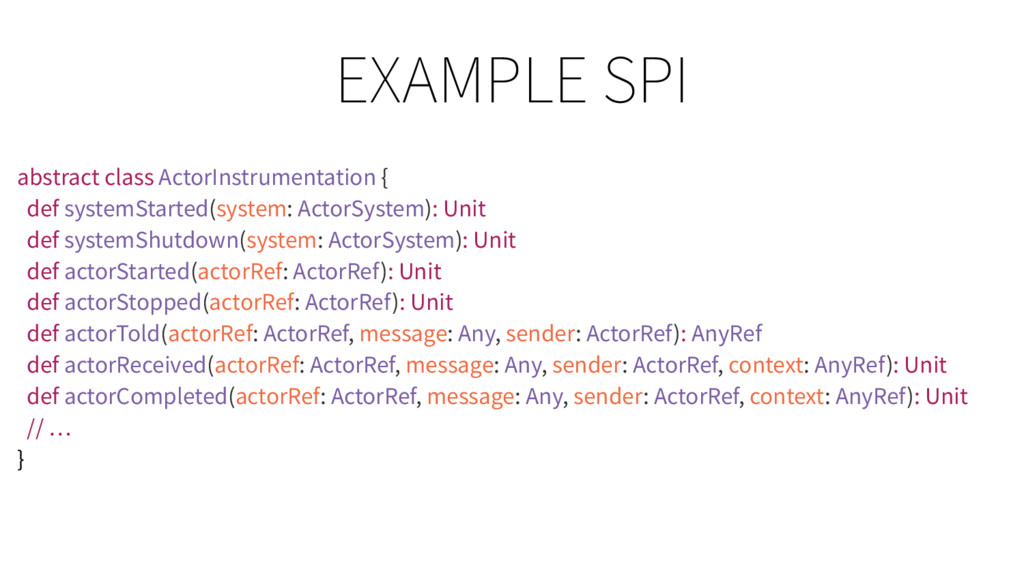
EXAMPLE SPI abstract class ActorInstrumentation { def systemStarted(system: ActorSystem): Unit
def systemShutdown(system: ActorSystem): Unit def actorStarted(actorRef: ActorRef): Unit def actorStopped(actorRef: ActorRef): Unit def actorTold(actorRef: ActorRef, message: Any, sender: ActorRef): AnyRef def actorReceived(actorRef: ActorRef, message: Any, sender: ActorRef, context: AnyRef): Unit def actorCompleted(actorRef: ActorRef, message: Any, sender: ActorRef, context: AnyRef): Unit // … } -
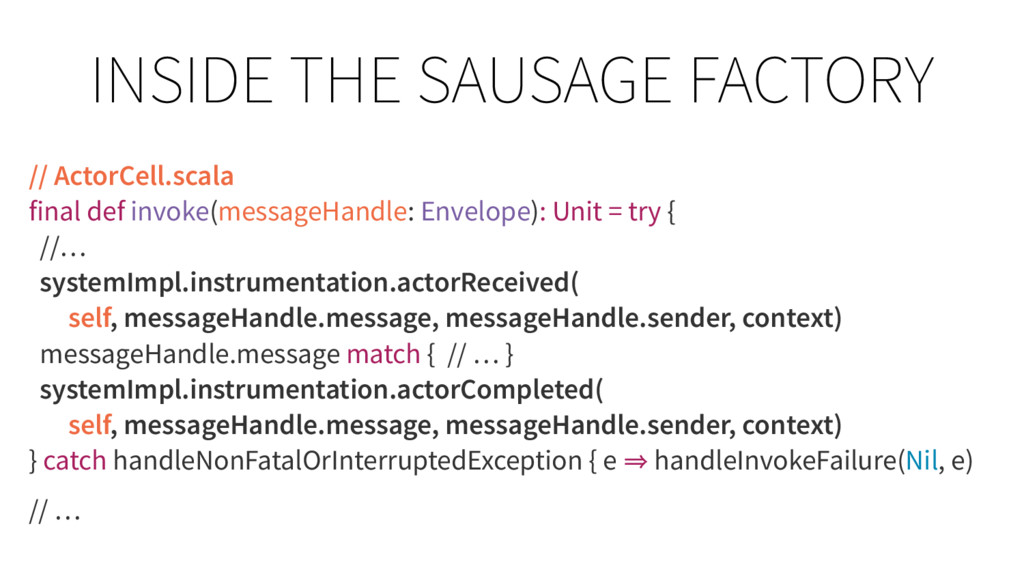
INSIDE THE SAUSAGE FACTORY // ActorCell.scala final def invoke(messageHandle: Envelope):
Unit = try { //… systemImpl.instrumentation.actorReceived( self, messageHandle.message, messageHandle.sender, context) messageHandle.message match { // … } systemImpl.instrumentation.actorCompleted( self, messageHandle.message, messageHandle.sender, context) } catch handleNonFatalOrInterruptedException { e 㱺 handleInvokeFailure(Nil, e) // … -
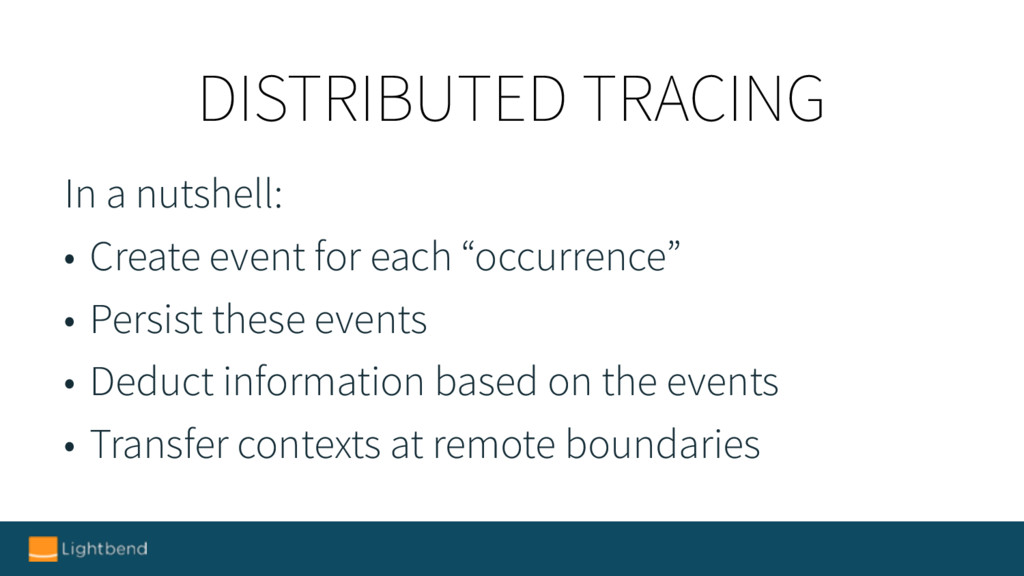
DISTRIBUTED TRACING In a nutshell: • Create event for each
“occurrence” • Persist these events • Deduct information based on the events • Transfer contexts at remote boundaries -
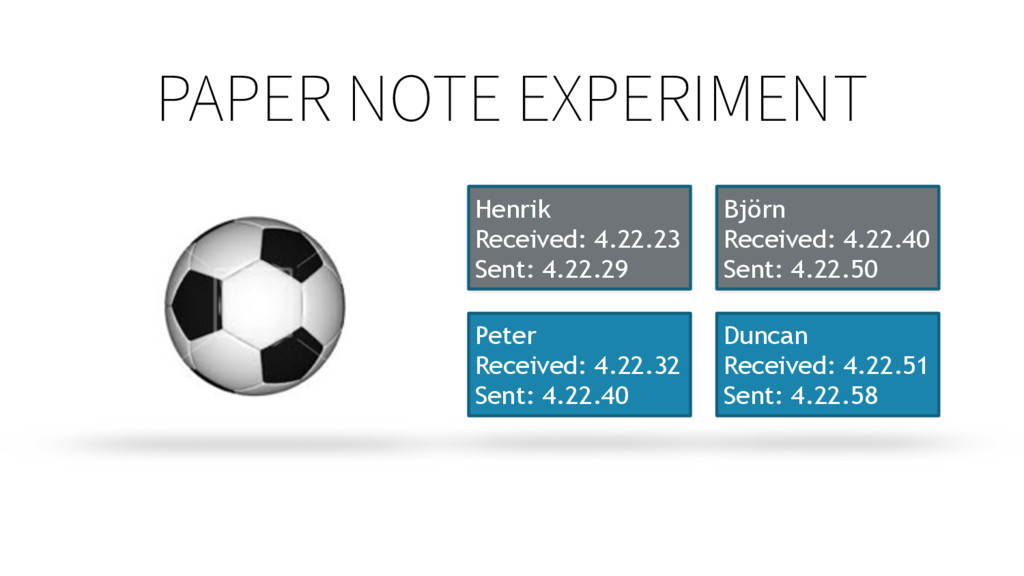
PAPER NOTE EXPERIMENT Henrik Received: 4.22.23 Sent: 4.22.29 Peter Received:
4.22.32 Sent: 4.22.40 Björn Received: 4.22.40 Sent: 4.22.50 Duncan Received: 4.22.51 Sent: 4.22.58 -
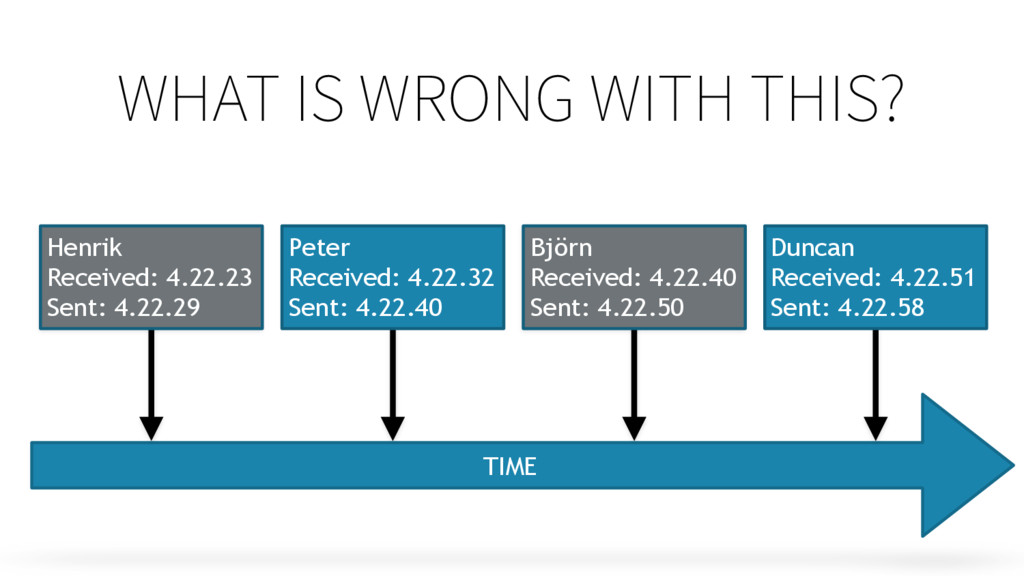
WHAT IS WRONG WITH THIS? TIME Henrik Received: 4.22.23 Sent:
4.22.29 Peter Received: 4.22.32 Sent: 4.22.40 Björn Received: 4.22.40 Sent: 4.22.50 Duncan Received: 4.22.51 Sent: 4.22.58 -
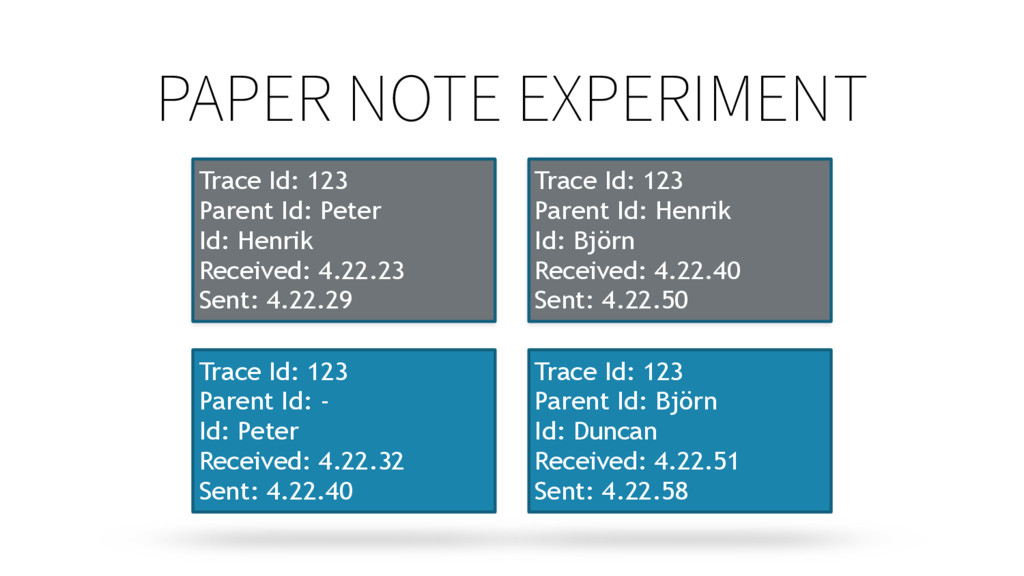
PAPER NOTE EXPERIMENT Trace Id: 123 Parent Id: - Id:
Peter Received: 4.22.32 Sent: 4.22.40 Trace Id: 123 Parent Id: Peter Id: Henrik Received: 4.22.23 Sent: 4.22.29 Trace Id: 123 Parent Id: Henrik Id: Björn Received: 4.22.40 Sent: 4.22.50 Trace Id: 123 Parent Id: Björn Id: Duncan Received: 4.22.51 Sent: 4.22.58 -
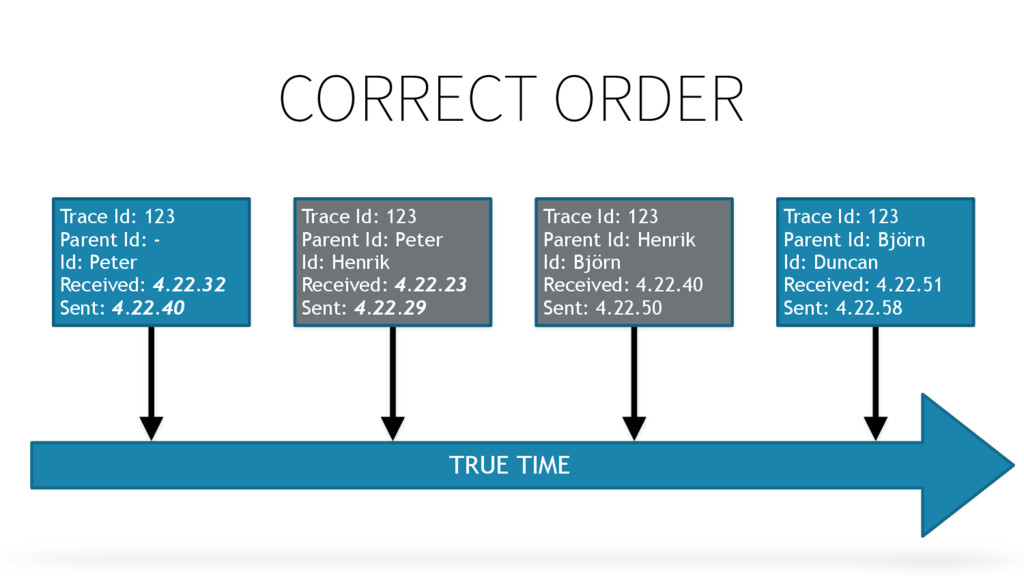
CORRECT ORDER TRUE TIME Trace Id: 123 Parent Id: -
Id: Peter Received: 4.22.32 Sent: 4.22.40 Trace Id: 123 Parent Id: Peter Id: Henrik Received: 4.22.23 Sent: 4.22.29 Trace Id: 123 Parent Id: Henrik Id: Björn Received: 4.22.40 Sent: 4.22.50 Trace Id: 123 Parent Id: Björn Id: Duncan Received: 4.22.51 Sent: 4.22.58 -
VISIBILITY How do we get full visibility then? Log everything?
• No, it could/would be too costly. • We have to come up with clever ways of doing good enough - see challenges and mitigations in the following slides for inspiration. -
HANDLING SCALE If we create event for everything it will
be like drinking from a firehose! Mitigation: • Dynamic configuration • Sampling (adaptive), rate limiting • Gather information closer to the source • Use delta approach -
EPHEMERALITY Things come and go in an asynchronous, distributed system.
Mitigation: • Create metrics of “patterns” instead of individual instances • Group information together based on classes or grouped classes to get to a higher level -
STAYING COST EFFECTIVE Monitoring introduces cost in terms of time
(performance overhead) and money (running and storing data). Mitigation: • Only monitor “valid” parts of your application, or at least use class or group level monitoring for short lived, ephemeral things • Use dynamic configuration that can be used to zoom in when anomalies are detected -
CORRELATION When monitoring your system you have to use data
from multiple sources in order to make sense of the data. Mitigation: • Combine sources together to understand what is going on • E.g. low level metrics combined with JVM info, OS info, Orchestration Tool info, Data Center info, etc. -
VARIETY Just like snowflakes, no two monitored application are the
same. This makes it hard to create a generic monitoring system that can handle all sorts of applications. Mitigation: • Use configurable monitoring to instruct how you want to monitor to be performed • ML in combination with runtime config is very interesting! -
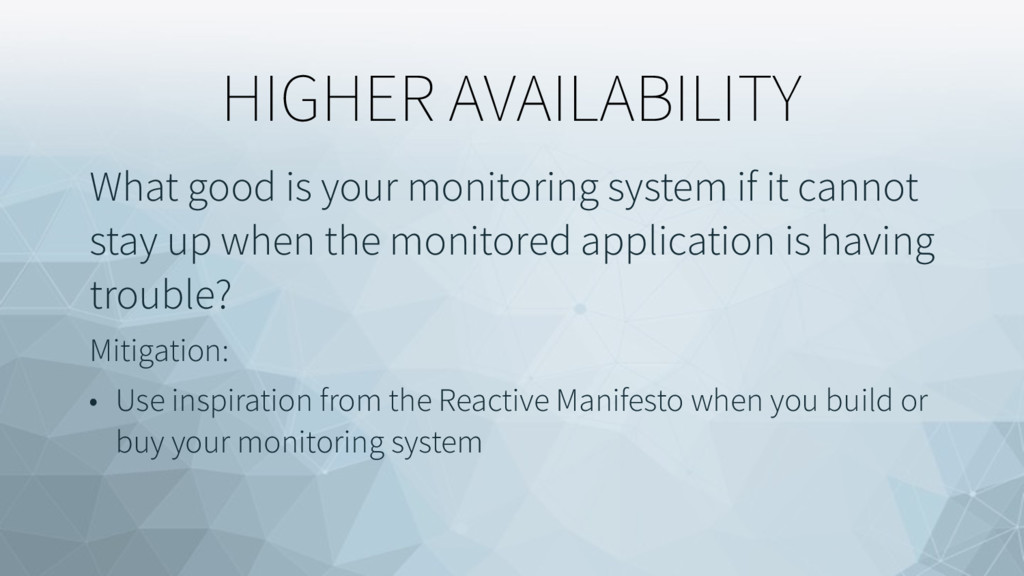
HIGHER AVAILABILITY What good is your monitoring system if it
cannot stay up when the monitored application is having trouble? Mitigation: • Use inspiration from the Reactive Manifesto when you build or buy your monitoring system -
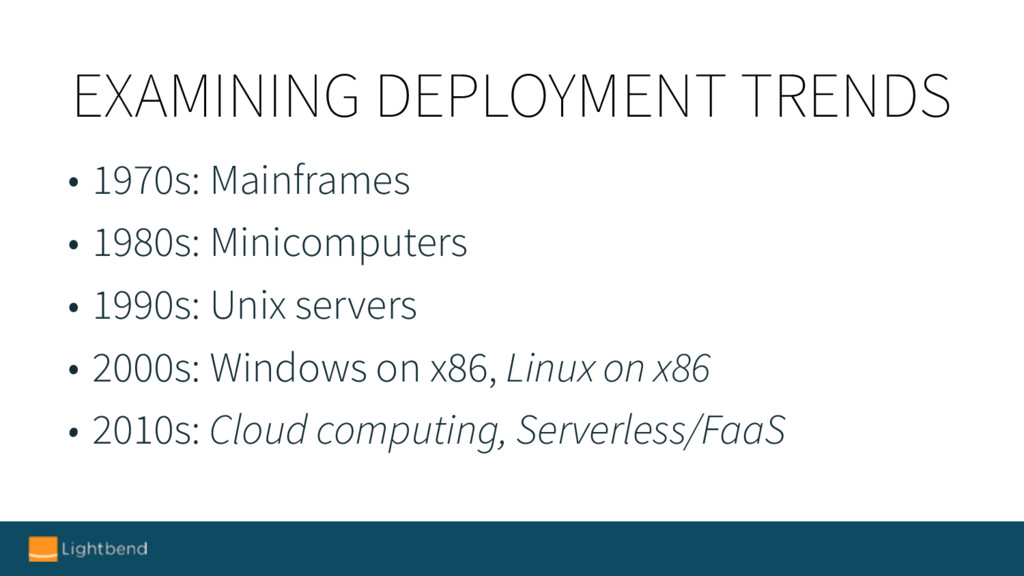
EXAMINING DEPLOYMENT TRENDS • 1970s: Mainframes • 1980s: Minicomputers •
1990s: Unix servers • 2000s: Windows on x86, Linux on x86 • 2010s: Cloud computing, Serverless/FaaS -
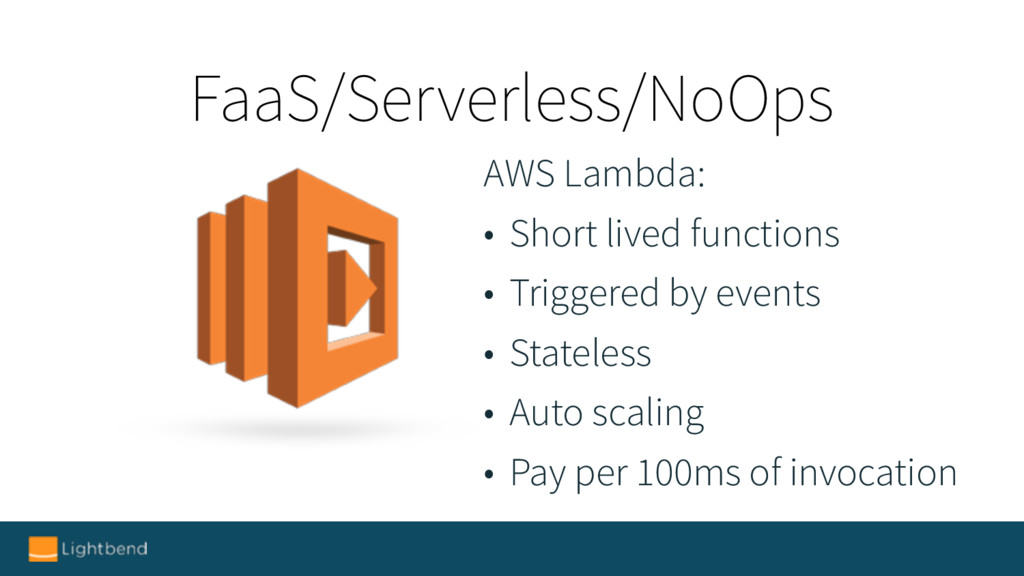
FaaS/Serverless/NoOps AWS Lambda: • Short lived functions • Triggered by
events • Stateless • Auto scaling • Pay per 100ms of invocation -
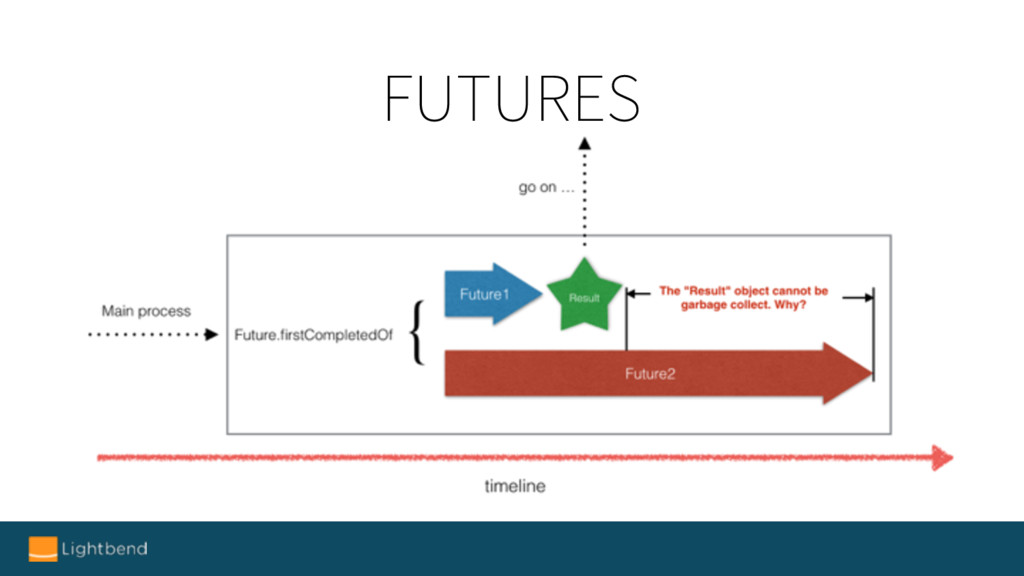
SO, IT’S NOT REALLY NEW! Actors are location transparent Futures
are anonymous blocks of code executed some time Serverless/FaaS just highlights a monitoring need that already exists! -
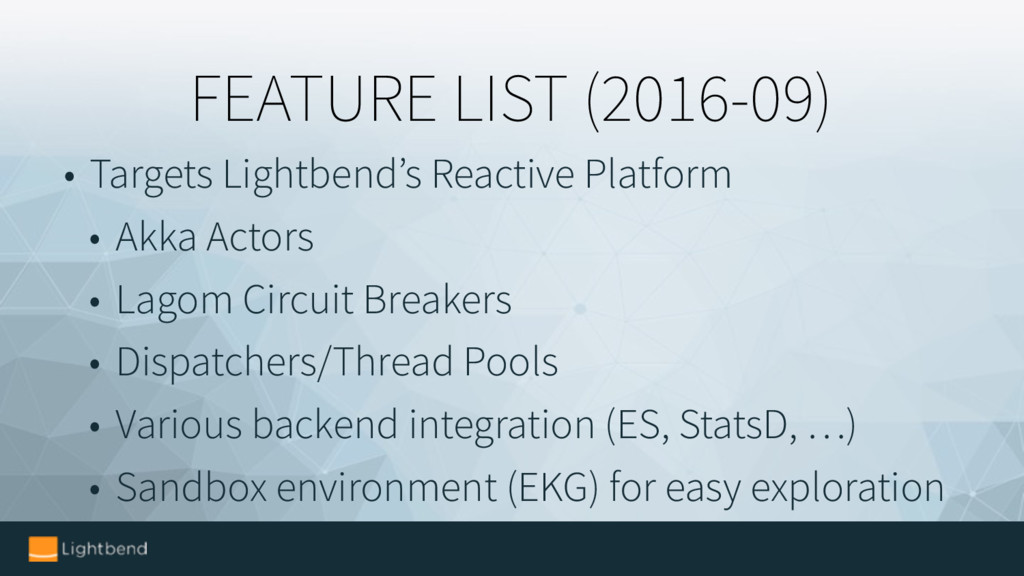
FEATURE LIST (2016-09) • Targets Lightbend’s Reactive Platform • Akka
Actors • Lagom Circuit Breakers • Dispatchers/Thread Pools • Various backend integration (ES, StatsD, …) • Sandbox environment (EKG) for easy exploration -
UPCOMING FEATURES • Akka Cluster Information (statistics, events, SBR) •
Futures (Java8/Scala) • Akka Streams • Akka HTTP and Play • Expanded Lagom monitoring • Expanded distributed tracing -
HOW TO GET IT • Free to use during development
• Requires subscription to use in production Create, free, account to get started: https://www.lightbend.com/account/register Demo: https://demo.lightbend.com