Upgrade to Pro — share decks privately, control downloads, hide ads and more …

Machine Learning to Predict Mortality and Critical Events : Model Development and Validation

harunashi
February 26, 2021

Machine Learning to Predict Mortality and Critical Events : Model Development and Validation

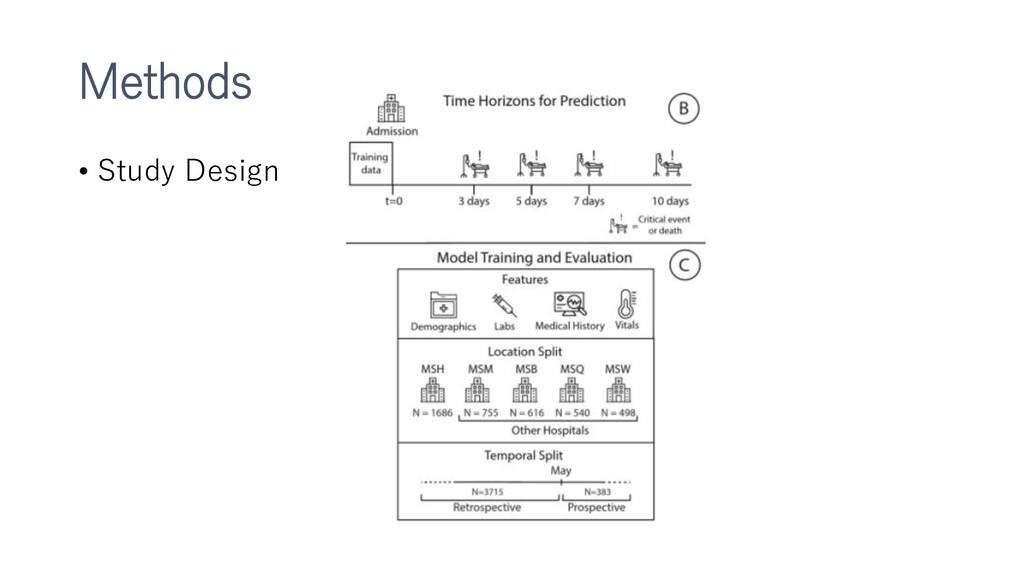
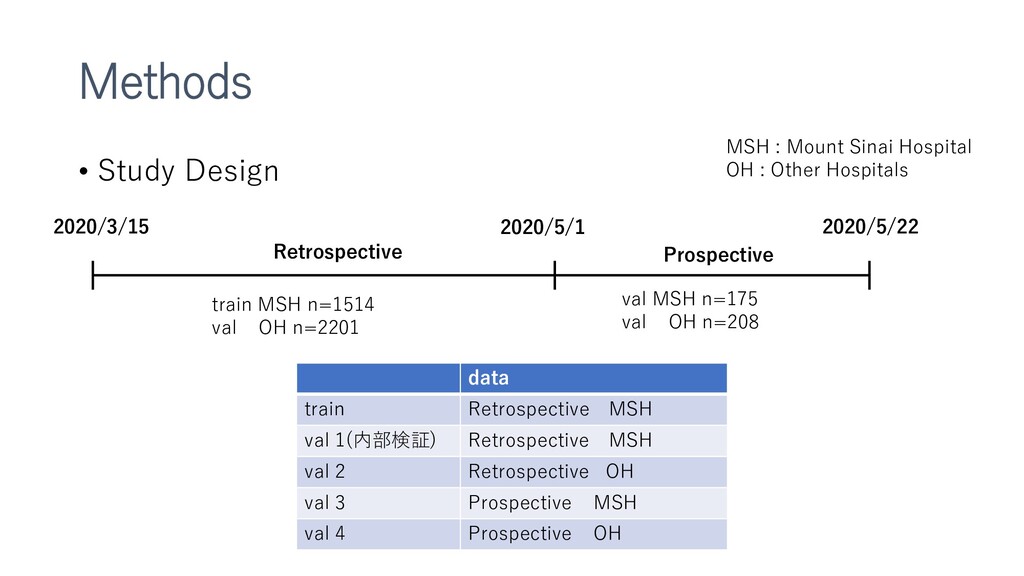
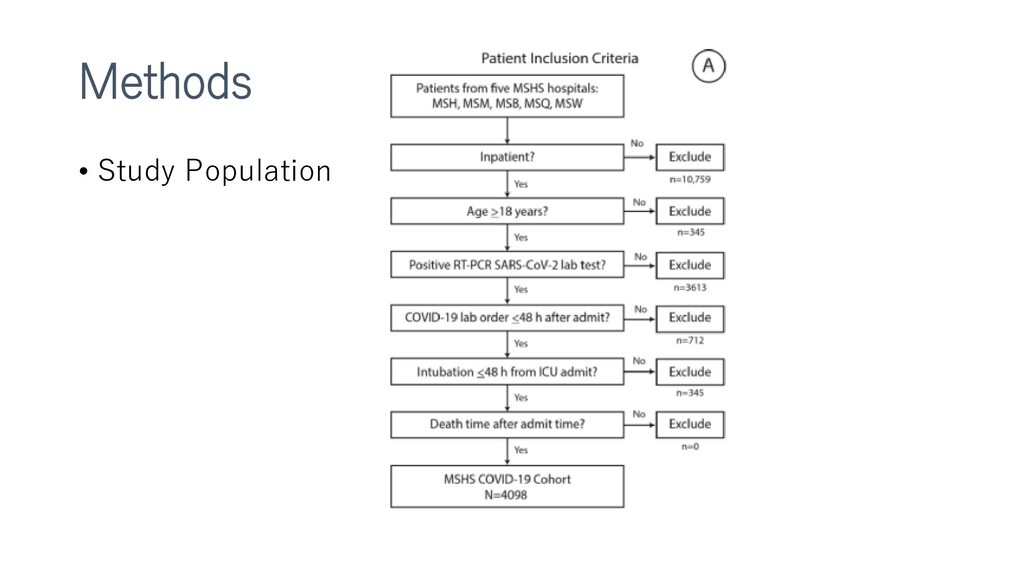
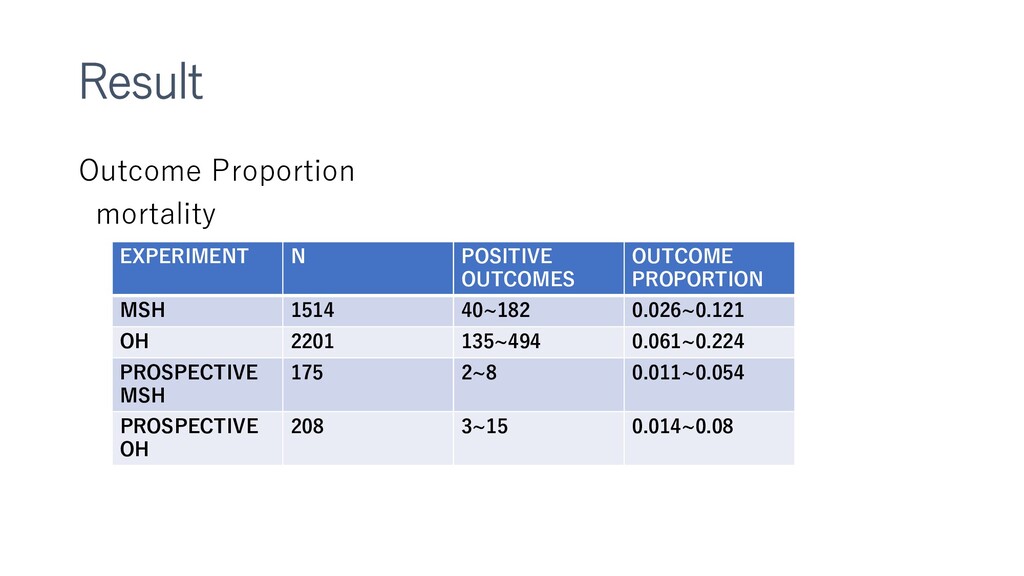
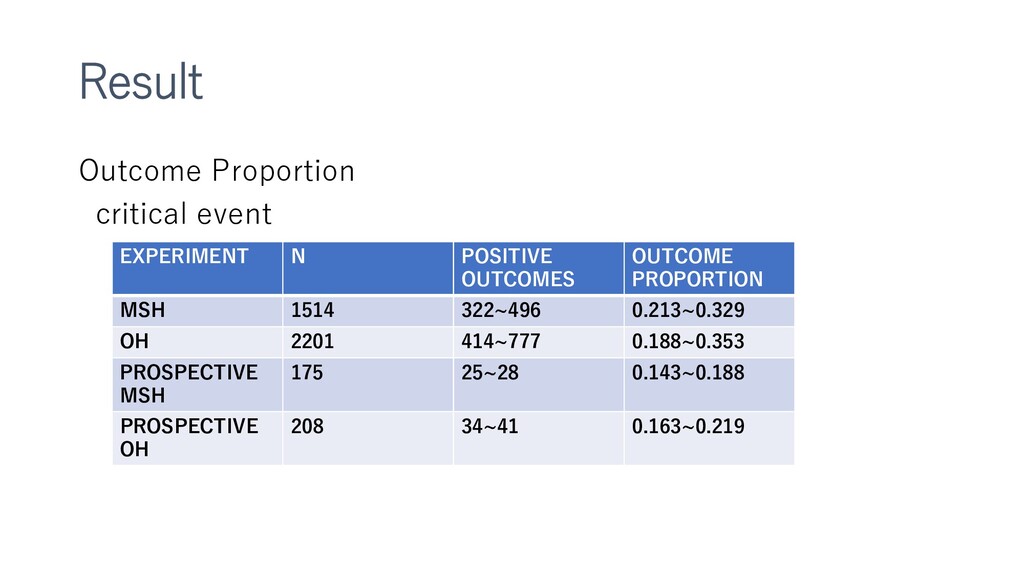
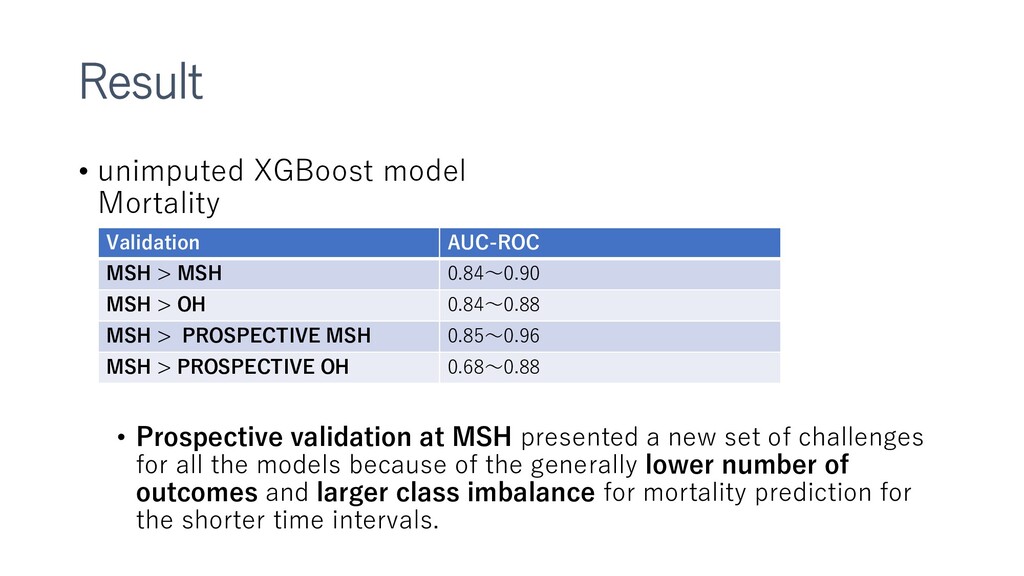
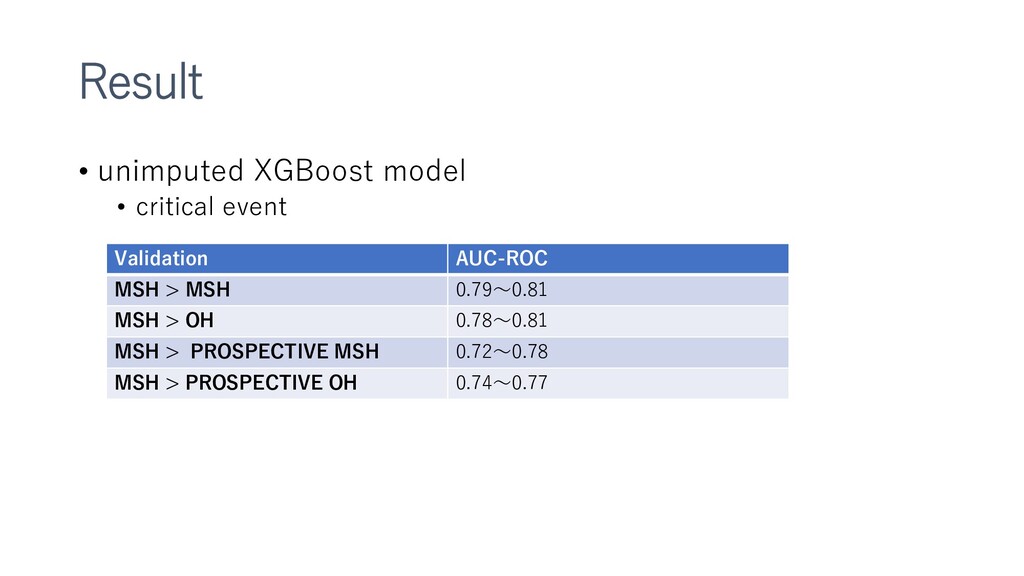
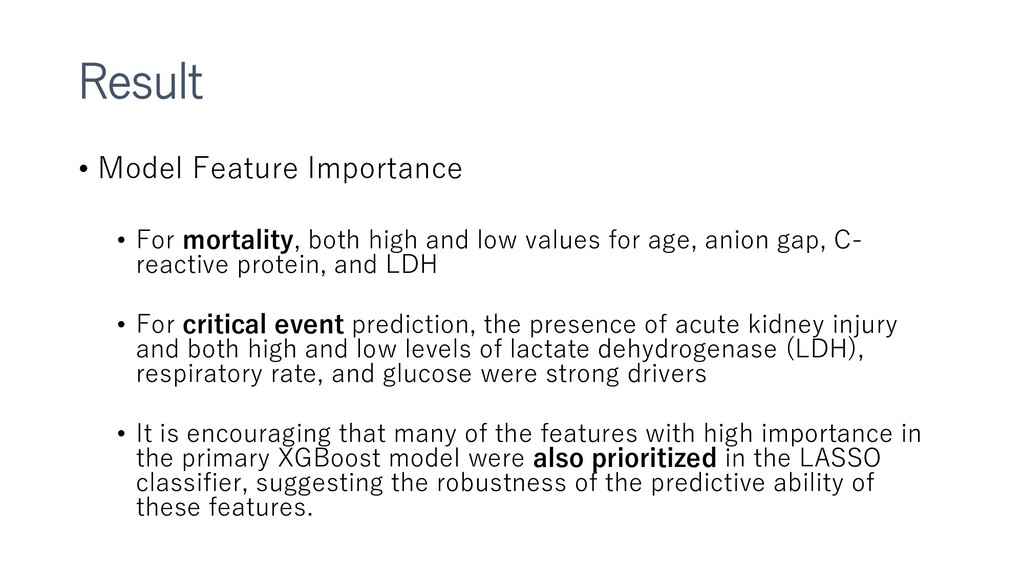
新型コロナウイルスによる死亡、重大イベントの予測をするXGboostモデルの作成など。多施設合同前向きで検証までやっているところがすごい。

各項目書き方が丁寧で、読んでいて非常に勉強になりました。

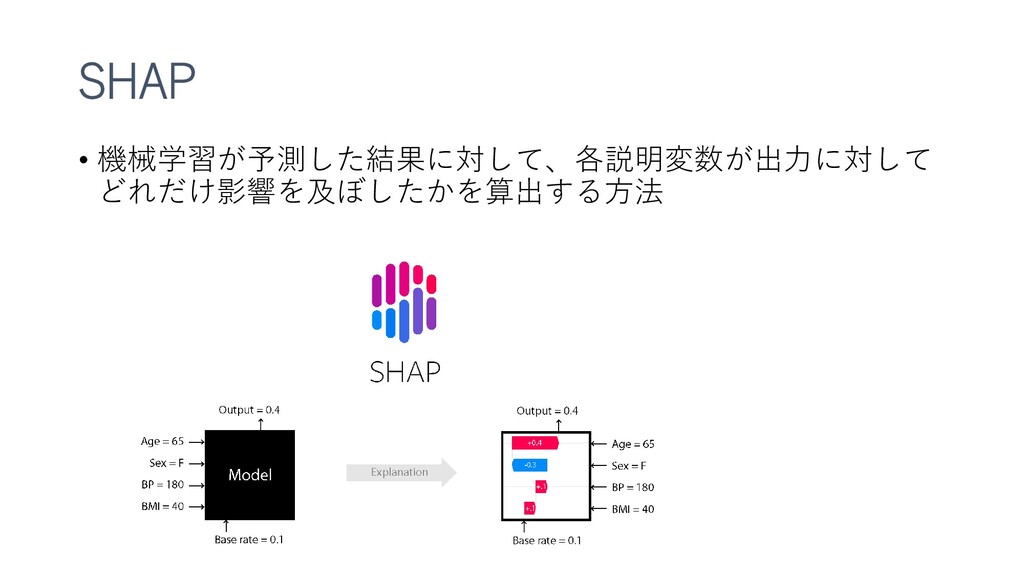
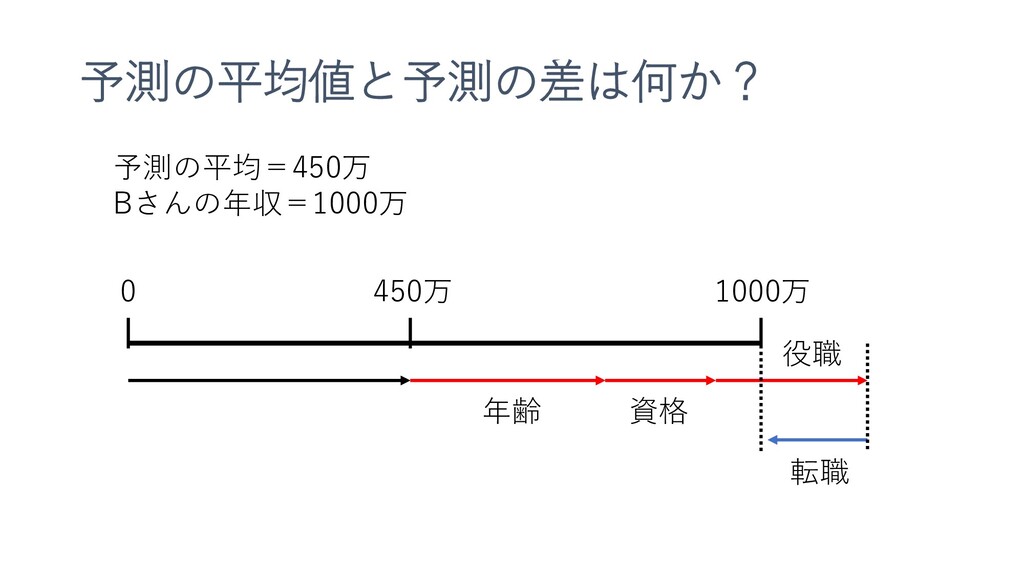
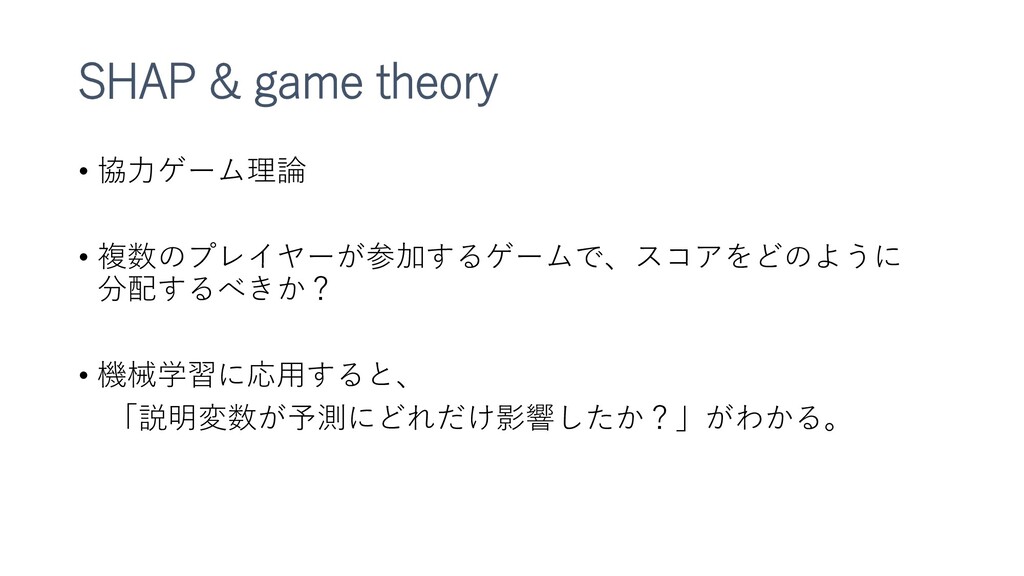
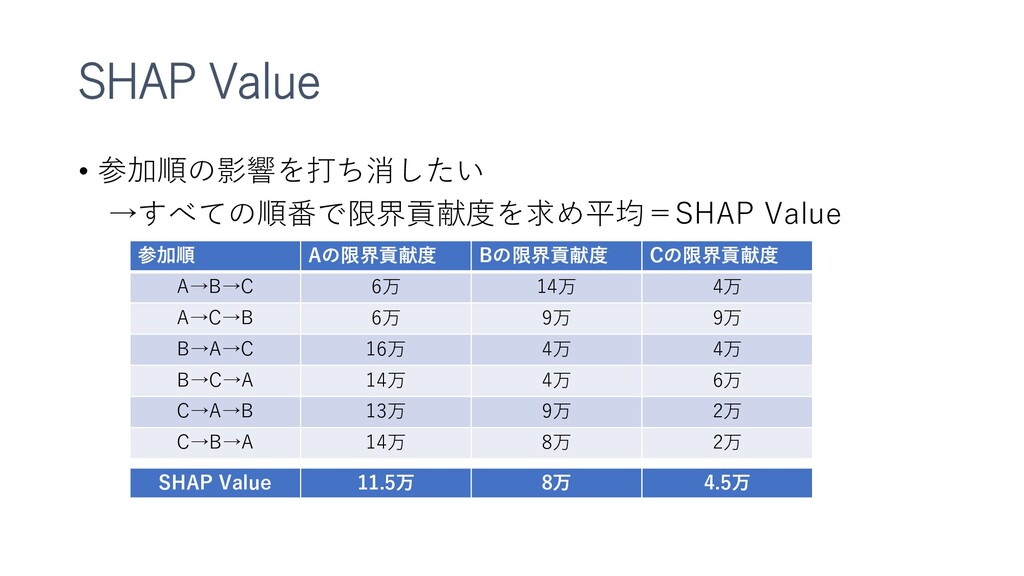
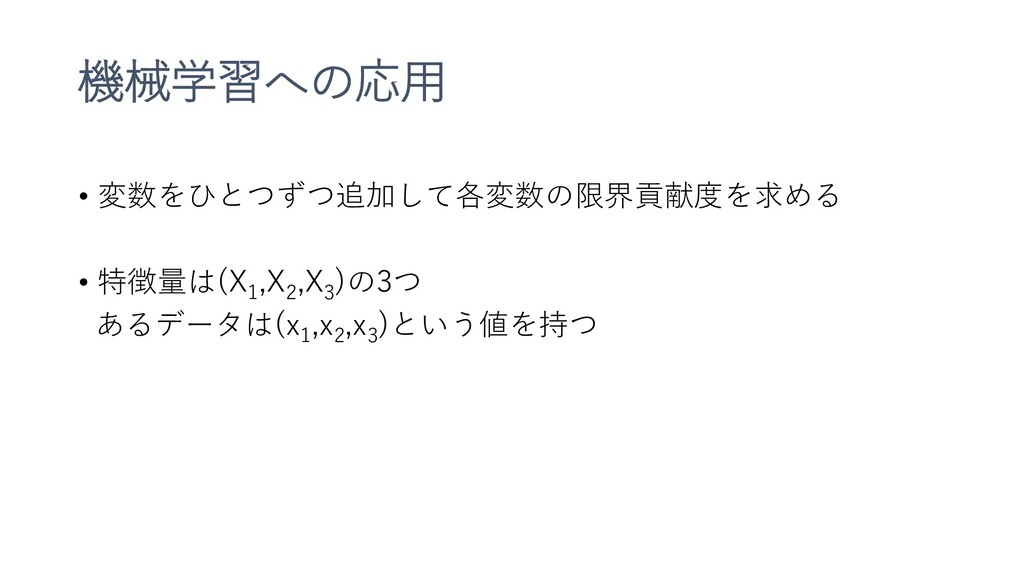
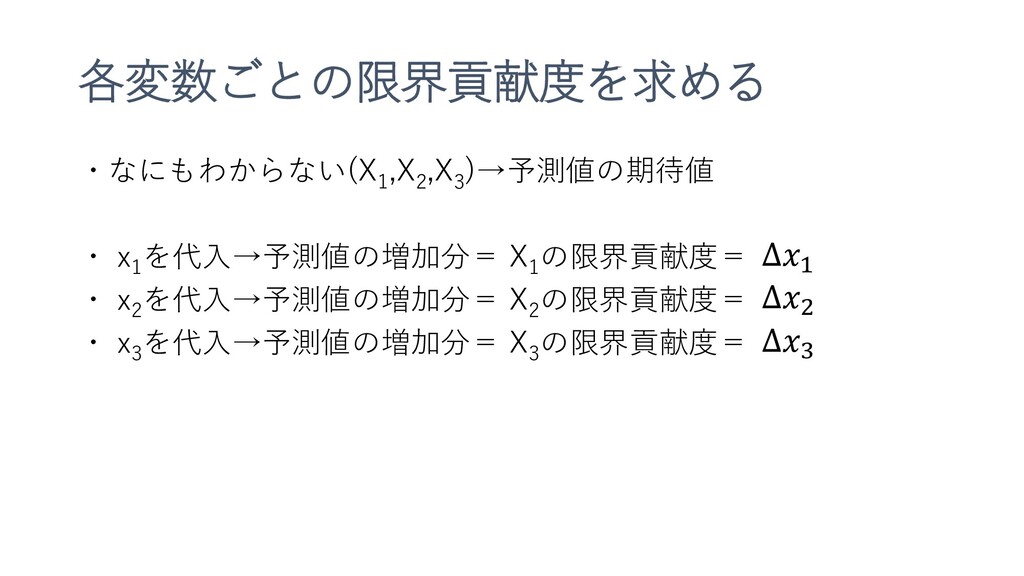
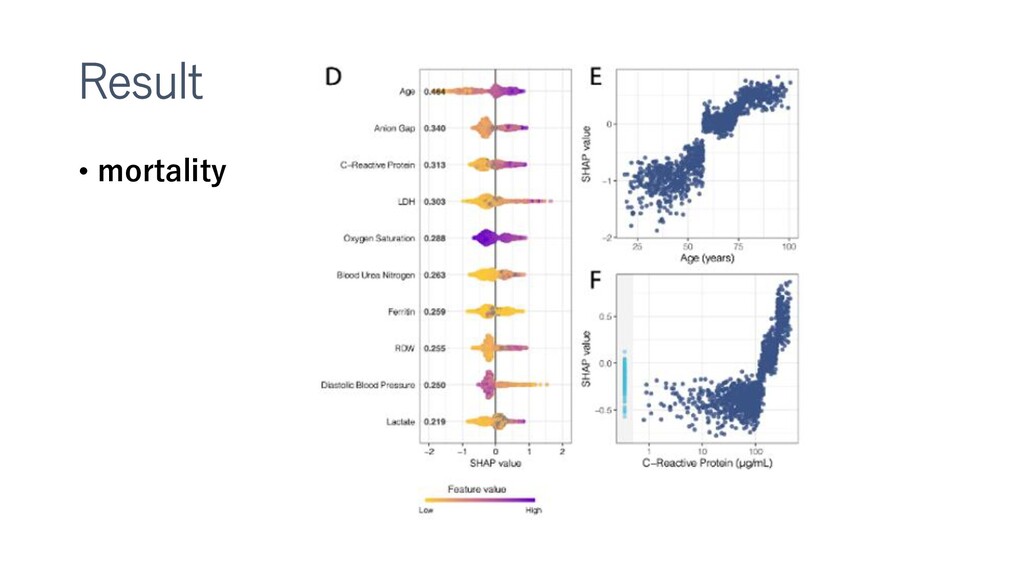
特徴重要度を得るSHAPについても紹介してみました。(複数記事のまとめなおしです)
Machine Learning to Predict Mortality and Critical Events in a Cohort of Patients With COVID-19 in New York City: Model Development and Validation

Published on 06.11.20
doi:10.2196/24018
Vaid A, Somani S, Russak AJ, De Freitas JK, Chaudhry FF, Paranjpe I, Johnson KW, Lee SJ, Miotto R, Richter F, Zhao S, Beckmann ND, Naik N, Kia A, Timsina P, Lala A, Paranjpe M, Golden E, Danieletto M, Singh M, Meyer D, O'Reilly PF, Huckins L, Kovatch P, Finkelstein J, Freeman RM, Argulian E, Kasarskis A, Percha B, Aberg JA, Bagiella E, Horowitz CR, Murphy B, Nestler EJ, Schadt EE, Cho JH, Cordon-Cardo C, Fuster V, Charney DS, Reich DL, Bottinger EP, Levin MA, Narula J, Fayad ZA, Just AC, Charney AW, Nadkarni GN, Glicksberg BS

harunashi

February 26, 2021
Tweet

More Decks by harunashi

Other Decks in Science

Transcript

  1. Machine Learning to Predict Mortality and Critical Events in a

    Cohort of Patients With COVID-19 in New York City: Model Development and Validation ニューヨーク市におけるCOVID-19入院患者の 死亡、重大イベント予測モデルの開発、その検証
  2. 論文 Machine Learning to Predict Mortality and Critical Events in

    a Cohort of Patients With COVID-19 in New York City: Model Development and Validation Published on 06.11.20 doi:10.2196/24018 いろんなことがちゃんと書かれている、きっちりやってる
  3. Introduction • however, efforts have been limited by small sample

    sizes, lack of generalization to diverse populations, disparities in feature missingness, and potential for bias. →Prediction models for diagnosis and prognosis of covid-19: systematic review and critical appraisal doi: https://doi.org/10.1136/bmj.m1328
  4. Introduction Systematic review of covid-19 prediction models • 421 titles

    were screened, and 169 studies describing 232 prediction models were included. • This review indicates that almost all published prediction models are poorly reported, and at high risk of bias such that their reported predictive performance is probably optimistic.
  5. Methods • Study Design 2020/3/15 2020/5/1 2020/5/22 Retrospective Prospective train

    MSH n=1514 val OH n=2201 val MSH n=175 val OH n=208 MSH : Mount Sinai Hospital OH : Other Hospitals data train Retrospective MSH val 1(内部検証) Retrospective MSH val 2 Retrospective OH val 3 Prospective MSH val 4 Prospective OH
  6. Methods • Study Data • the first laboratory value in

    a 36-hour window period was used as the representative laboratory value on admission. • data below the 0.5th percentile and above the 99.5th percentile were removed
  7. Methods • Definition of Outcomes • death versus survival or

    discharge through time horizons of 3, 5, 7, and 10 days. • Critical illness was defined as discharge to hospice, intubation ≤48 hours prior to intensive care unit (ICU) admission, ICU admission, or death.
  8. Methods • Model Development, Selection, and Experimentation • primary model

    was the Extreme Gradient Boosting (XGBoost) • Hyperparameter tuning was performed by randomized grid searching directed toward maximizing the F1 score metric over 5000 discrete grid options • Ten-fold stratified cross-validation was performed • To generate confidence intervals for the internal validation set, training and testing was performed for 500 bootstrap iterations with a unique randomly generated seed for the train-test data splits.
  9. Methods • Model Development, Selection, and Experimentation • we generated

    two predictive models as a baseline, namely logistic regression (LR) and LR with L1 regularization(LASSO) • Features with >30% missingness were dropped, and k-nearest neighbors (kNN, k=5) was used to impute missing data
  10. Result Outcome Proportion mortality EXPERIMENT N POSITIVE OUTCOMES OUTCOME PROPORTION

    MSH 1514 40~182 0.026~0.121 OH 2201 135~494 0.061~0.224 PROSPECTIVE MSH 175 2~8 0.011~0.054 PROSPECTIVE OH 208 3~15 0.014~0.08
  11. Result Outcome Proportion critical event EXPERIMENT N POSITIVE OUTCOMES OUTCOME

    PROPORTION MSH 1514 322~496 0.213~0.329 OH 2201 414~777 0.188~0.353 PROSPECTIVE MSH 175 25~28 0.143~0.188 PROSPECTIVE OH 208 34~41 0.163~0.219
  12. Result • unimputed XGBoost model Mortality • Prospective validation at

    MSH presented a new set of challenges for all the models because of the generally lower number of outcomes and larger class imbalance for mortality prediction for the shorter time intervals. Validation AUC-ROC MSH > MSH 0.84~0.90 MSH > OH 0.84~0.88 MSH > PROSPECTIVE MSH 0.85~0.96 MSH > PROSPECTIVE OH 0.68~0.88
  13. Result • unimputed XGBoost model • critical event Validation AUC-ROC

    MSH > MSH 0.79~0.81 MSH > OH 0.78~0.81 MSH > PROSPECTIVE MSH 0.72~0.78 MSH > PROSPECTIVE OH 0.74~0.77
  14. SHAP & game theory • 協力ゲーム理論 • 複数のプレイヤーが参加するゲームで、スコアをどのように 分配するべきか? •

    機械学習に応用すると、 「説明変数が予測にどれだけ影響したか?」がわかる。
  15. 限界貢献度 • 参加者による報酬増額分を求める • 報酬増額分は誰が参加しているかに依存する =報酬は参加する順番に依存する 参加パターン 報酬総額 A参加による最大増額=限界貢献度 誰もいない→A君

    6万 6万 Bだけ→A+B 20万 16万 Cだけ→A+C 15万 13万 BとC→A+B+C 24万 14万 参加者 報酬額 A君 6万 B君 4万 C君 2万 A+B君 20万 A+C君 15万 B+C君 10万 A+B+C君 24万
  16. SHAP Value • 参加順の影響を打ち消したい →すべての順番で限界貢献度を求め平均=SHAP Value 参加順 Aの限界貢献度 Bの限界貢献度 Cの限界貢献度

    A→B→C 6万 14万 4万 A→C→B 6万 9万 9万 B→A→C 16万 4万 4万 B→C→A 14万 4万 6万 C→A→B 13万 9万 2万 C→B→A 14万 8万 2万 SHAP Value 11.5万 8万 4.5万
  17. 各変数ごとの限界貢献度を求める ・なにもわからない(X 1 ,X 2 ,X 3 )→予測値の期待値 ・ x

    1 を代入→予測値の増加分= X 1 の限界貢献度= ・ x 2 を代入→予測値の増加分= X 2 の限界貢献度= ・ x 3 を代入→予測値の増加分= X 3 の限界貢献度= Δ𝑥1 Δ𝑥2 Δ𝑥3
  18. 各変数ごとのSHAP Valueを求める 𝐸[𝑓 𝑥1 , 𝑥2 , 𝑋3 ] 𝐸[𝑓

    𝑥1 , 𝑥2 , 𝑥3 ] E[𝑓 𝑋1 , 𝑋2 , 𝑋3 ] 𝐸[𝑓 𝑥1 , 𝑋2 , 𝑋3 ] Δ𝑥1 Δ𝑥2 Δ𝑥3 • 限界貢献度は代入する順番で変わるので すべての順序で計算して平均する
  19. Result • Model Feature Importance • For mortality, both high

    and low values for age, anion gap, C- reactive protein, and LDH • For critical event prediction, the presence of acute kidney injury and both high and low levels of lactate dehydrogenase (LDH), respiratory rate, and glucose were strong drivers • It is encouraging that many of the features with high importance in the primary XGBoost model were also prioritized in the LASSO classifier, suggesting the robustness of the predictive ability of these features.
  20. Discussion • Along these lines, we found that our imputation

    strategy generally hindered the performance of the XGBoost model. • this corroboration of the features learned by XGBoost and highlighted by the SHAP analysis with the findings from pathophysiological principles and more recent correlative studies exploring patients with COVID-19 gives additional credibility to these findings.
  21. Limitations • Although the restriction of using data at admission

    encourages the use of this model in patient triage, events during a patient’s hospital stay after admission may drive their clinical course away from the prior probability, which cannot be captured by baseline admission features. • patients admitted to the hospital later in the crisis benefited from improved patient care protocols from experiential learning … which is demonstrated by the lower critical event and mortality rate in the prospective validation data set
  22. Limitations • all five hospitals operate in a single health

    system, system- wide protocols in laboratory order sets and management protocols were an additional source of bias that may lower external validity. • notable drawback is its bias toward continuous features instead of categorical ones
  23. Others • Transparent reporting of a multivariable prediction model for

    individual prognosis or diagnosis (TRIPOD): the TRIPOD Statement https://bmcmedicine.biomedcentral.com/articles/10.1186/s12916-014-0241-z • Bias in random forest variable importance measures: Illustrations, sources and a solution https://bmcbioinformatics.biomedcentral.com/articles/10.1186/1471-2105-8-25