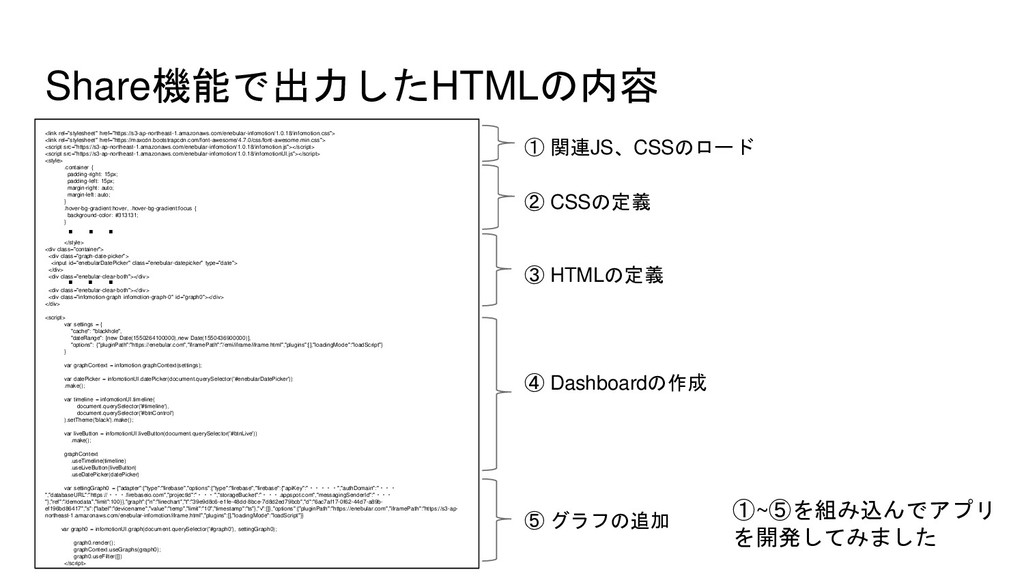
src="https://s3-ap-northeast-1.amazonaws.com/enebular-infomotion/1.0.18/infomotionUI.js"></script> <style> .container { padding-right: 15px; padding-left: 15px; margin-right: auto; margin-left: auto; } .hover-bg-gradient:hover, .hover-bg-gradient:focus { background-color: #313131; } </style> <div class="container"> <div class="graph-date-picker"> <input id="enebularDatePicker" class="enebular-datepicker" type="date"> </div> <div class="enebular-clear-both"></div> <div class="enebular-clear-both"></div> <div class="infomotion-graph infomotion-graph-0" id="graph0"></div> </div> <script> var settings = { "cache": "blackhole", "dateRange": [new Date(1550264100000),new Date(1550436900000)], "options": {"pluginPath":"https://enebular.com","iframePath":"/emi/iframe/iframe.html","plugins":[],"loadingMode":"loadScript"} } var graphContext = infomotion.graphContext(settings); var datePicker = infomotionUI.datePicker(document.querySelector('#enebularDatePicker')) .make(); var timeline = infomotionUI.timeline( document.querySelector('#timeline'), document.querySelector('#btnControl') ).setTheme('black').make(); var liveButton = infomotionUI.liveButton(document.querySelector('#btnLive')) .make(); graphContext .useTimeline(timeline) .useLiveButton(liveButton) .useDatePicker(datePicker) var settingGraph0 = {"adapter":{"type":"firebase","options":{"type":"firebase","firebase":{"apiKey":"・・・・・","authDomain":"・・・ ","databaseURL":"https://・・・.firebaseio.com","projectId":"・・・","storageBucket":"・・・.appspot.com","messagingSenderId":"・・・ "},"ref":"/demodata","limit":100}},"graph":{"n":"linechart","t":"39e9d8c6-e1fe-48dd-8bce-7d8d2ed79bcb","d":"6ac7af17-0f62-44d7-a89b- ef196bd86417","s":{"label":"devicename","value":"temp","limit":"10","timestamp":"ts"},"v":[]},"options":{"pluginPath":"https://enebular.com","iframePath":"https://s3-ap- northeast-1.amazonaws.com/enebular-infomotion/iframe.html","plugins":[],"loadingMode":"loadScript"}} var graph0 = infomotionUI.graph(document.querySelector('#graph0'), settingGraph0); graph0.render(); graphContext.useGraphs(graph0); graph0.useFilter([]) </script> ・・・ ① 関連JS、CSSのロード ② CSSの定義 ③ HTMLの定義 ④ Dashboardの作成 ⑤ グラフの追加 ・・・ ①~⑤を組み込んでアプリ を開発してみました
![自己紹介 髙野英樹 2018年10月〜 ウフルに入社し、enebular開発に参加 enebularの大量Device対応 / InfoMotionの開発を担当 [好きな動物] 猫 [趣味]](https://files.speakerdeck.com/presentations/b94e36e97730449c8f516e53fa2d486d/slide_1.jpg)
![本日ご報告すること • InfoMotionとは何かについてご紹介します • [誰も知らない(かもしれない)話]として InfoMotionのShare機能についてご紹介します](https://files.speakerdeck.com/presentations/b94e36e97730449c8f516e53fa2d486d/slide_2.jpg)
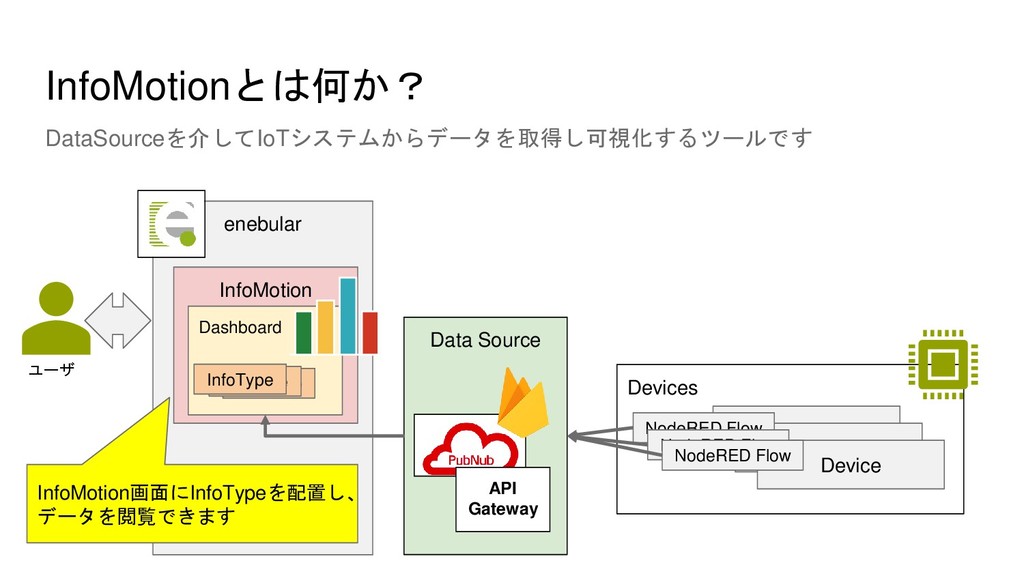
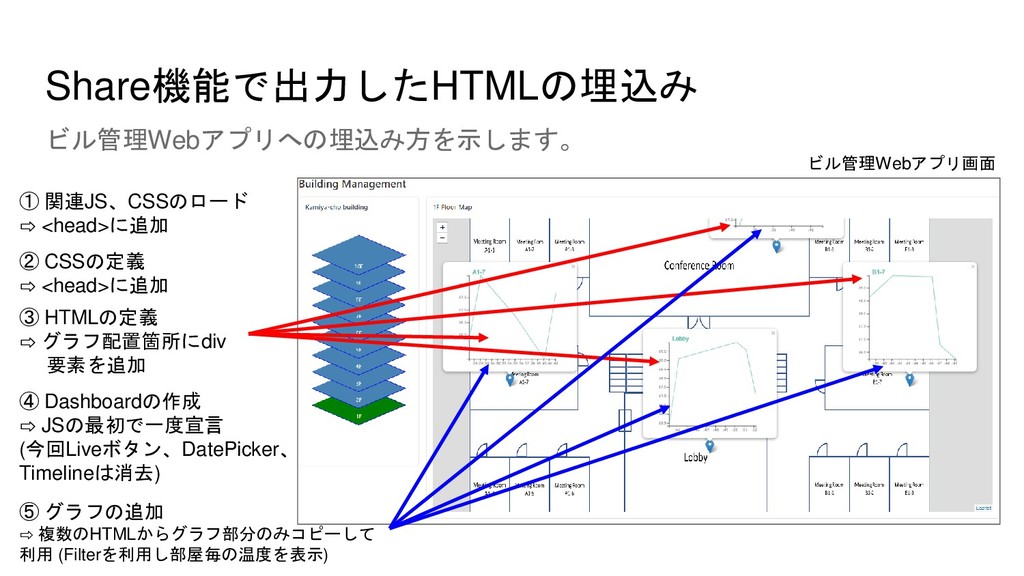
![InfoMotionはアプリを作るときの部品としても利用できます Share機能を使うとHTMLを出力し、 そのHTMLを自分のアプリに組み込むことでデータの可視化機能を備えたアプリを開発できます。 [誰も知らない(かもしれない)話] enebular Share機能 InfoMotion Dashboard InfoType InfoType](https://files.speakerdeck.com/presentations/b94e36e97730449c8f516e53fa2d486d/slide_4.jpg)