Upgrade to Pro — share decks privately, control downloads, hide ads and more …

UI design for open data

UI design for open data

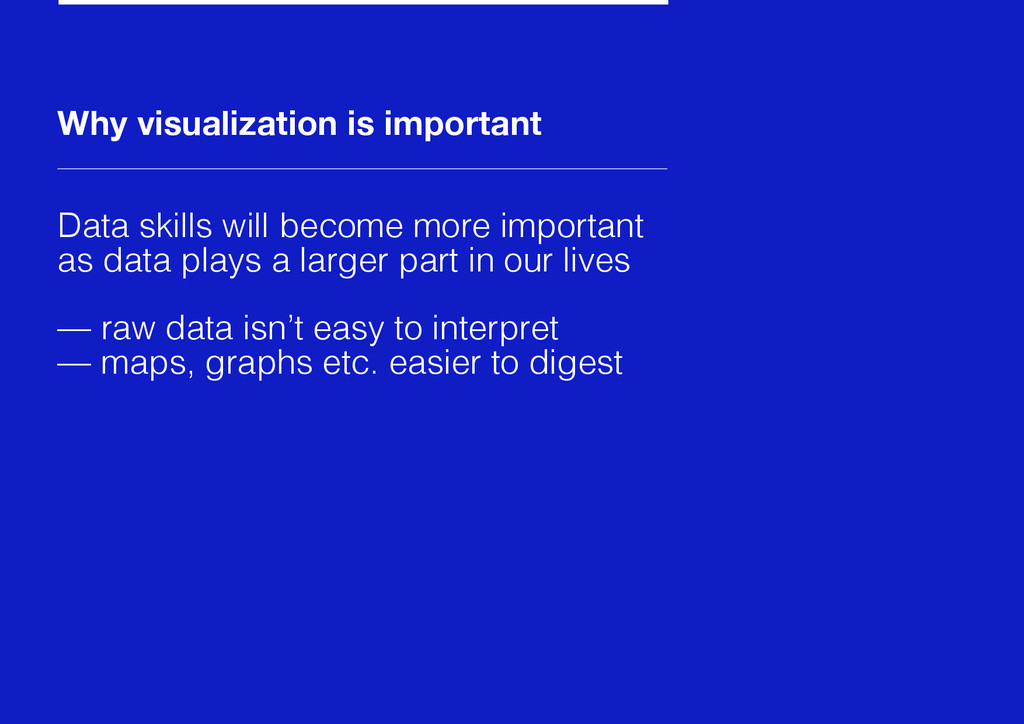
Good design can increase the value of open data to the public and industry professionals.

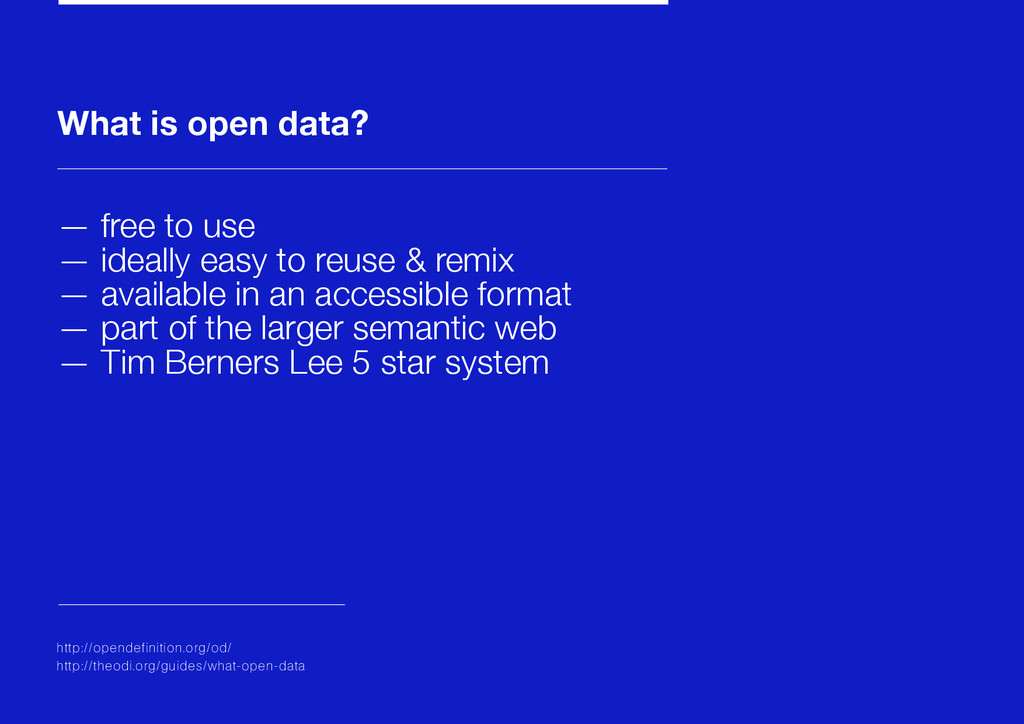
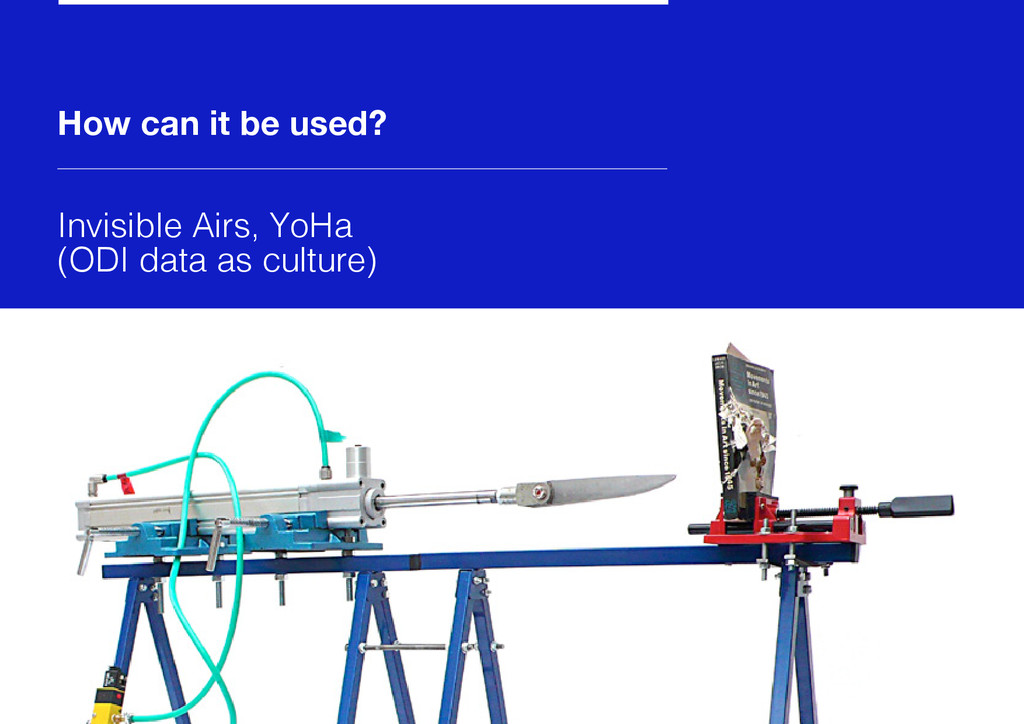
But what is open data and how can it be used? The focus of this talk is using design to aid the release of knowledge from within cultural institutions.

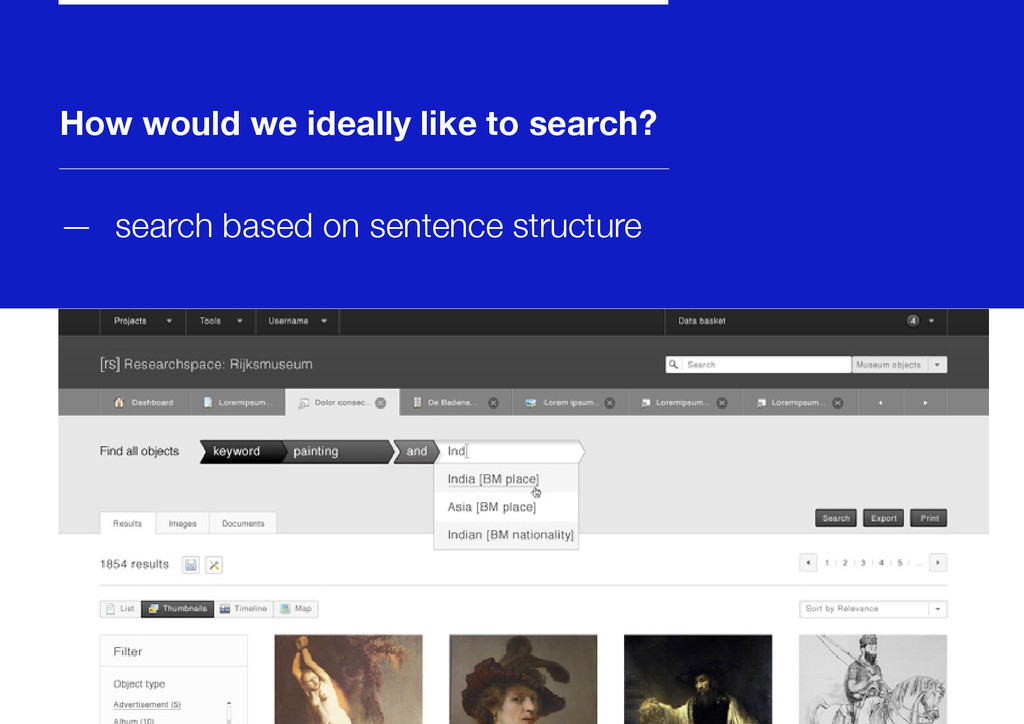
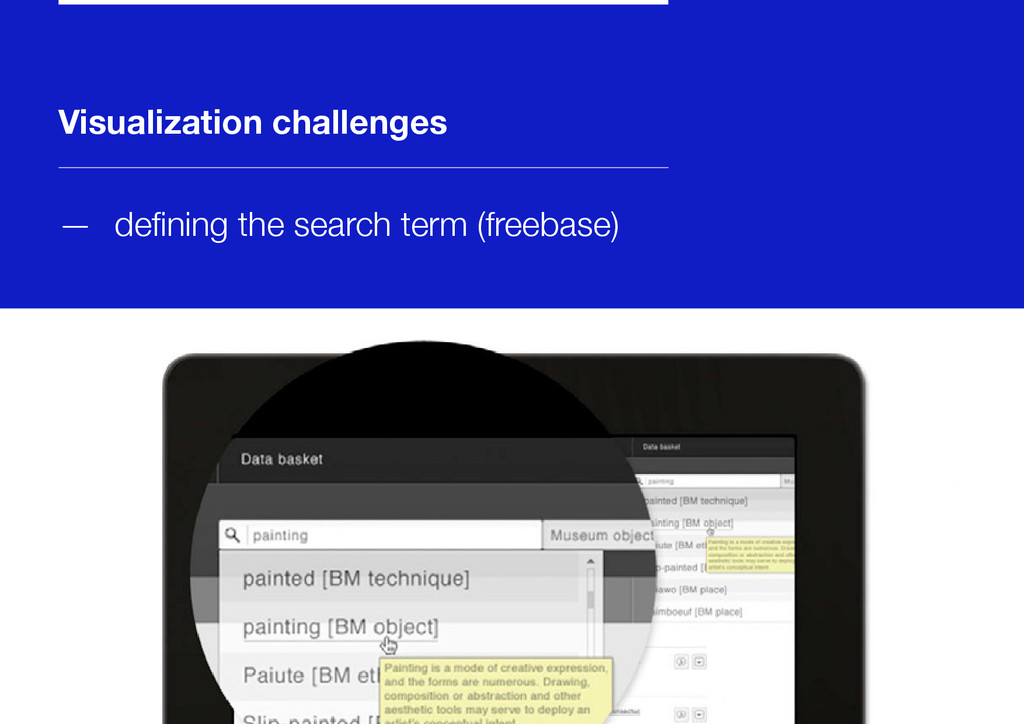
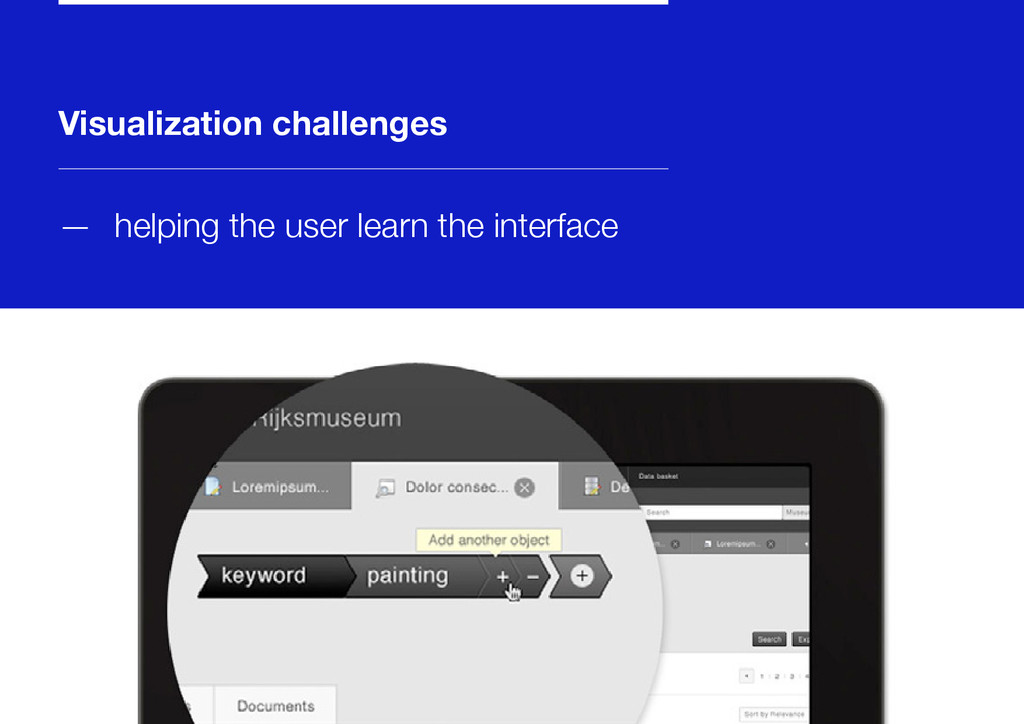
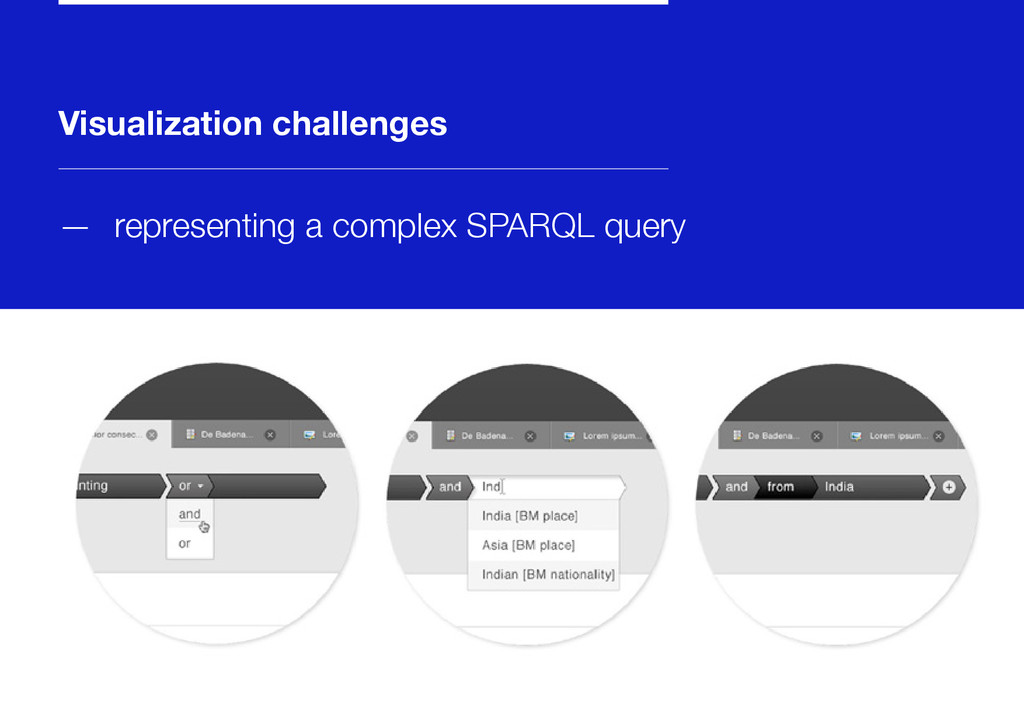
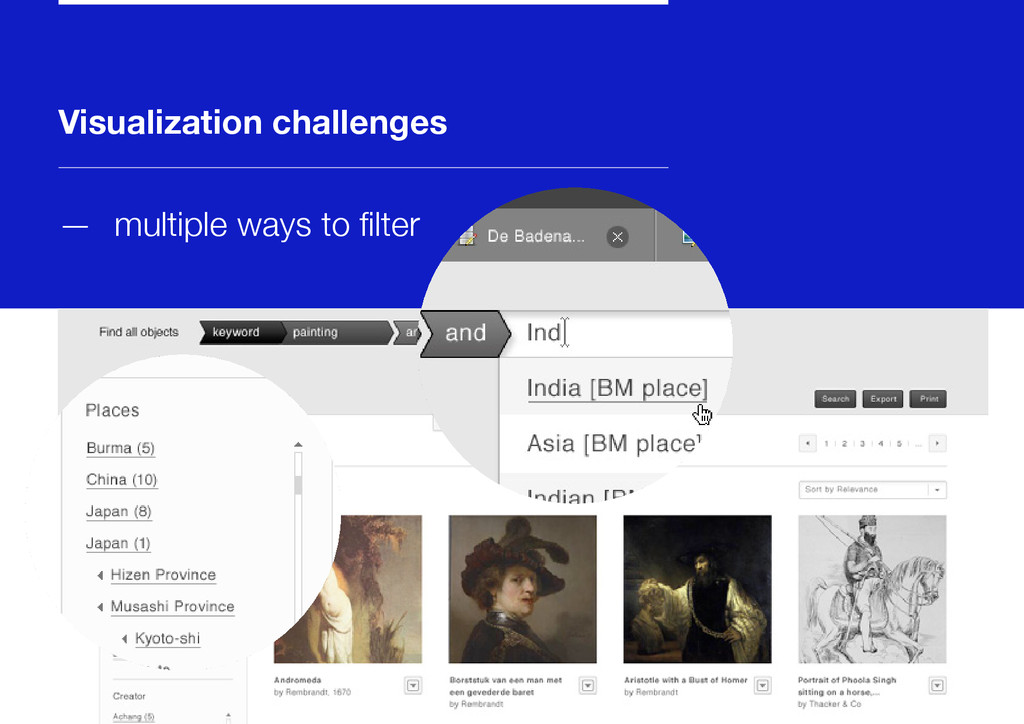
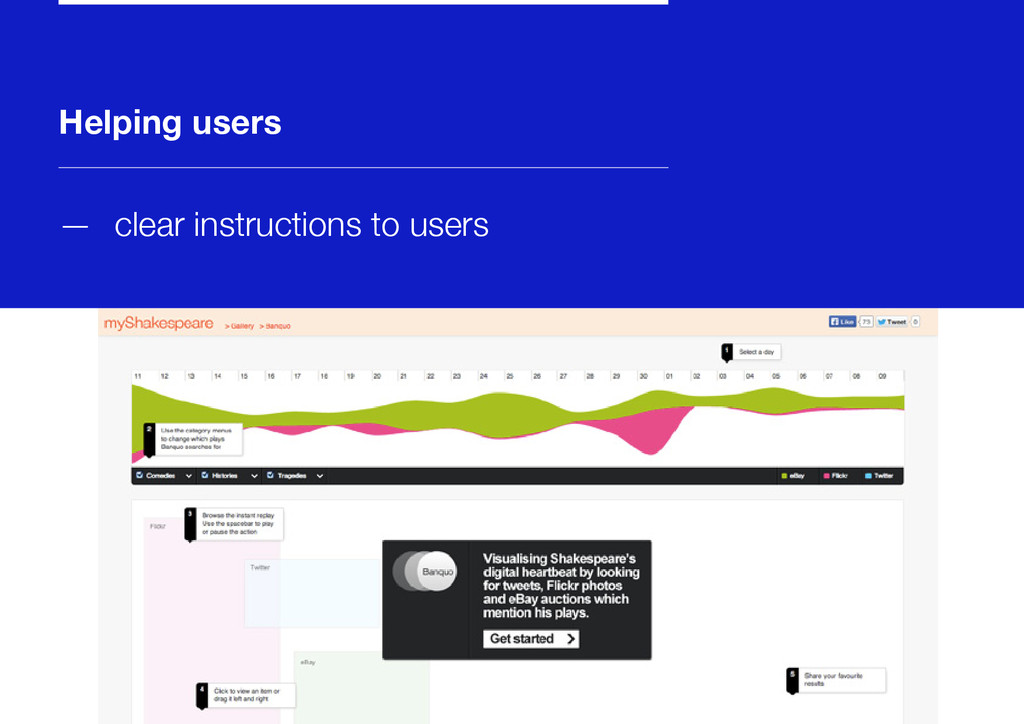
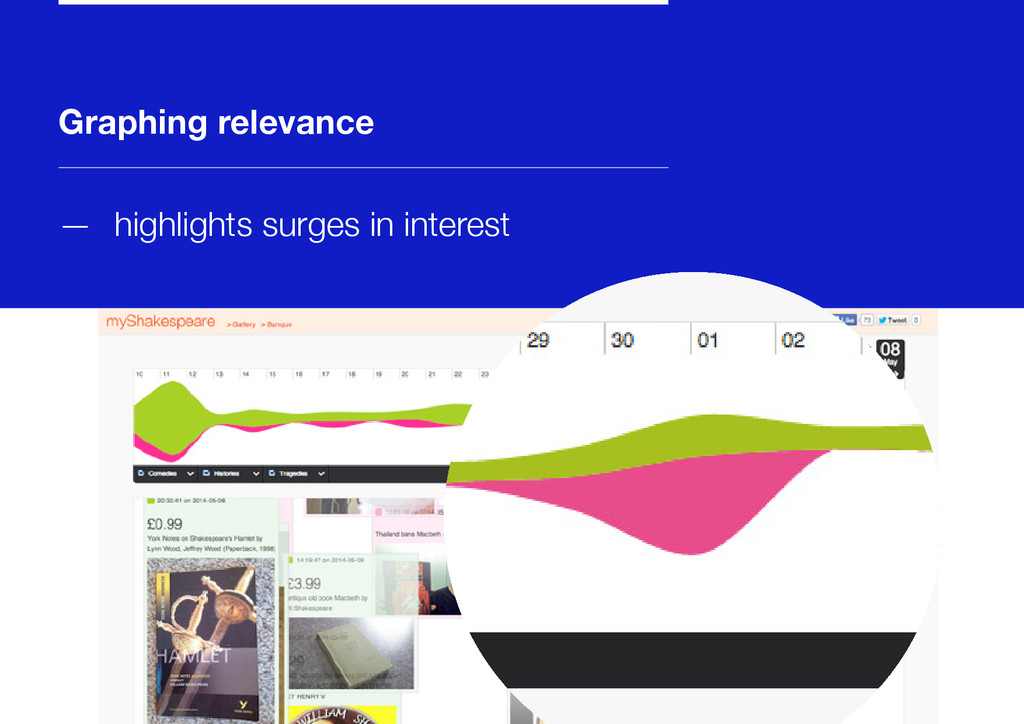
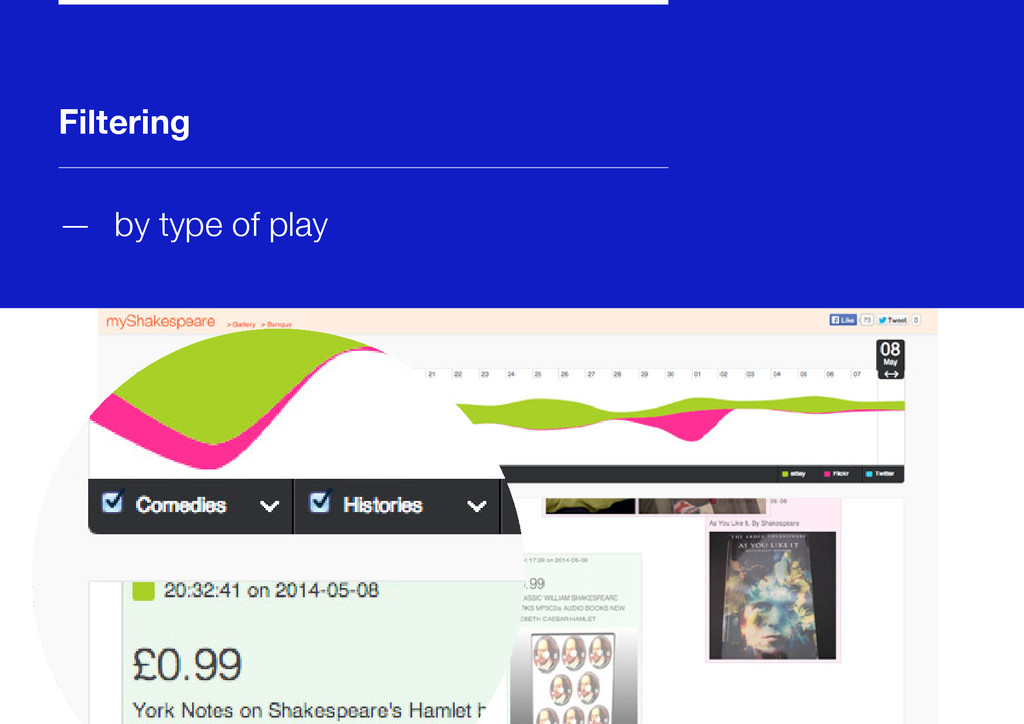
But it isn’t just about museums: I’ll be discussing the challenges of designing for complex UIs in general and how we can use narrative to inform and guide the user through abstract interactions.

Designer @bureau_va
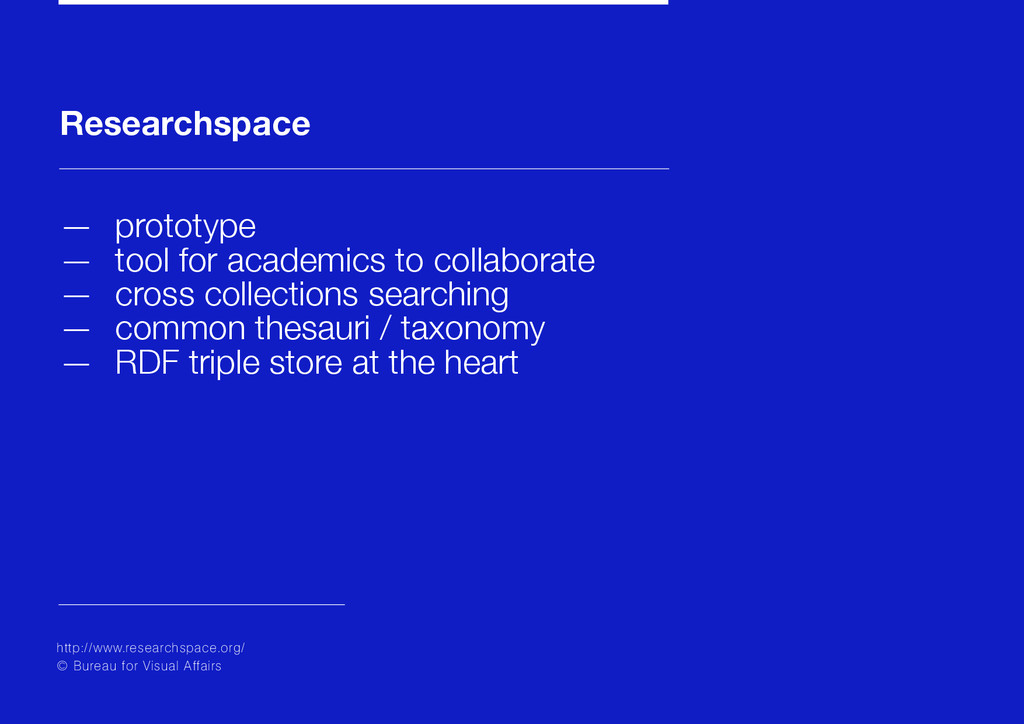
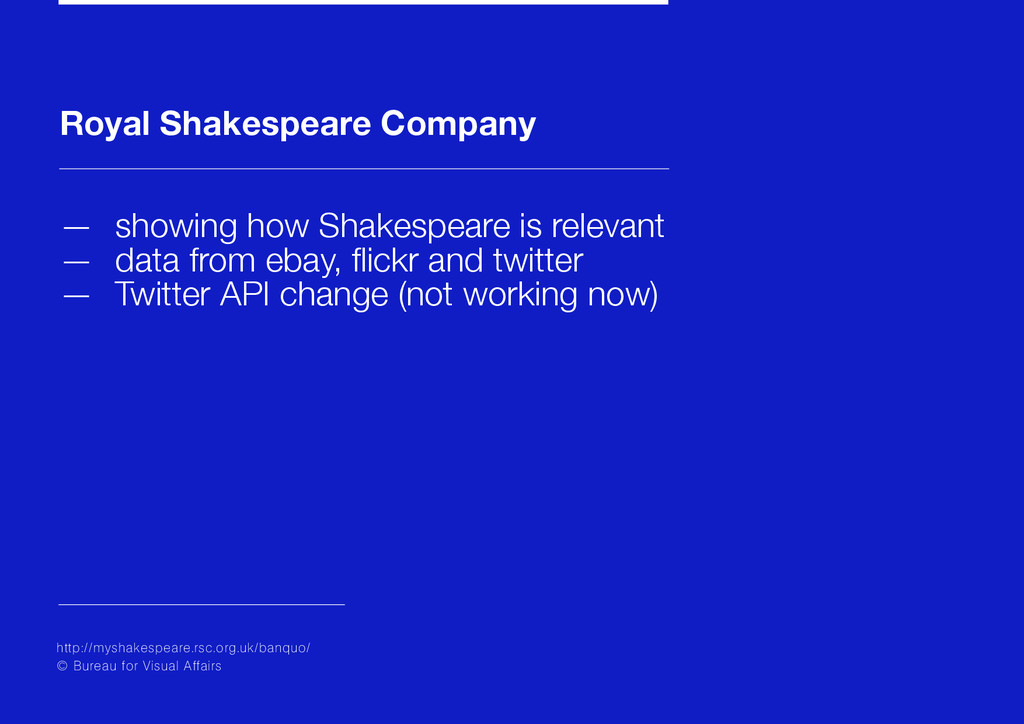
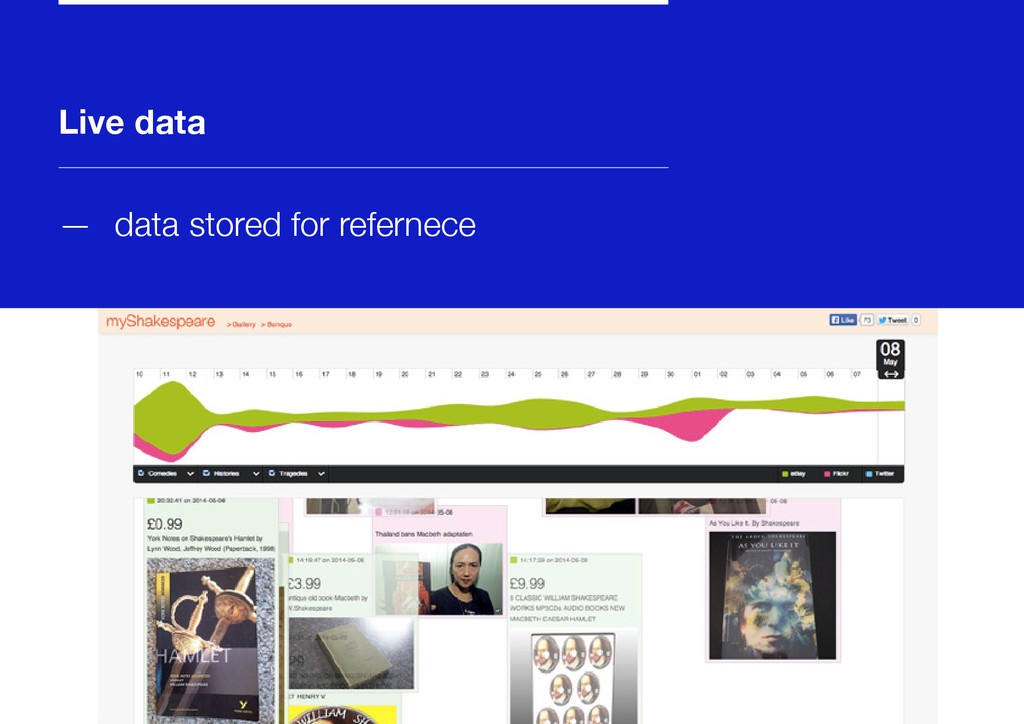
RSC projects and Researchspace © Bureau for Visual Affairs
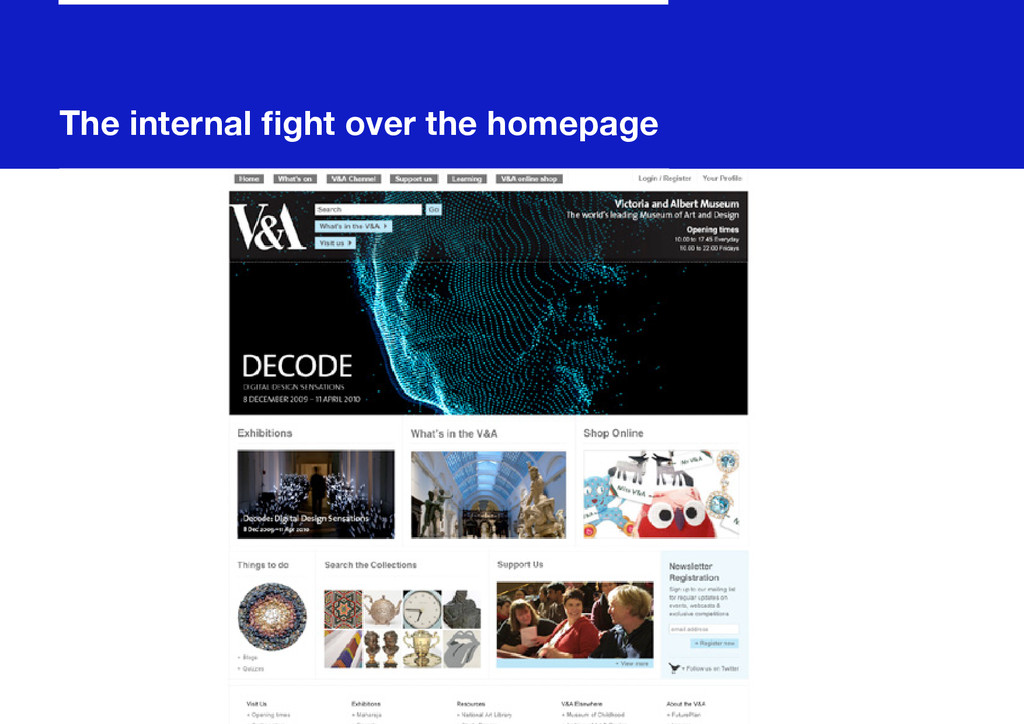
V&A © Othermedia

Hollie Lubbock

May 10, 2014
Tweet

Other Decks in Design

Transcript

  1. hello @hollielubbock — User experience / designer — Many cultural

    institutions — Museums, galleries some commercial
  2. Back ground for some projects — data as inspiration —

    designing the data — helping users see the possibilities of data
  3. What is open data? — free to use — ideally

    easy to reuse & remix — available in an accessible format — part of the larger semantic web — Tim Berners Lee 5 star system http://opendefinition.org/od/ http://theodi.org/guides/what-open-data
  4. Use in the semantic web The Semantic Web isn’t just

    about putting data on the web. It is about making links, so that a person or machine can explore the web of data. With linked data, when you have some of it, you can find other, related, data. http://www.w3.org/DesignIssues/LinkedData.html
  5. How can it be used? £200m possible saving to nhs

    by switching to a generic drug http://theodi.org/blog/a-new-era-of-data- innovation
  6. £200m possible savings — nhs is the National Health Service

    — On one single type of medication — Found by analyzing open data — in 8 weeks — many more savings possible Mastodon C (ODI start up) http://theodi.org/blog/a-new-era-of-data- innovation
  7. How can it be used? Invisible Airs, YoHa (ODI data

    as culture) http://vimeo.com/32030340
  8. Why visualization is important Data skills will become more important

    as data plays a larger part in our lives — raw data isn’t easy to interpret — maps, graphs etc. easier to digest
  9. So how is this working in the cultural sector? —

    common thesauri being developed (cidoc crm) — sharing collections data — Tate (art gallery) — Victoria & Albert museum (uk design museum) — developing Api’s http://www.cidoc-crm.org http://www.vam.ac.uk/api/qb/ https://github.com/tategallery/collection
  10. The Future — maybe a requirement for government funding —

    GDS have started this off in UK https://gds.blog.gov.uk/
  11. Researchspace — prototype — tool for academics to collaborate —

    cross collections searching — common thesauri / taxonomy — RDF triple store at the heart http://www.researchspace.org/ © Bureau for Visual Affairs
  12. Royal Shakespeare Company — showing how Shakespeare is relevant —

    data from ebay, flickr and twitter — Twitter API change (not working now) http://myshakespeare.rsc.org.uk/banquo/ © Bureau for Visual Affairs
  13. Victoria & Albert Museum — world’s largest museum of decorative

    arts and design, — collection of over 4.5 million objects — founded in 1852 and named after Queen Victoria and Prince Albert. http://www.vam.ac.uk/ http://www.othermedia.com/data/files/ othermedia-vawebsite-qa-5.pdf
  14. Using open data as an enhancement — based on search

    — templating on the fly — uses semantic web to draw in relevant topics from external sites — exposed thesauri http://www.vam.ac.uk/ http://www.othermedia.com/data/files/ othermedia-vawebsite-qa-5.pdf