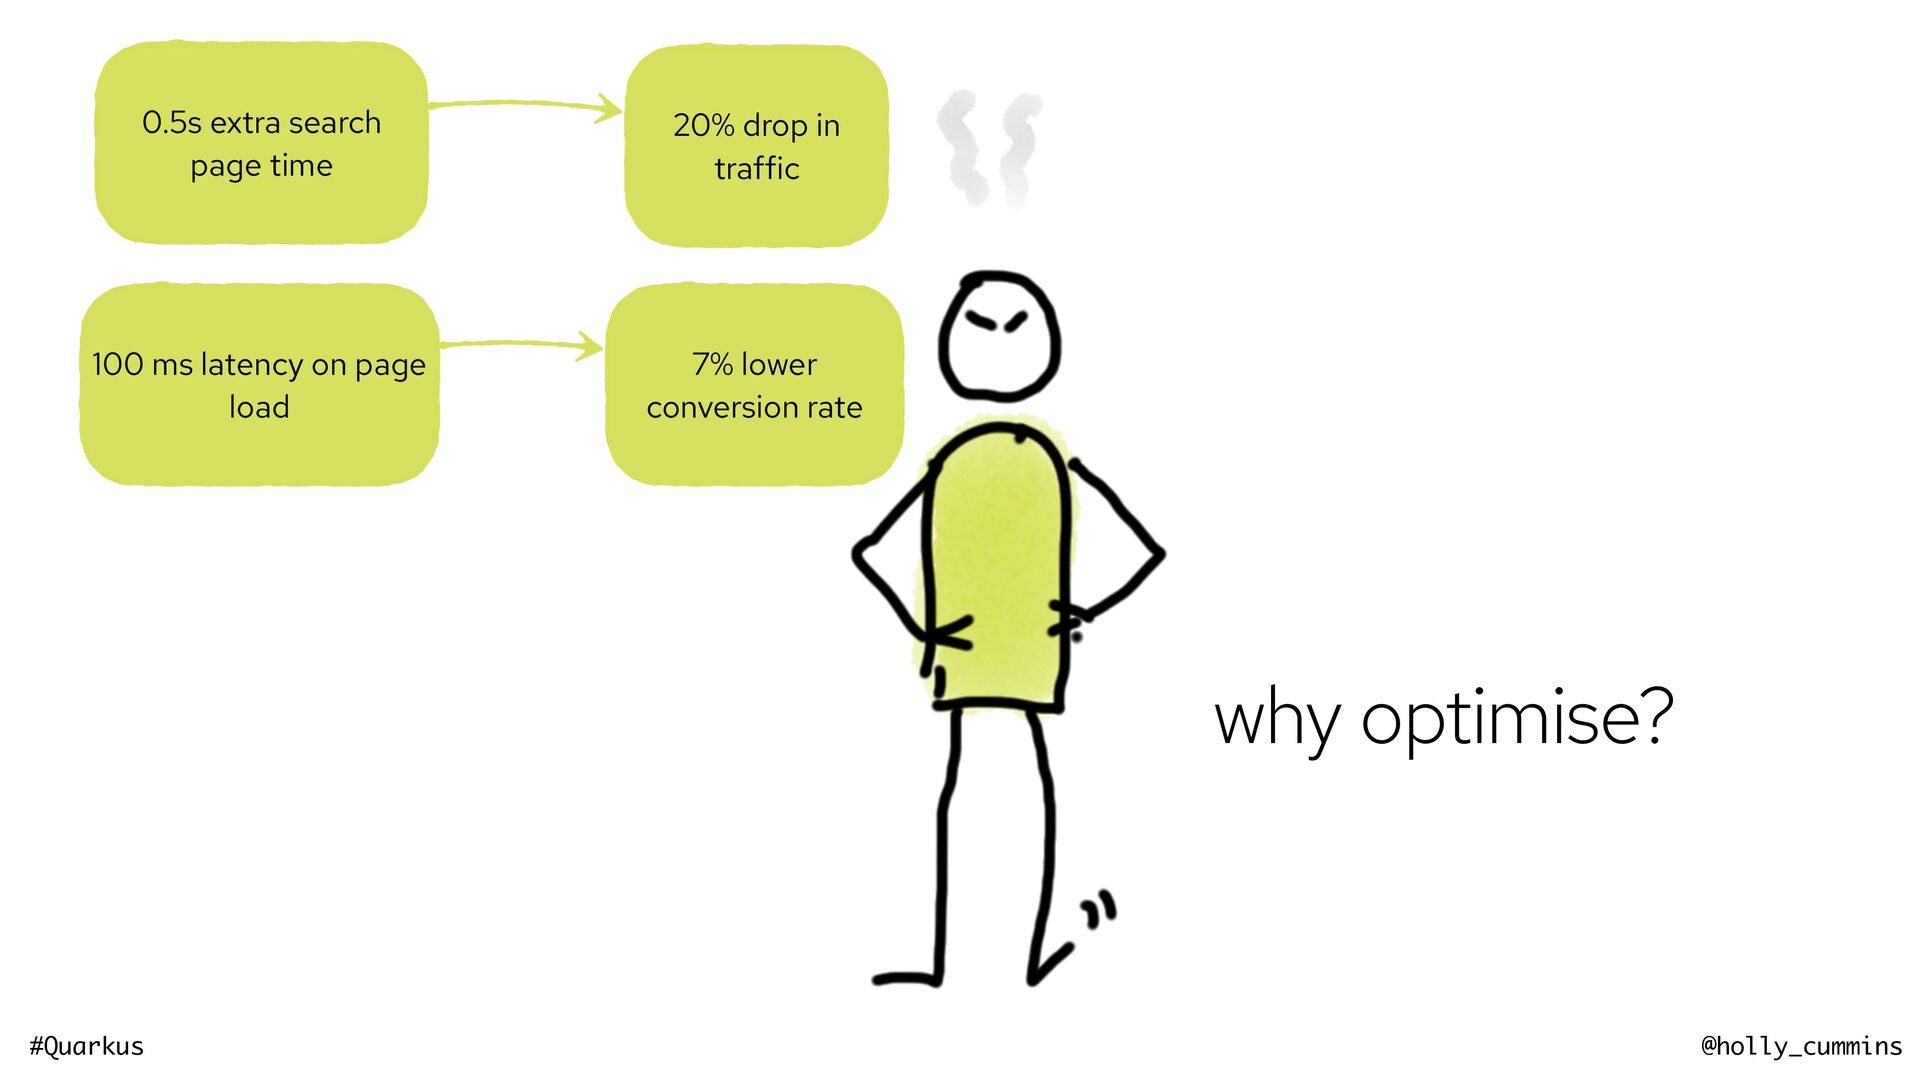
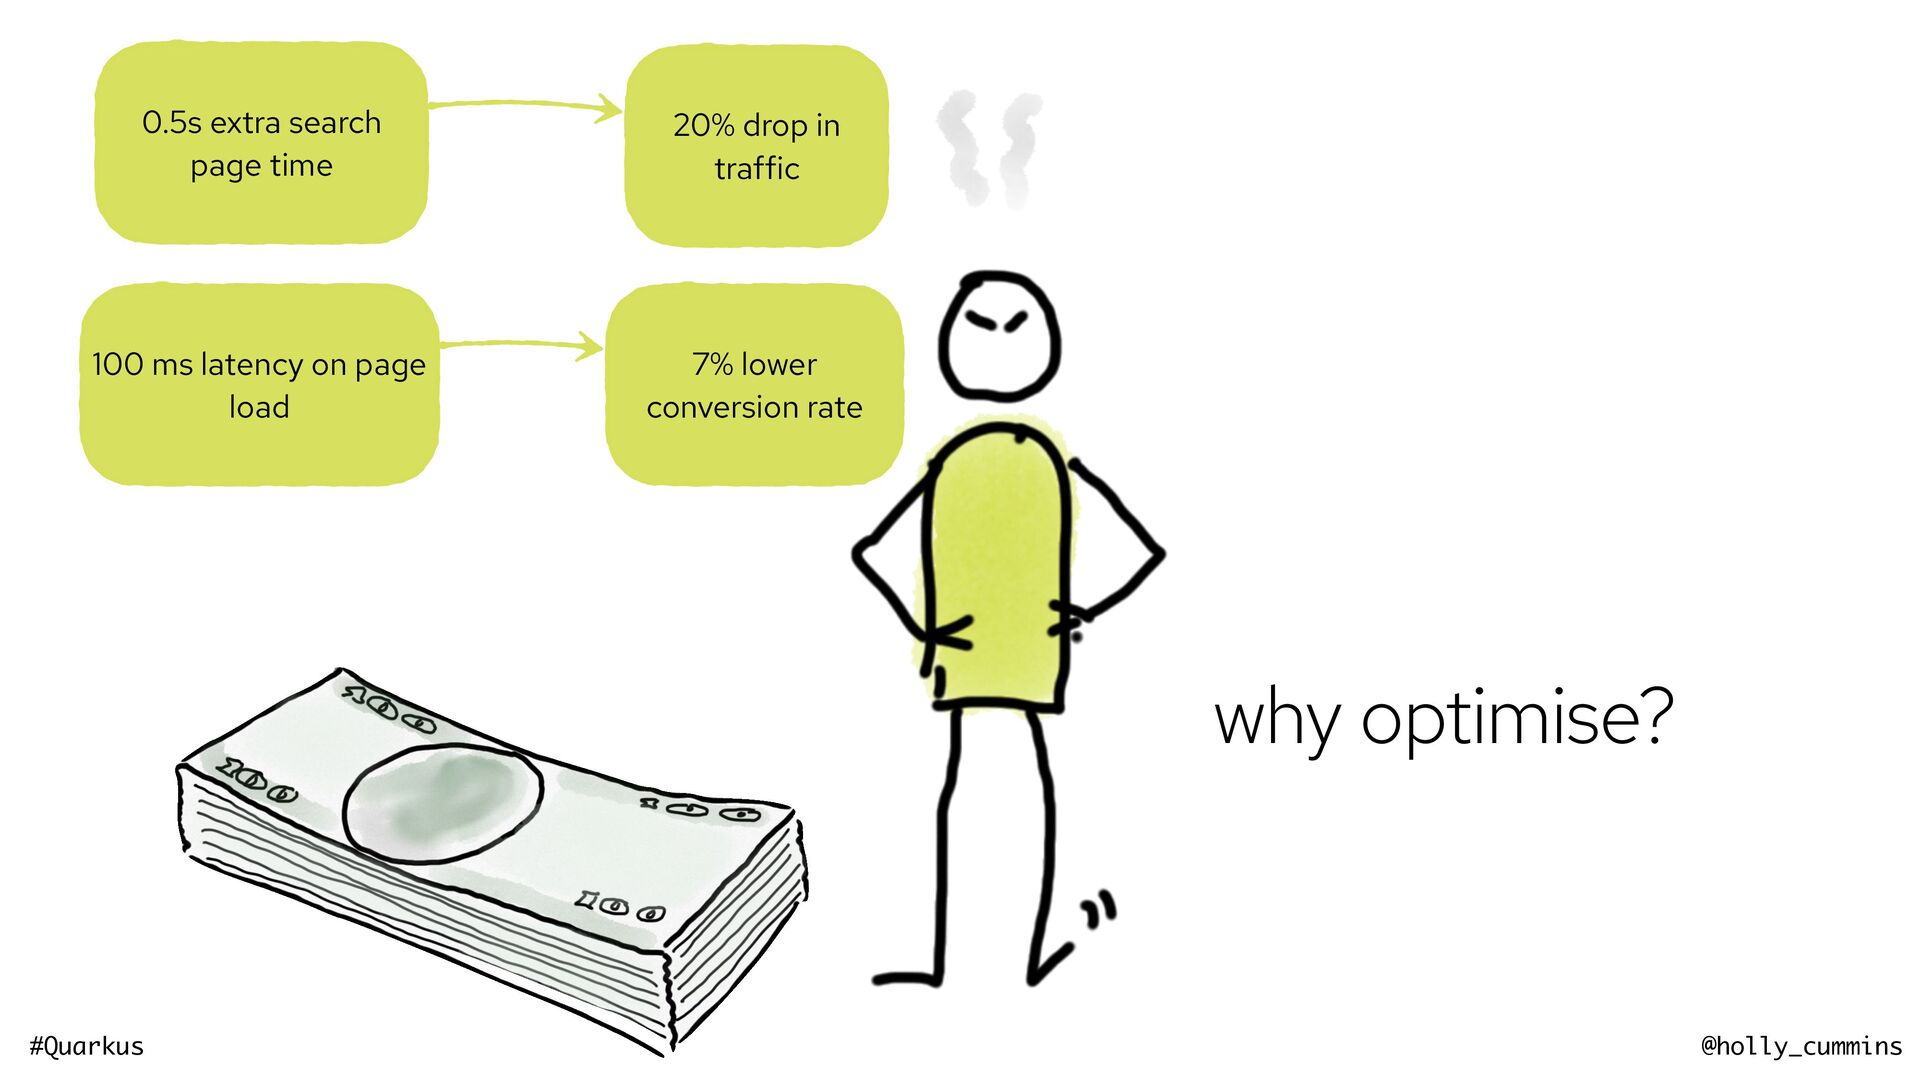
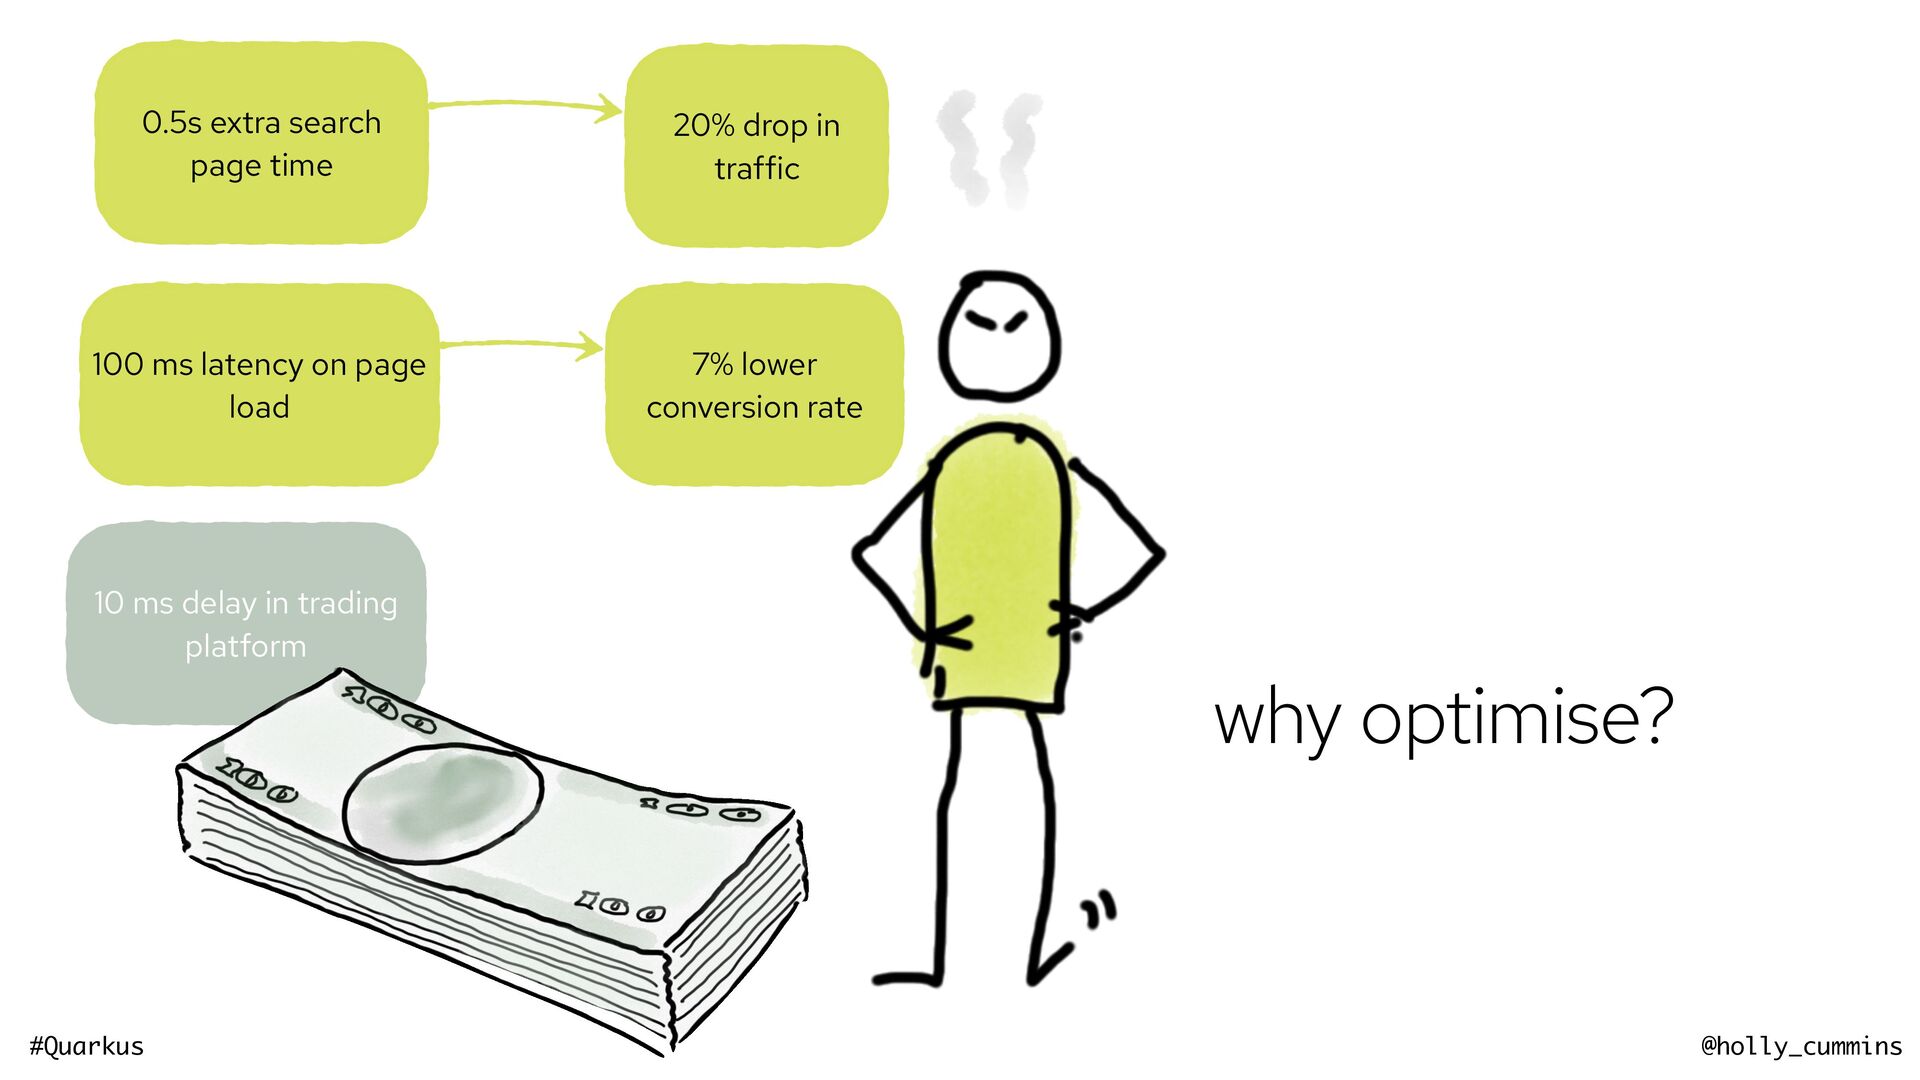
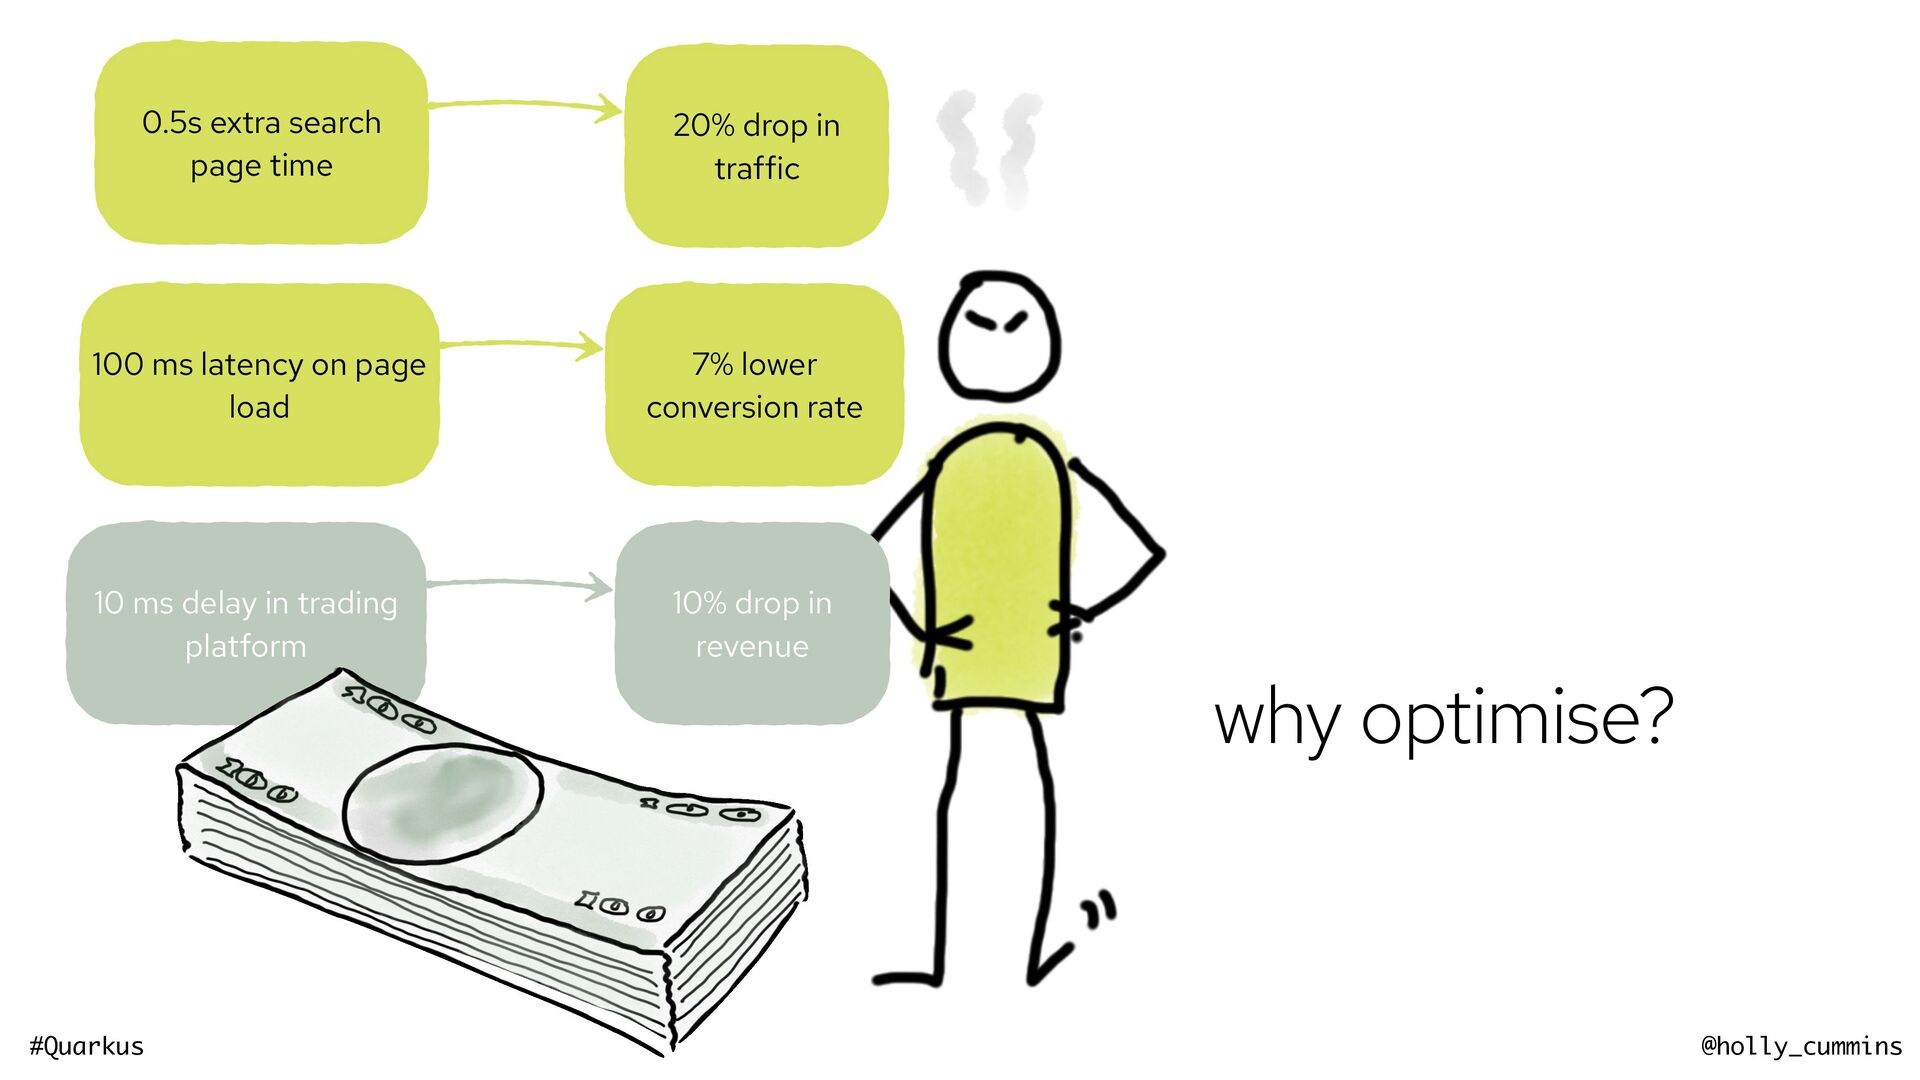
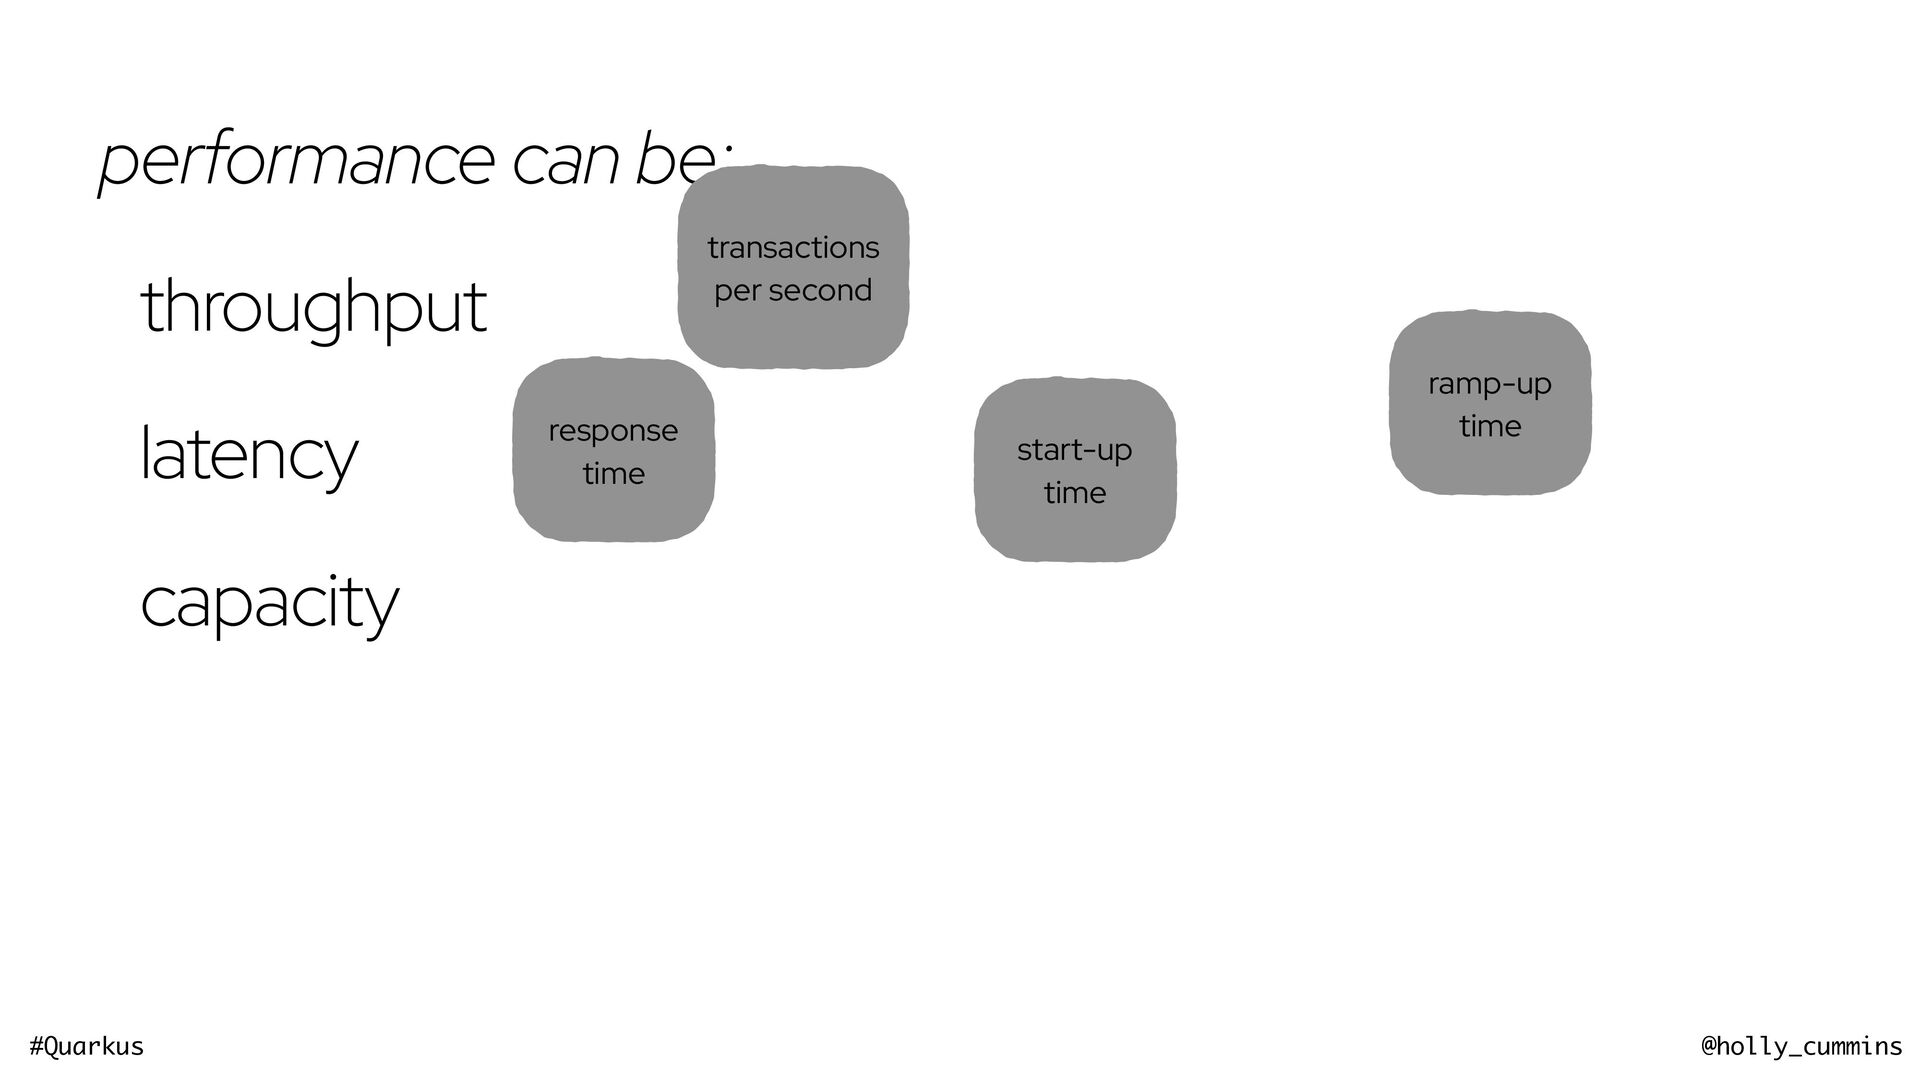
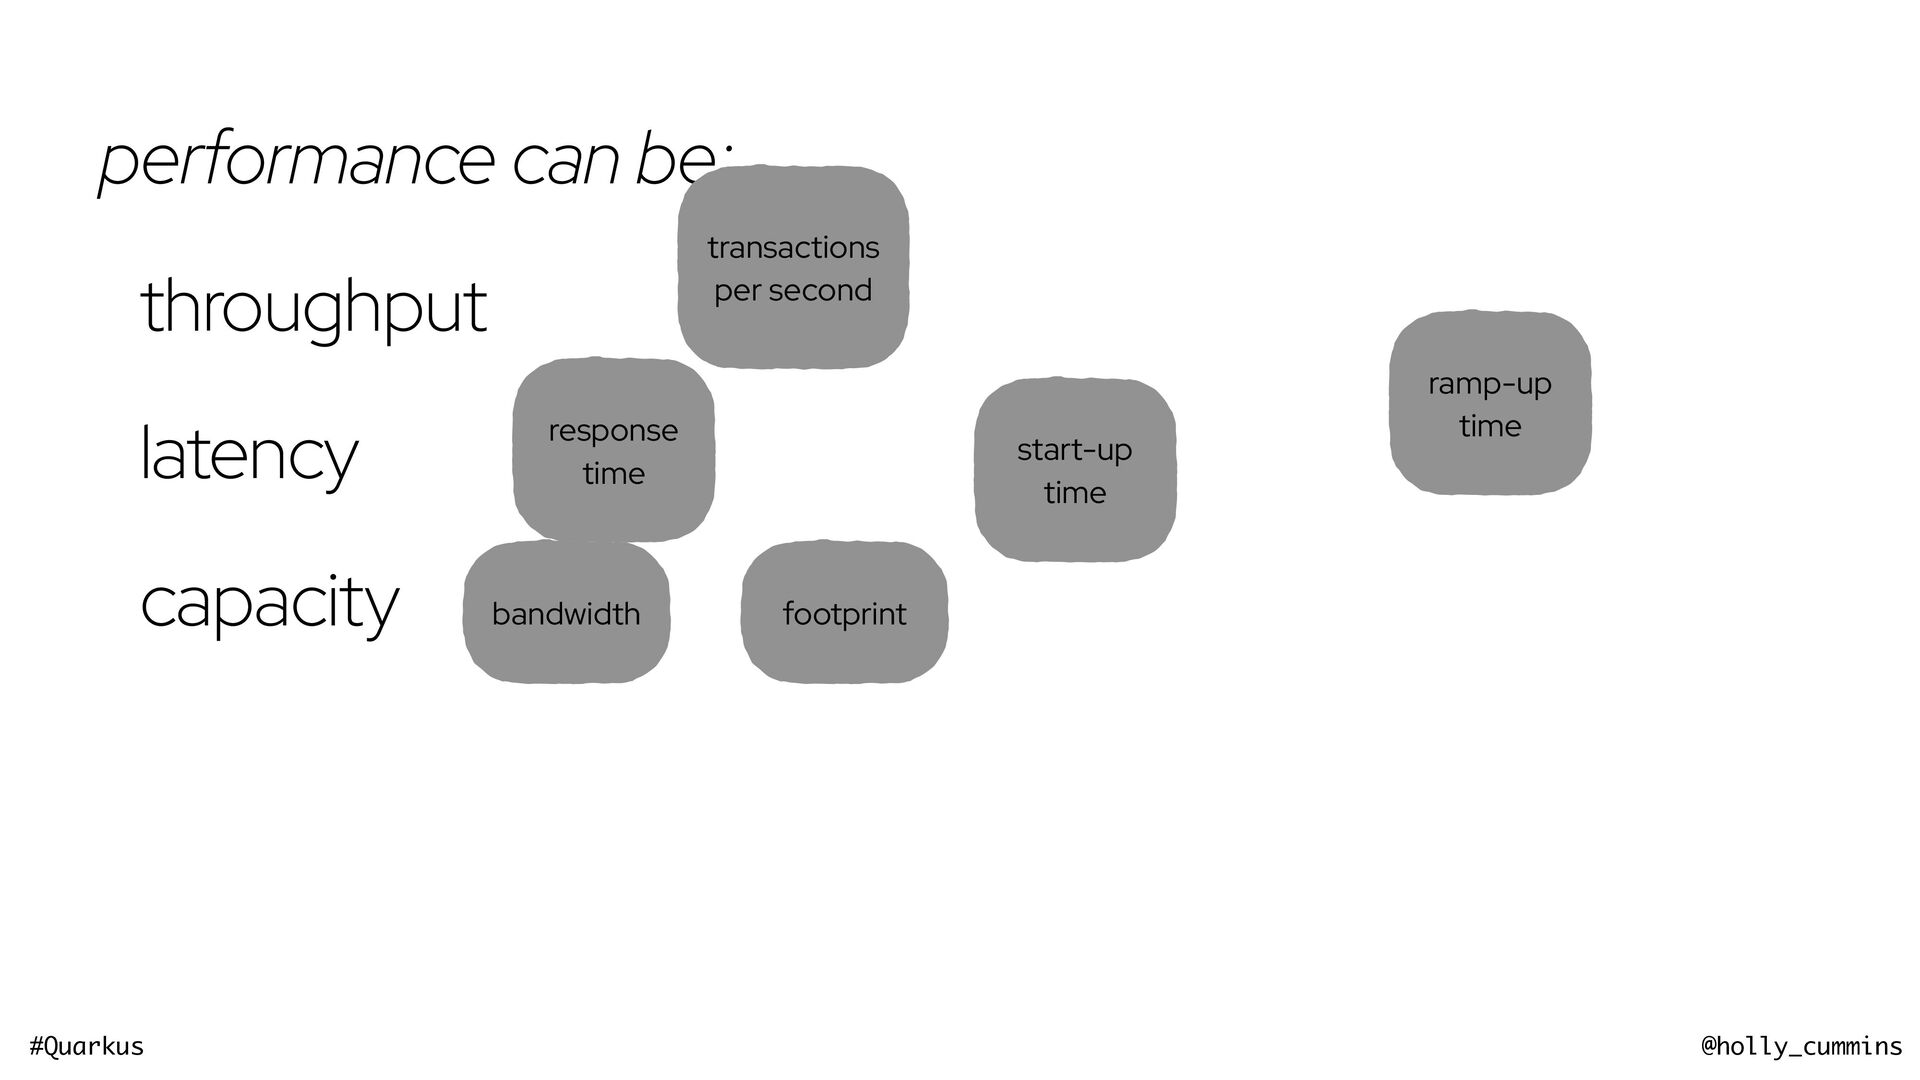
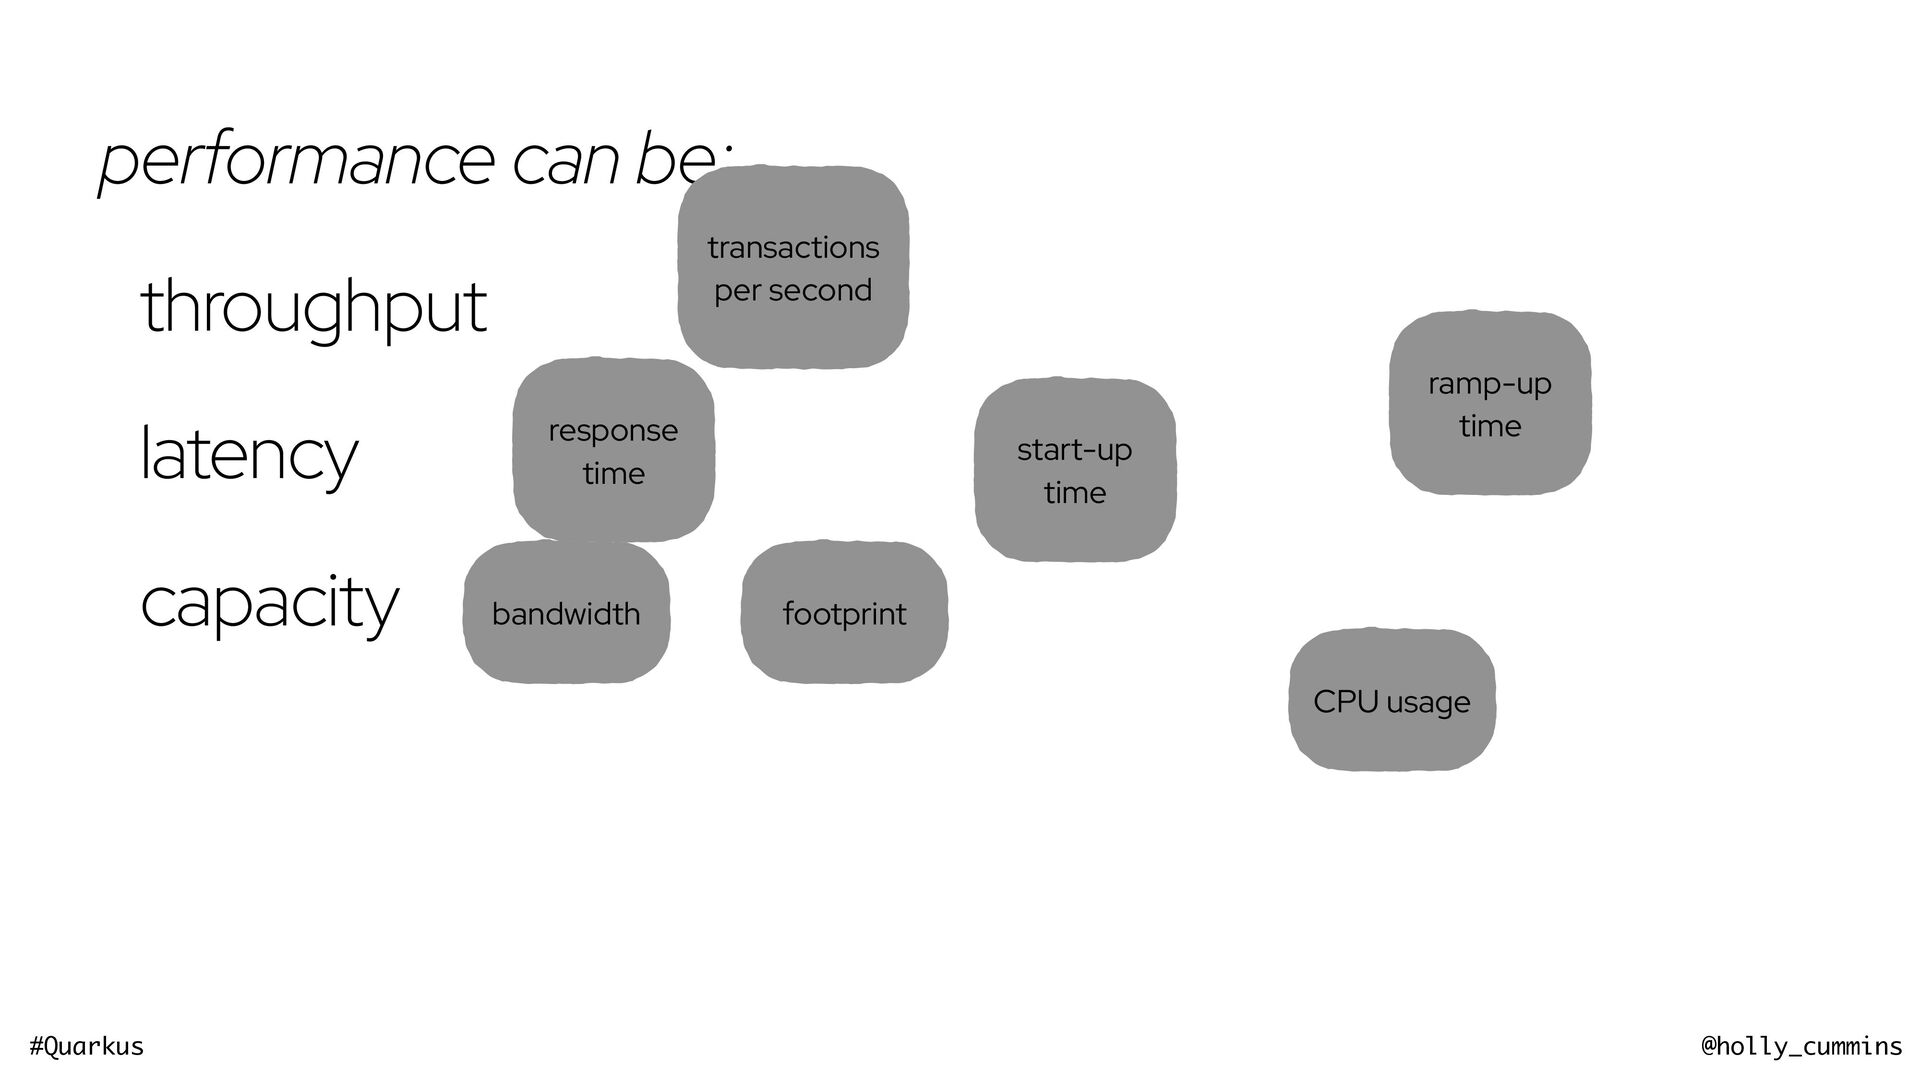
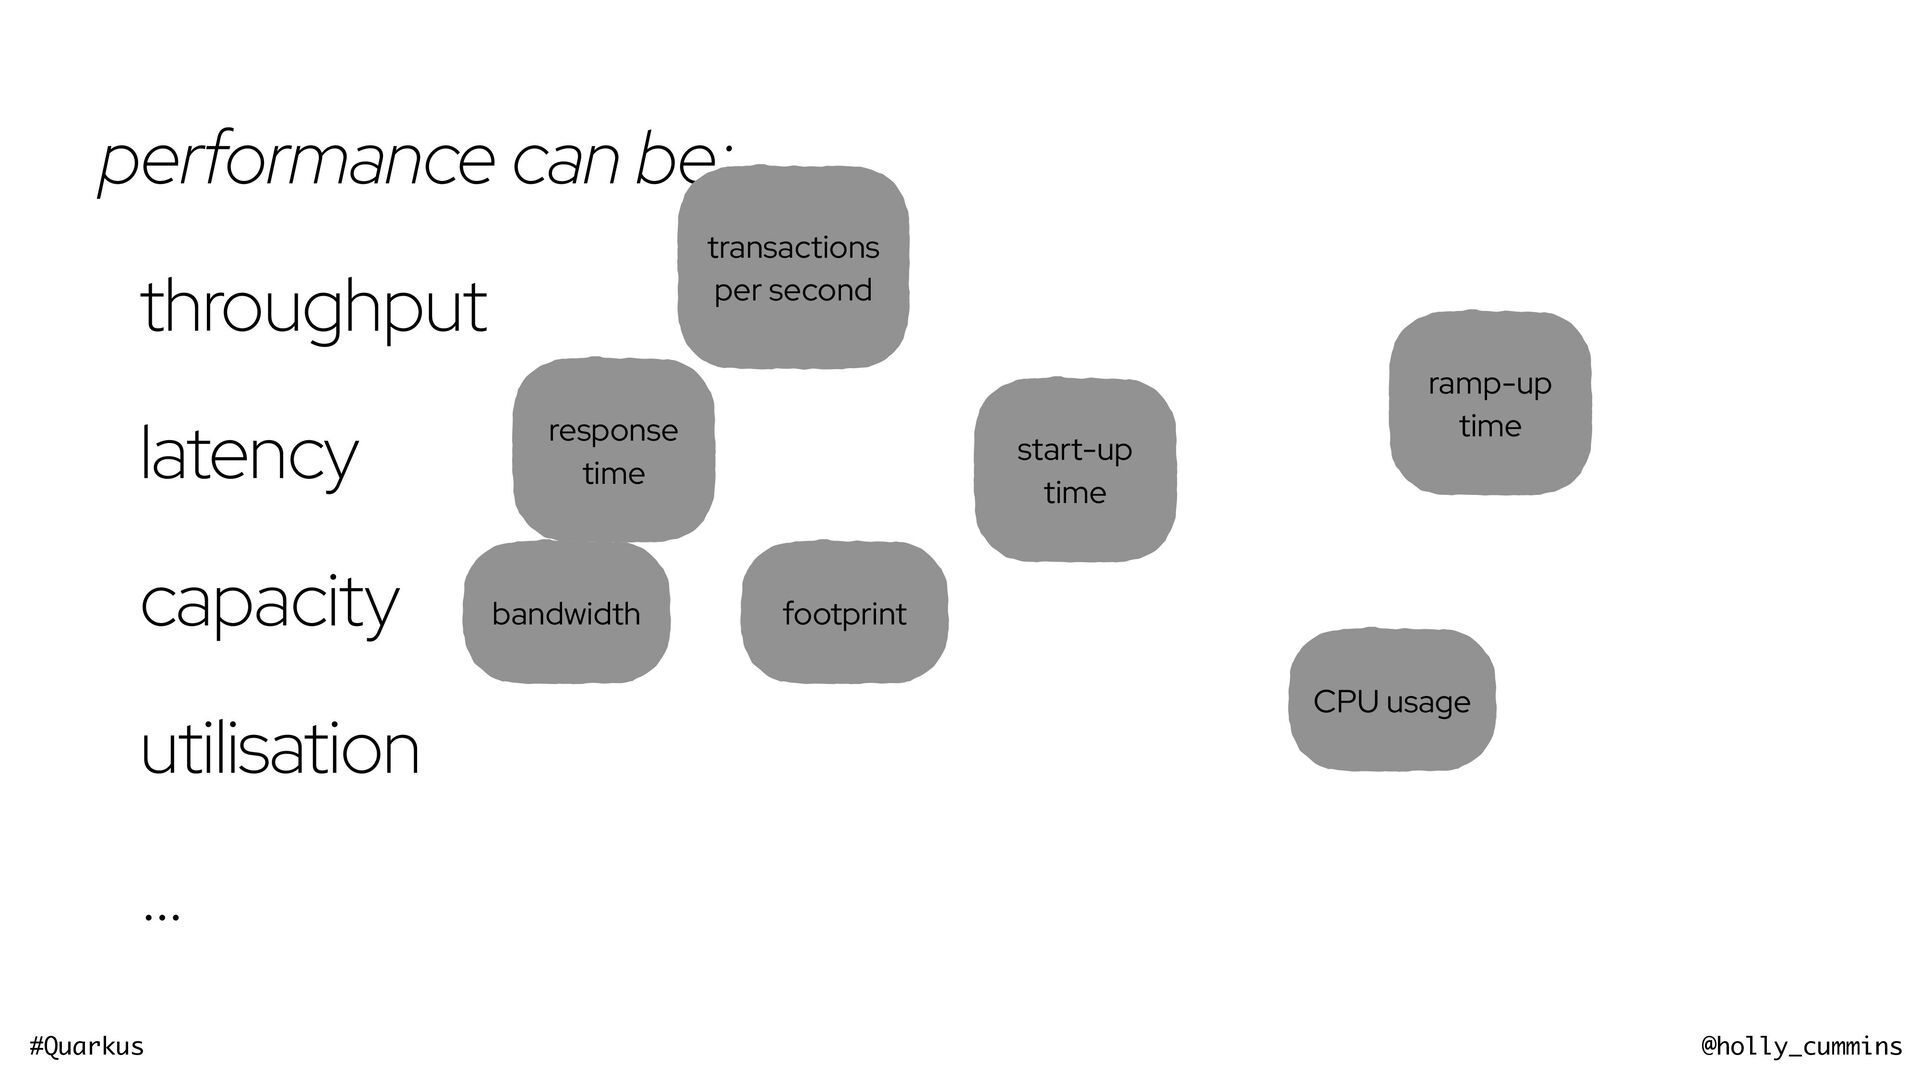
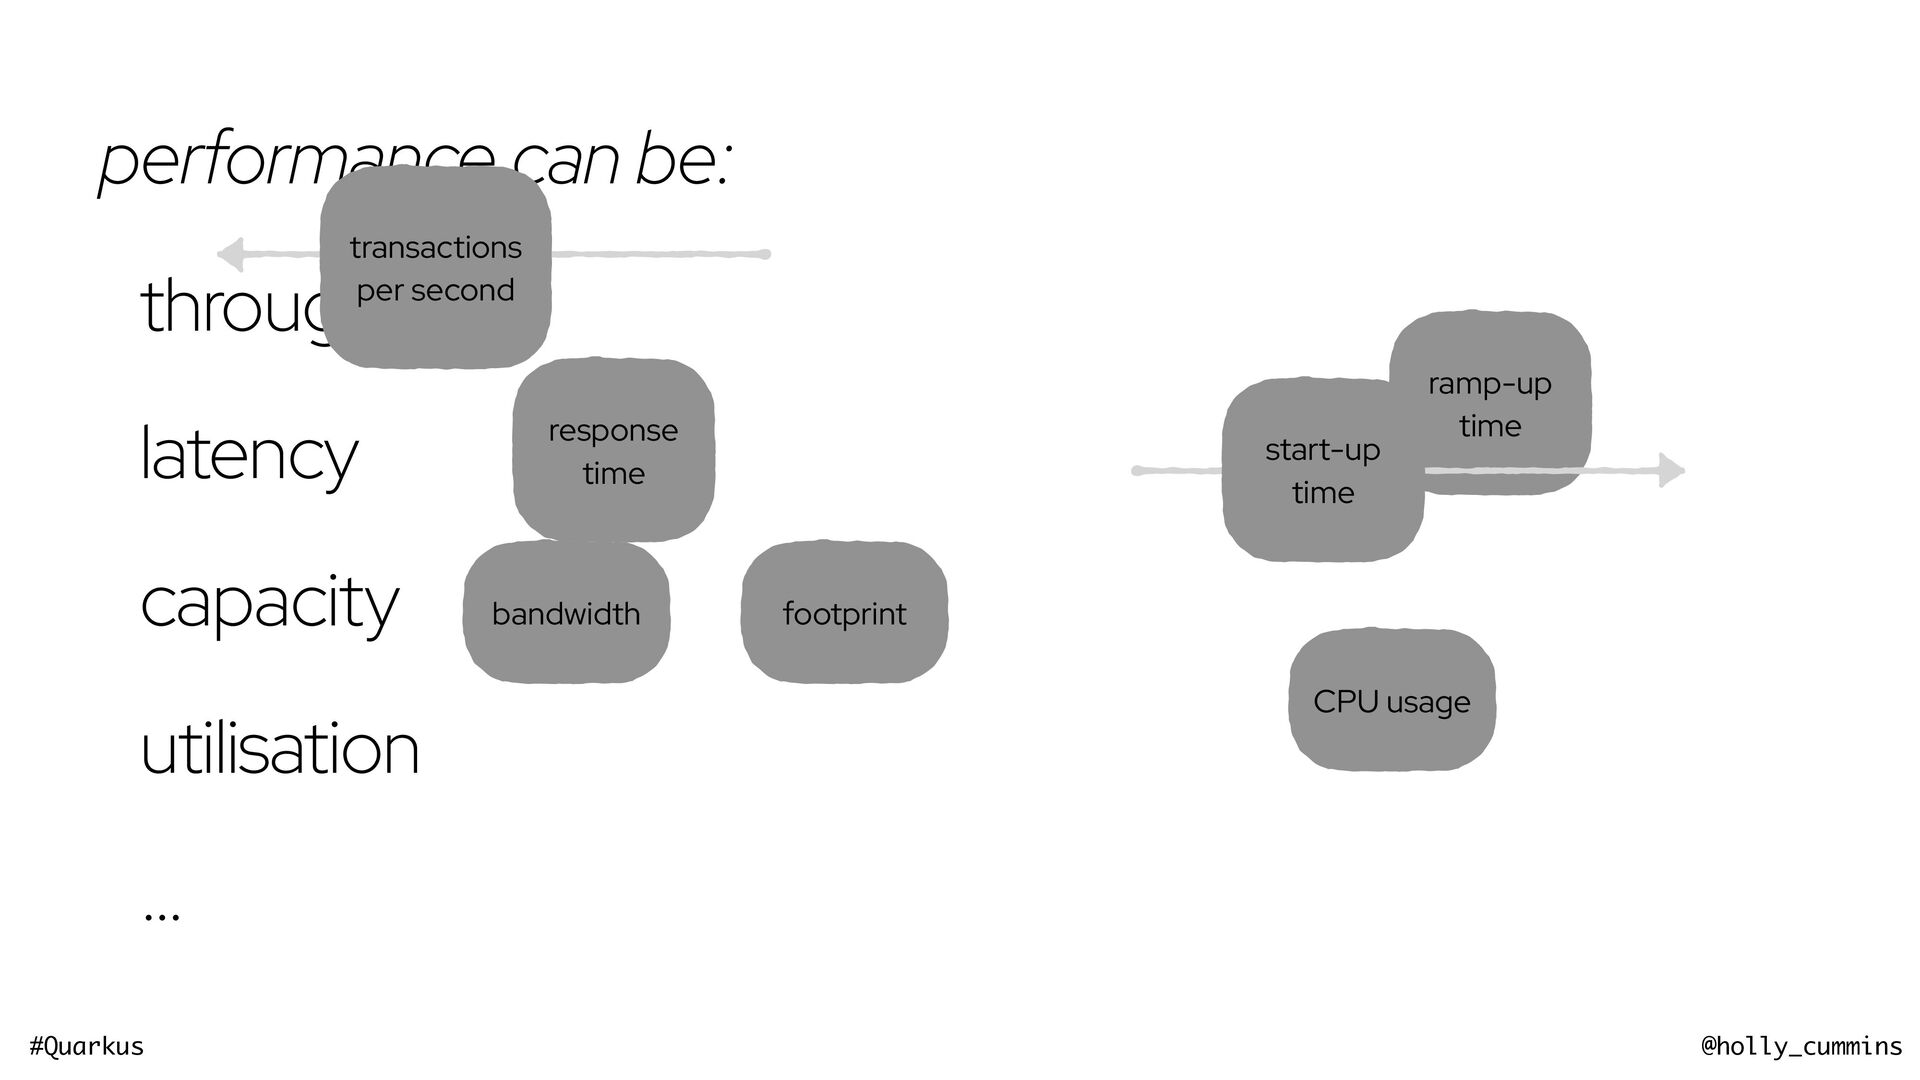
Welcome to the Java optimisation jungle. Why can’t we “just make it go faster”? It turns out, in most cases, we need to first work out “faster for whom?” and “why do we want to go faster?” and “what even *is* faster?” This talk introduces the basic principles of optimisation, before bouncing through the pitfalls of optimisation; why the exact same techniques which make Quarkus rocket-fast used to be a terrible idea fifteen years ago, why fast benchmarks make for slow programs, and why even though it can be easy to get wrong, optimisation really really matters. Along the way we’ll talk about measuring things, bad advice, garbage collection, and climate change.
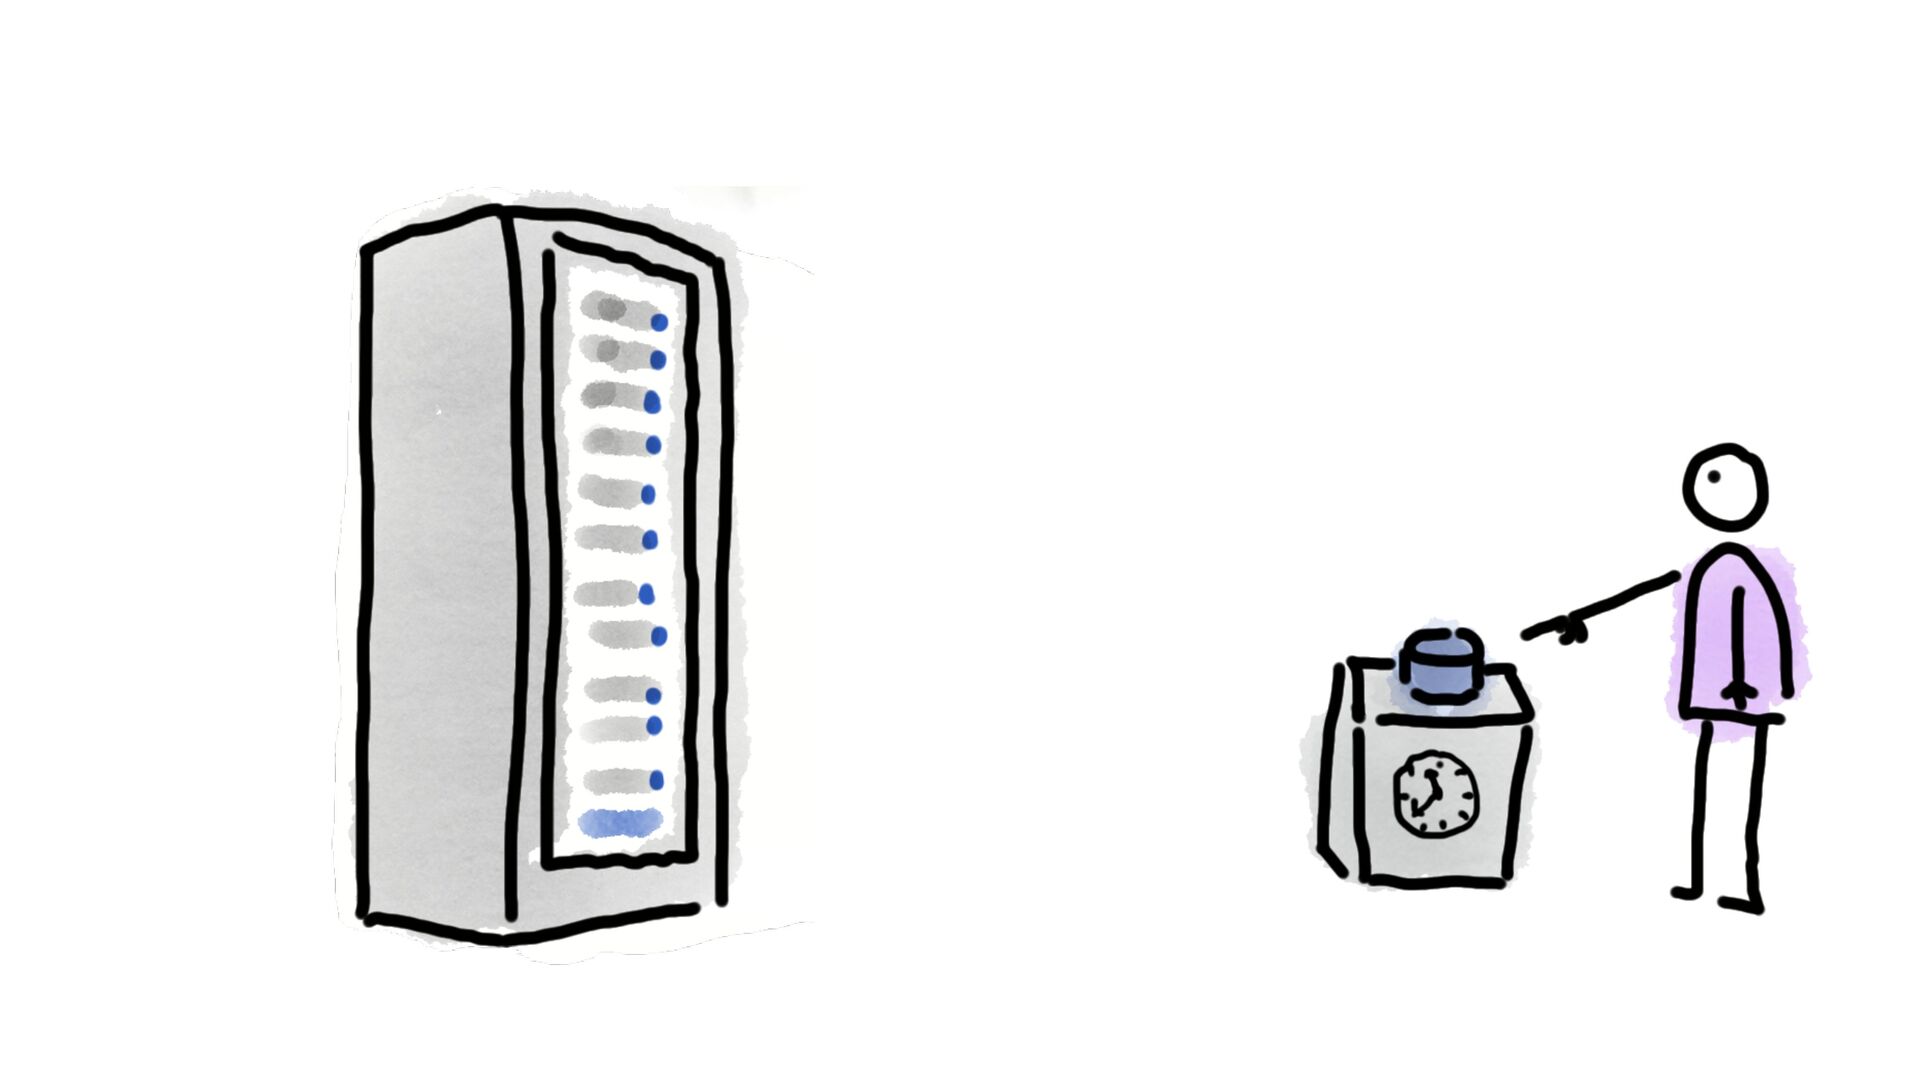
![#Quarkus @holly_cummins Never underestimate the bandwidth [throughput] of a station](https://files.speakerdeck.com/presentations/5734caeee7bc437fb86f5dc87ea8c8f0/slide_28.jpg)
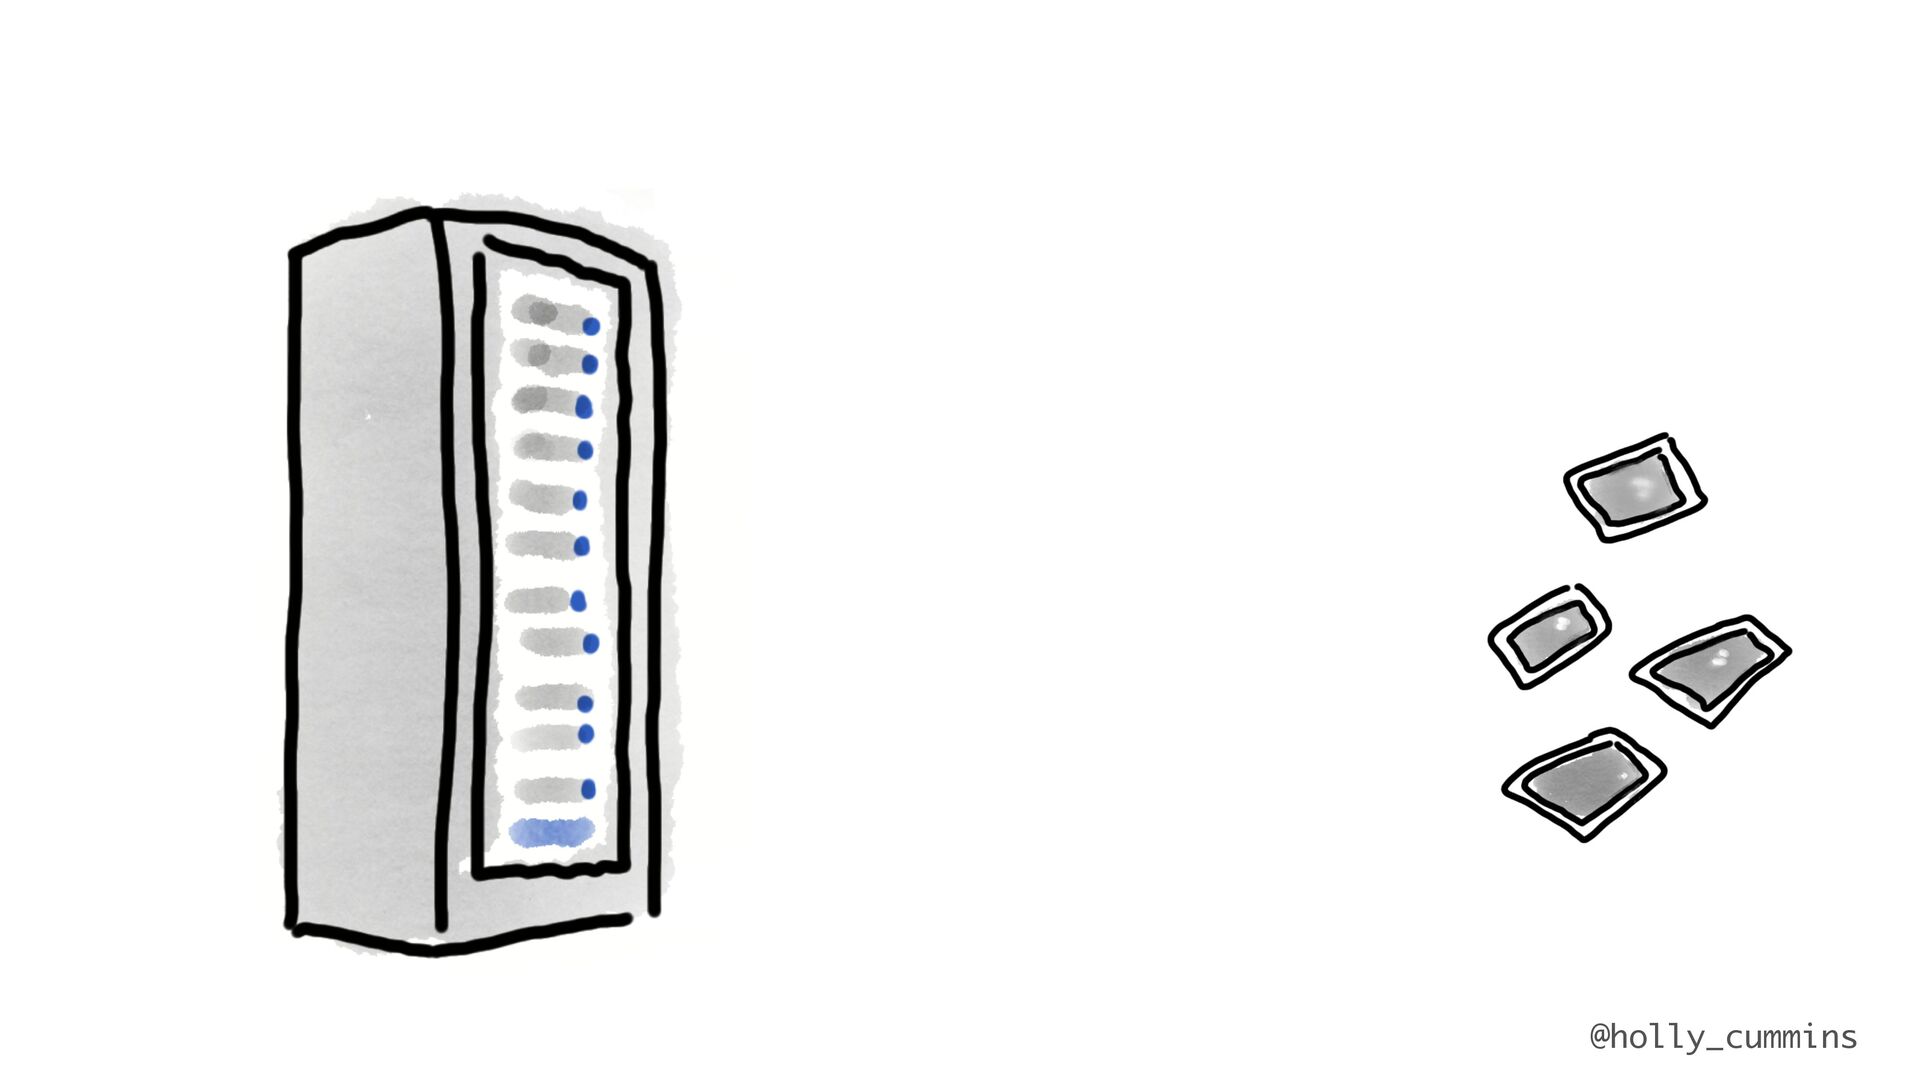
![#Quarkus @holly_cummins Never underestimate the bandwidth [throughput] of a station](https://files.speakerdeck.com/presentations/5734caeee7bc437fb86f5dc87ea8c8f0/slide_29.jpg)