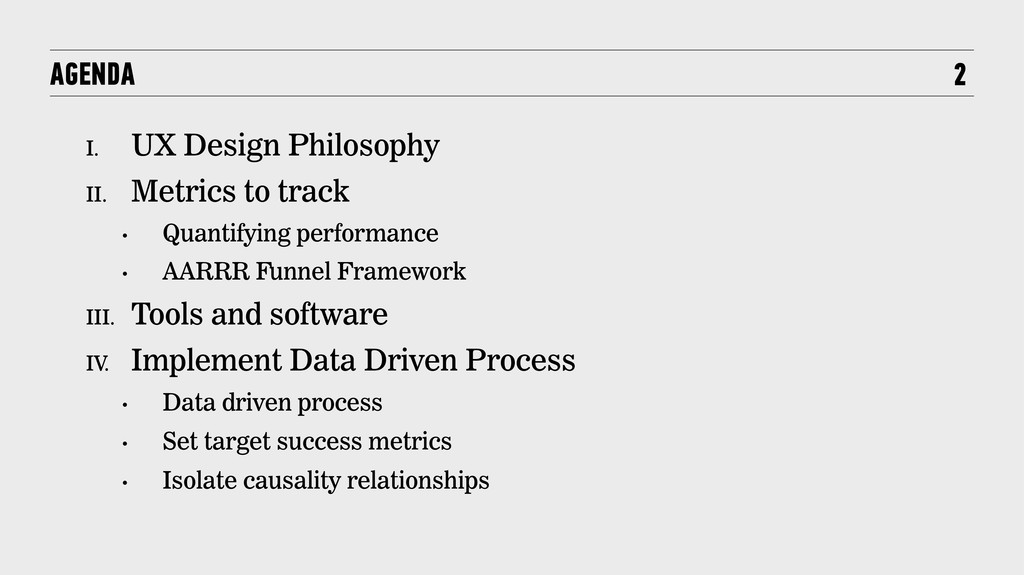
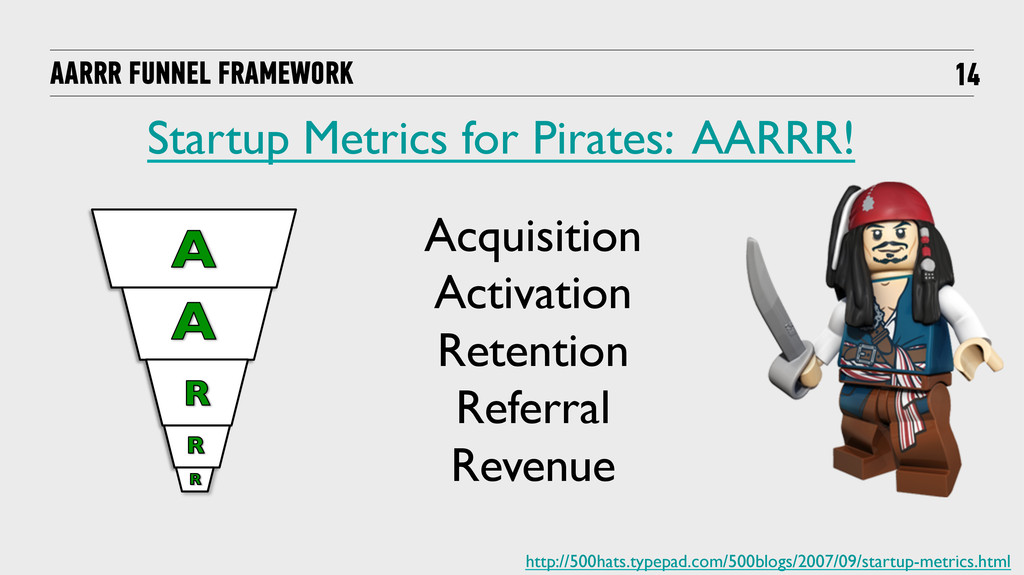
• Quantifying performance • AARRR Funnel Framework III. Tools and software IV. Implement Data Driven Process • Data driven process • Set target success metrics • Isolate causality relationships
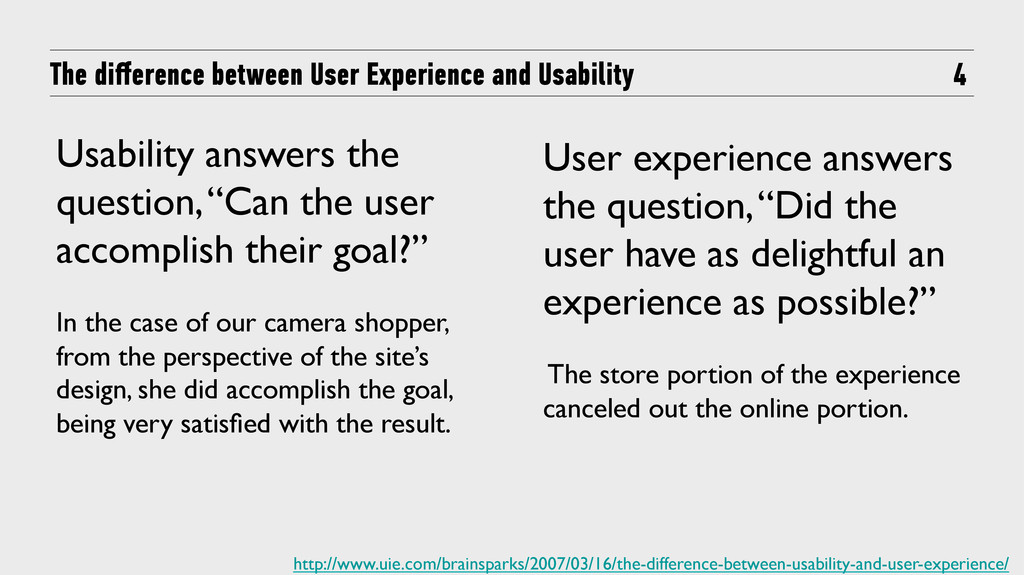
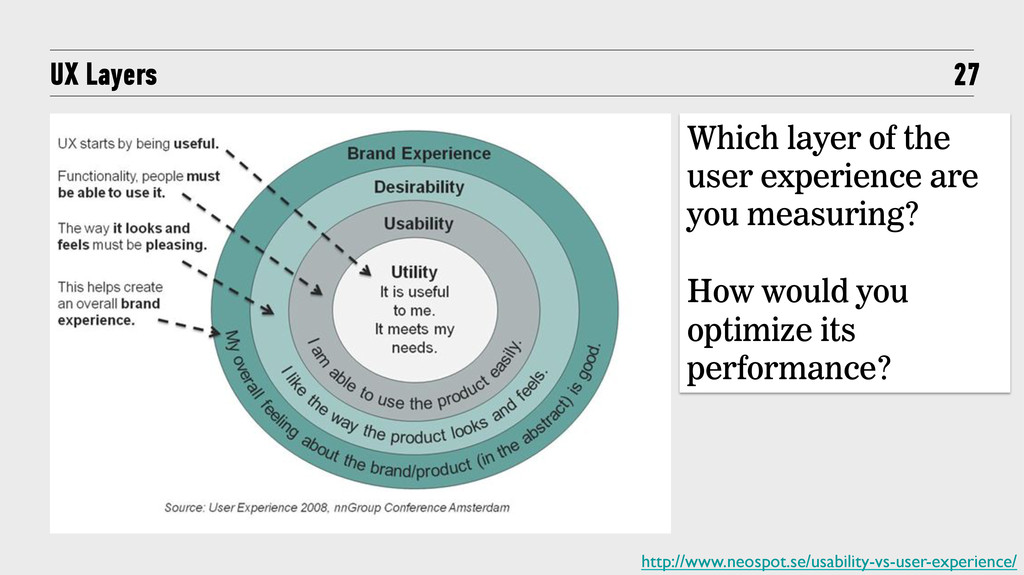
answers the question, “Can the user accomplish their goal?” In the case of our camera shopper, from the perspective of the site’s design, she did accomplish the goal, being very satisfied with the result. User experience answers the question, “Did the user have as delightful an experience as possible?” The store portion of the experience canceled out the online portion.
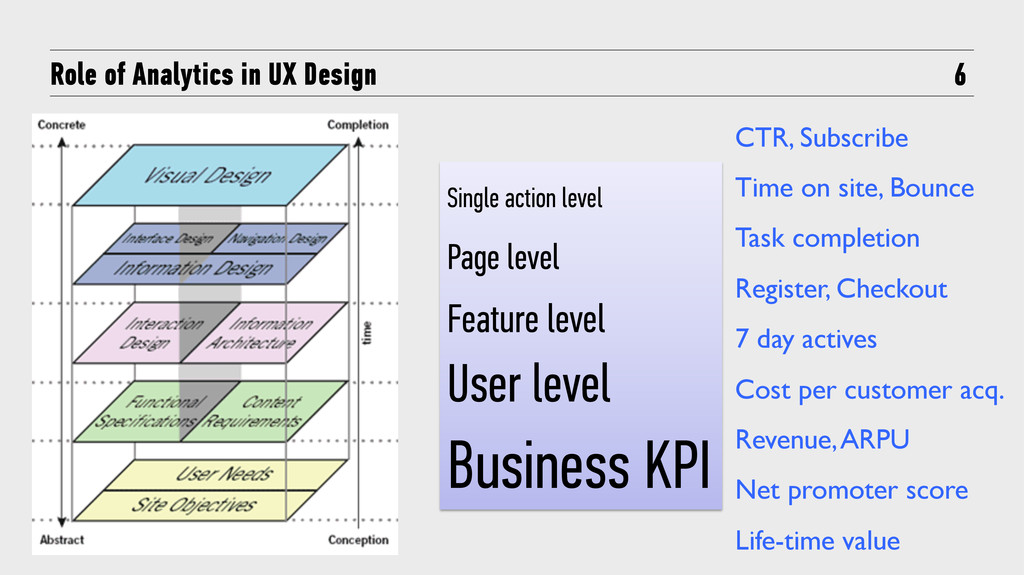
Page level Feature level User level Business KPI CTR, Subscribe Time on site, Bounce Task completion Register, Checkout 7 day actives Cost per customer acq. Revenue, ARPU Net promoter score Life-time value
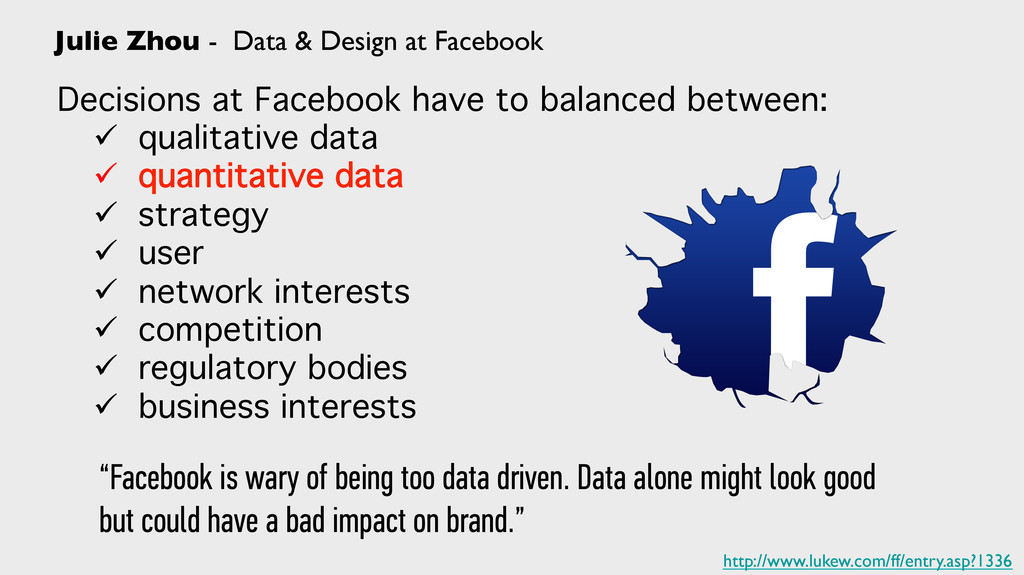
at Facebook have to balanced between: ! ü qualitative data ! ü quantitative data ! ü strategy! ü user! ü network interests! ü competition! ü regulatory bodies! ü business interests! “Facebook is wary of being too data driven. Data alone might look good but could have a bad impact on brand.”
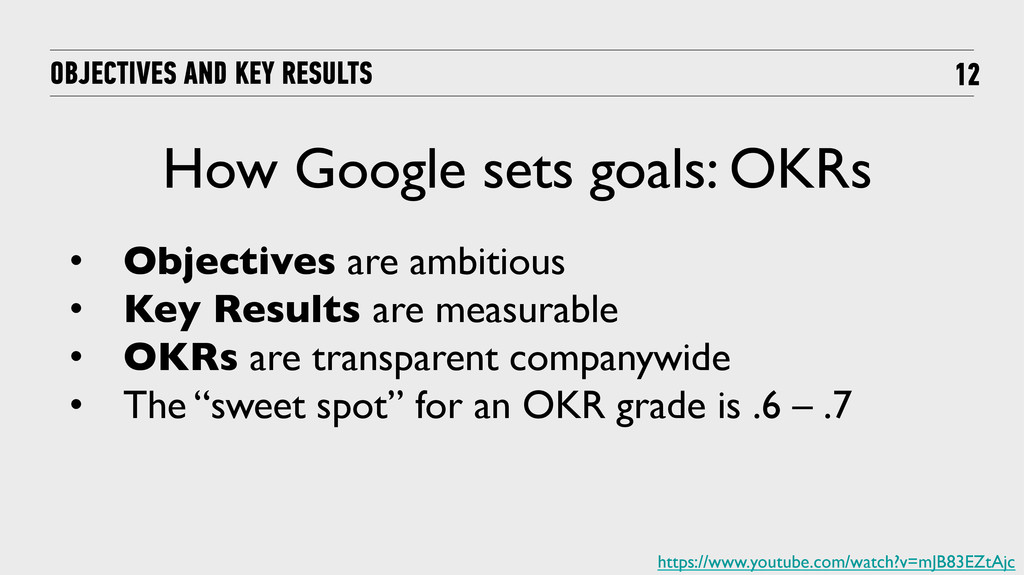
• Objectives are ambitious • Key Results are measurable • OKRs are transparent companywide • The “sweet spot” for an OKR grade is .6 – .7 https://www.youtube.com/watch?v=mJB83EZtAjc
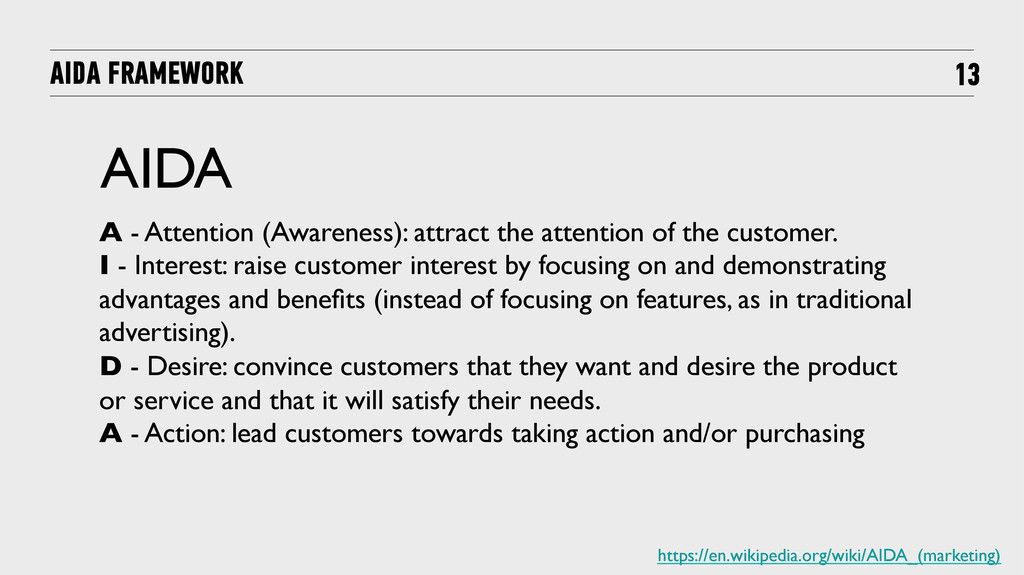
of the customer. I - Interest: raise customer interest by focusing on and demonstrating advantages and benefits (instead of focusing on features, as in traditional advertising). D - Desire: convince customers that they want and desire the product or service and that it will satisfy their needs. A - Action: lead customers towards taking action and/or purchasing https://en.wikipedia.org/wiki/AIDA_(marketing) AIDA
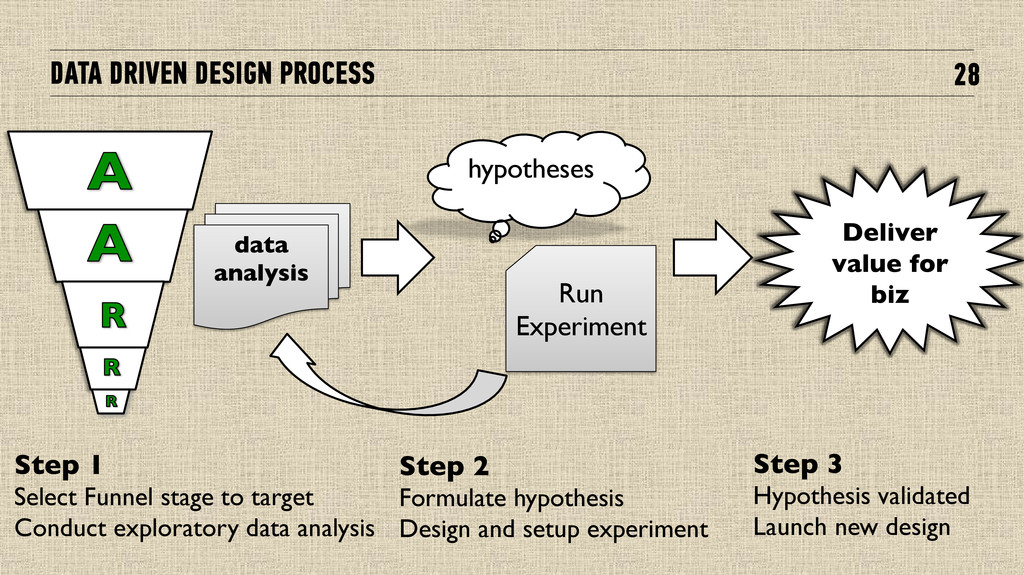
value for biz hypotheses Step 1 Select Funnel stage to target Conduct exploratory data analysis Step 2 Formulate hypothesis Design and setup experiment Step 3 Hypothesis validated Launch new design
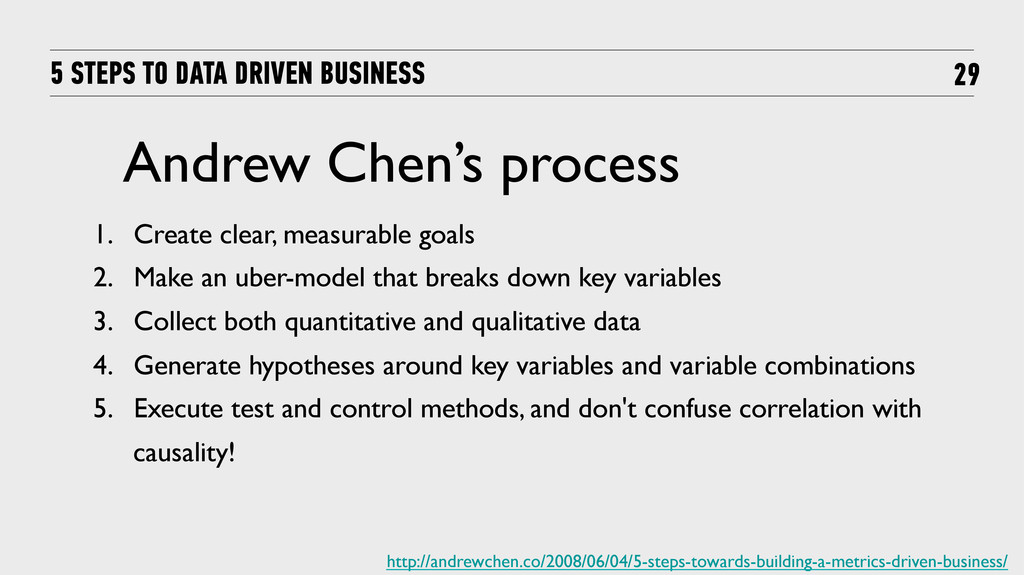
measurable goals 2. Make an uber-model that breaks down key variables 3. Collect both quantitative and qualitative data 4. Generate hypotheses around key variables and variable combinations 5. Execute test and control methods, and don't confuse correlation with causality! http://andrewchen.co/2008/06/04/5-steps-towards-building-a-metrics-driven-business/ Andrew Chen’s process
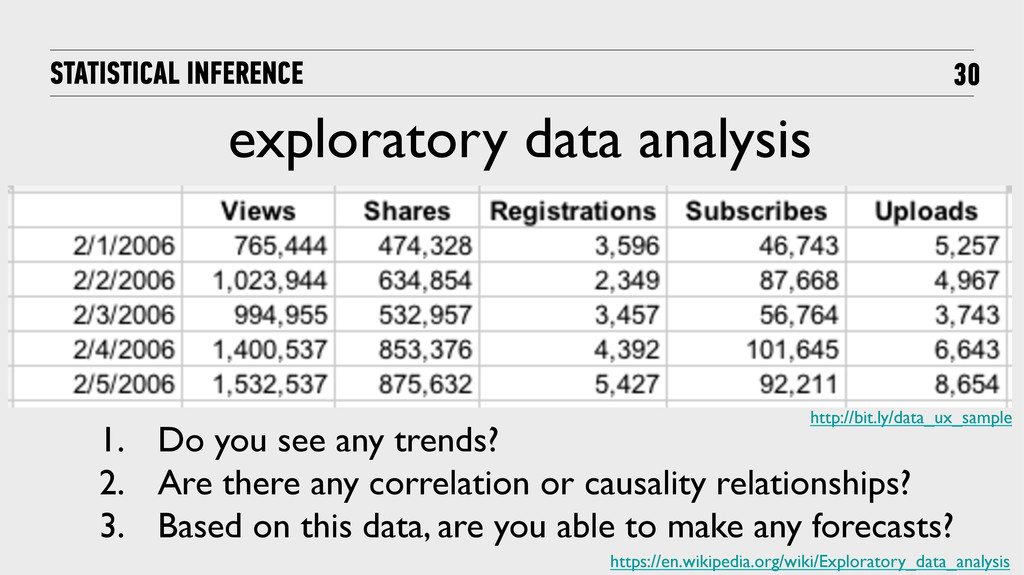
see any trends? 2. Are there any correlation or causality relationships? 3. Based on this data, are you able to make any forecasts? http://bit.ly/data_ux_sample
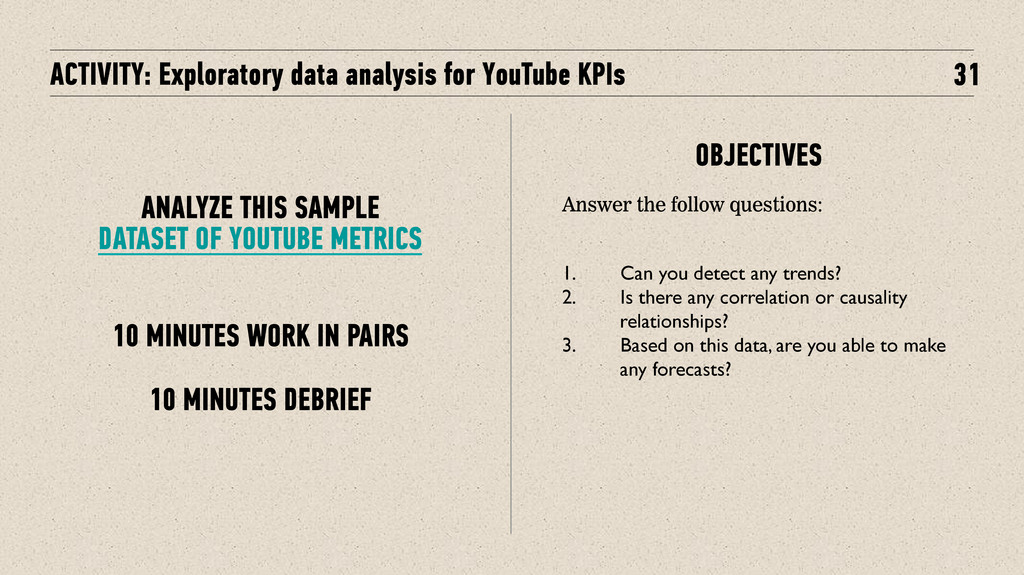
SAMPLE DATASET OF YOUTUBE METRICS 10 MINUTES WORK IN PAIRS 10 MINUTES DEBRIEF Answer the follow questions: 1. Can you detect any trends? 2. Is there any correlation or causality relationships? 3. Based on this data, are you able to make any forecasts? OBJECTIVES
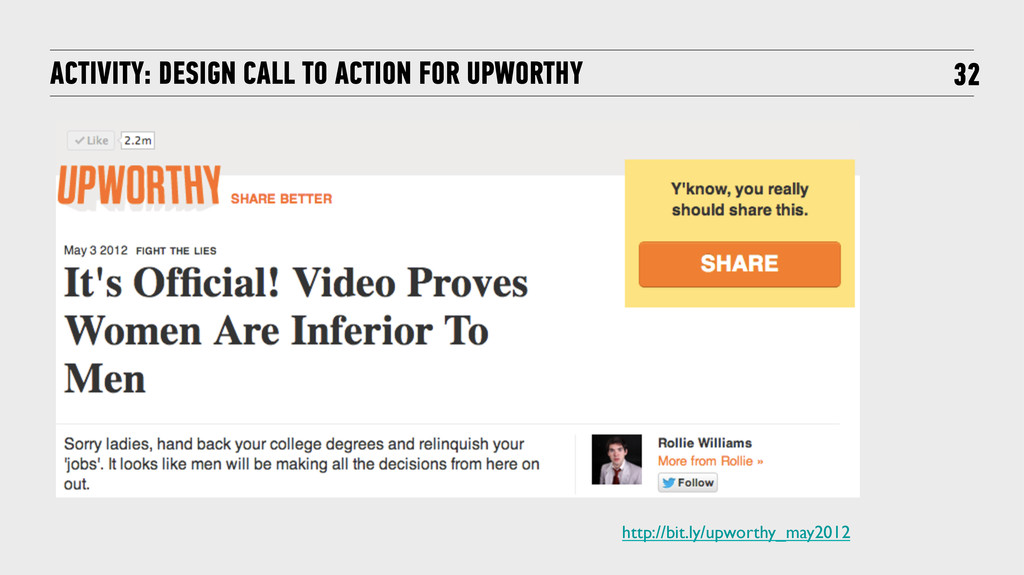
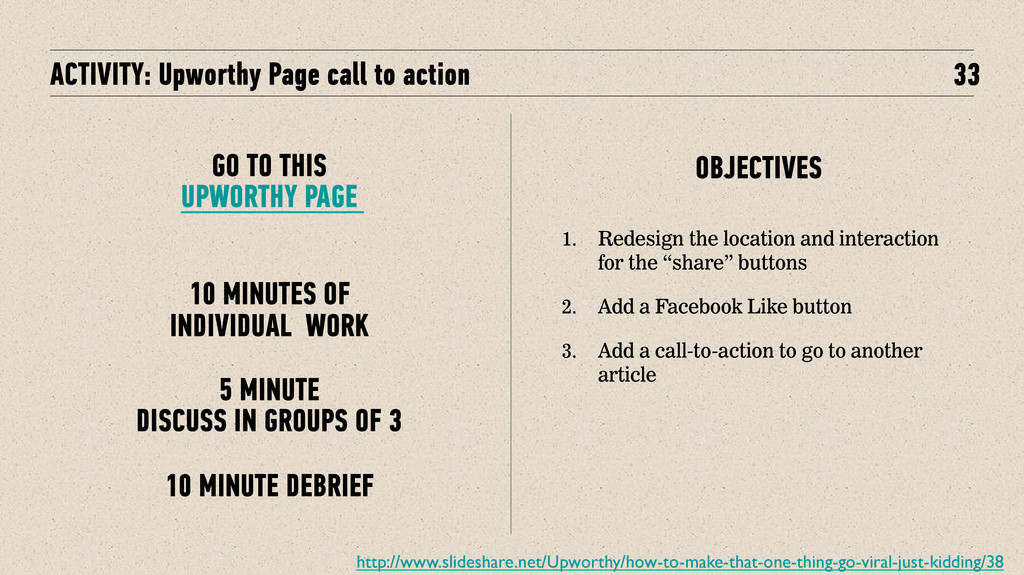
UPWORTHY PAGE 10 MINUTES OF INDIVIDUAL WORK 5 MINUTE DISCUSS IN GROUPS OF 3 10 MINUTE DEBRIEF 1. Redesign the location and interaction for the “share” buttons 2. Add a Facebook Like button 3. Add a call-to-action to go to another article OBJECTIVES http://www.slideshare.net/Upworthy/how-to-make-that-one-thing-go-viral-just-kidding/38