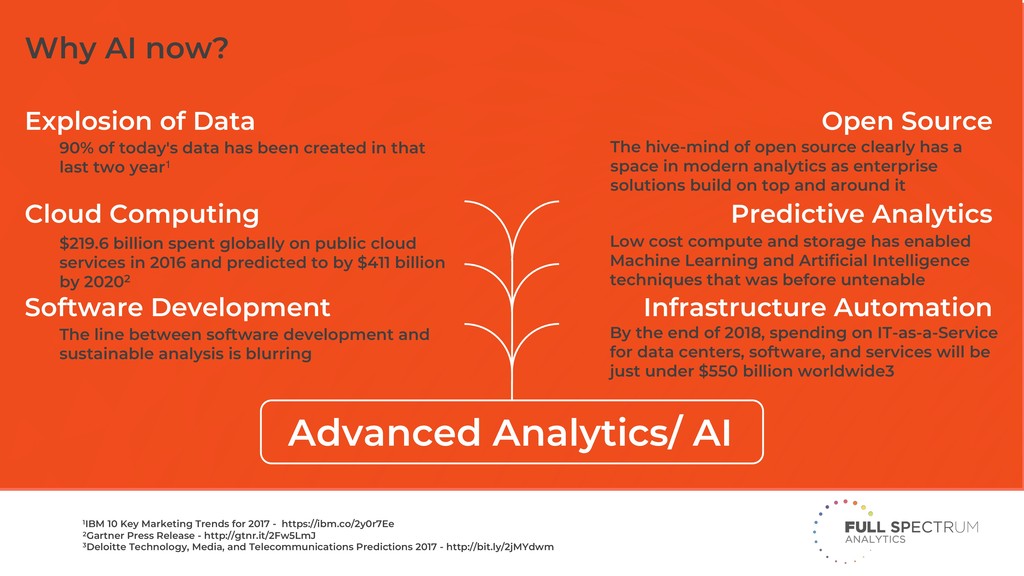
Computing Software Development Predictive Analytics Open Source Infrastructure Automation 90% of today's data has been created in that last two year1 $219.6 billion spent globally on public cloud services in 2016 and predicted to by $411 billion by 20202 The line between software development and sustainable analysis is blurring The hive-mind of open source clearly has a space in modern analytics as enterprise solutions build on top and around it Low cost compute and storage has enabled Machine Learning and Artificial Intelligence techniques that was before untenable By the end of 2018, spending on IT-as-a-Service for data centers, software, and services will be just under $550 billion worldwide3 1IBM 10 Key Marketing Trends for 2017 - https://ibm.co/2y0r7Ee 2Gartner Press Release - http://gtnr.it/2Fw5LmJ 3Deloitte Technology, Media, and Telecommunications Predictions 2017 - http://bit.ly/2jMYdwm
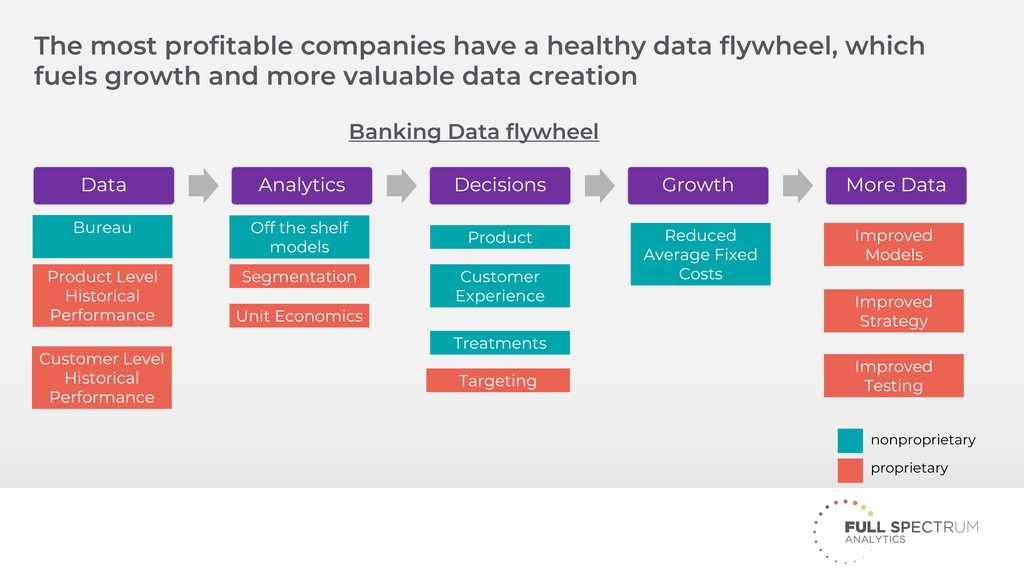
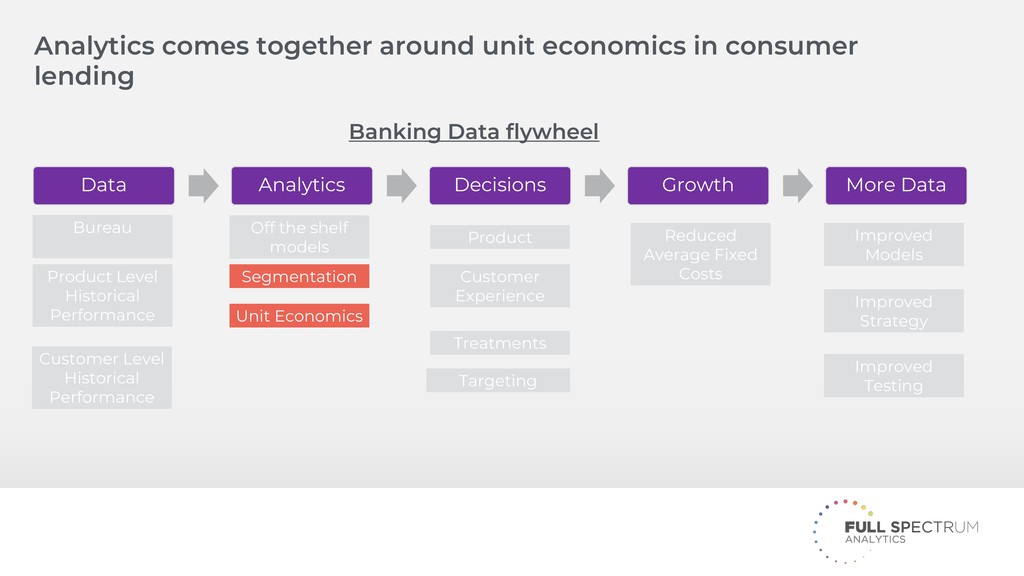
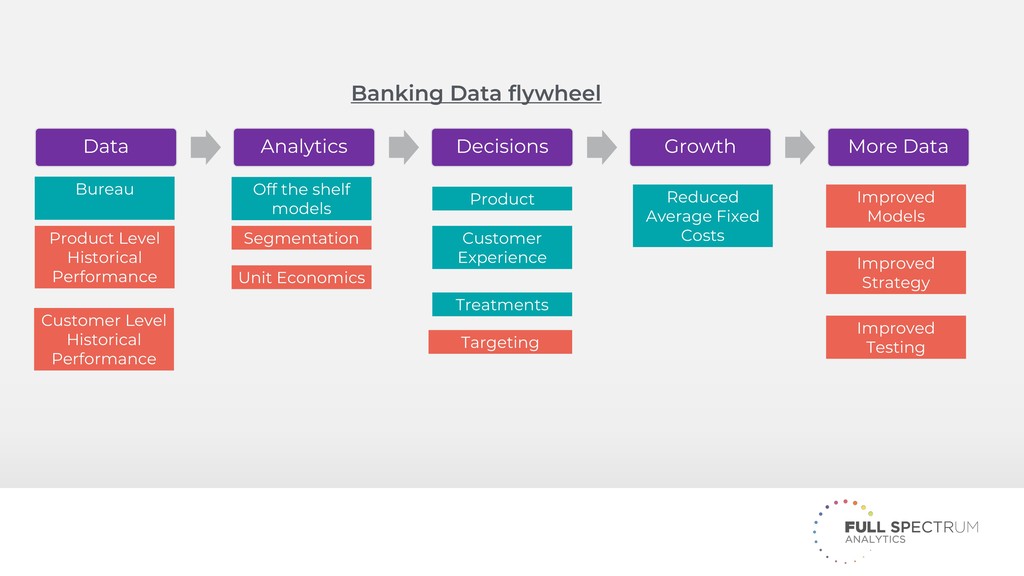
fuels growth and more valuable data creation Product Segmentation Bureau Product Level Historical Performance Customer Level Historical Performance Targeting Unit Economics Data Analytics Decisions Growth More Data Off the shelf models Treatments Reduced Average Fixed Costs Improved Models Improved Strategy Customer Experience Banking Data flywheel Improved Testing nonproprietary proprietary
Segmentation Bureau Product Level Historical Performance Customer Level Historical Performance Targeting Unit Economics Data Analytics Decisions Growth More Data Off the shelf models Treatments Reduced Average Fixed Costs Improved Models Improved Strategy Customer Experience Banking Data flywheel Improved Testing
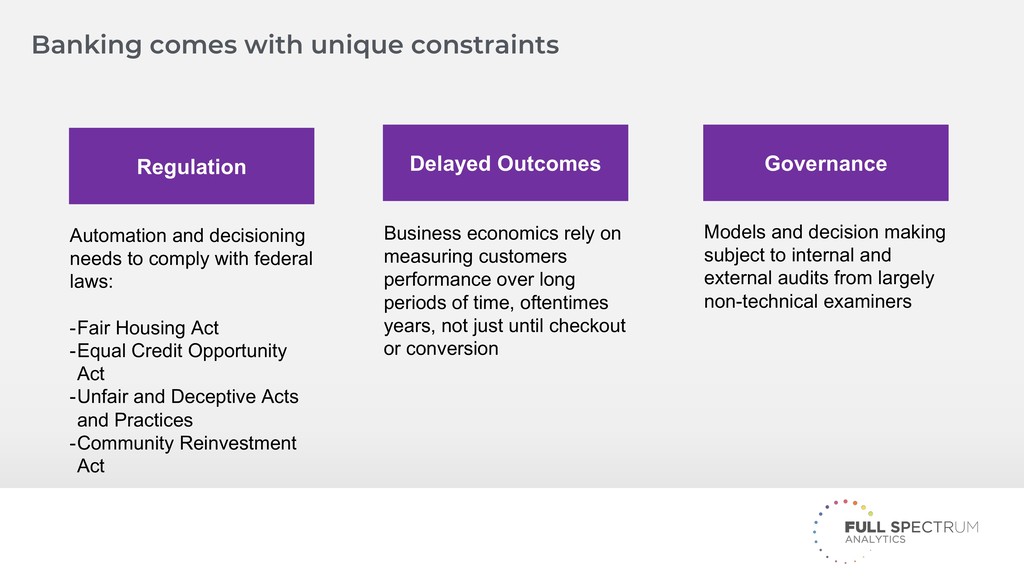
and decisioning needs to comply with federal laws: -Fair Housing Act -Equal Credit Opportunity Act -Unfair and Deceptive Acts and Practices -Community Reinvestment Act Business economics rely on measuring customers performance over long periods of time, oftentimes years, not just until checkout or conversion Models and decision making subject to internal and external audits from largely non-technical examiners
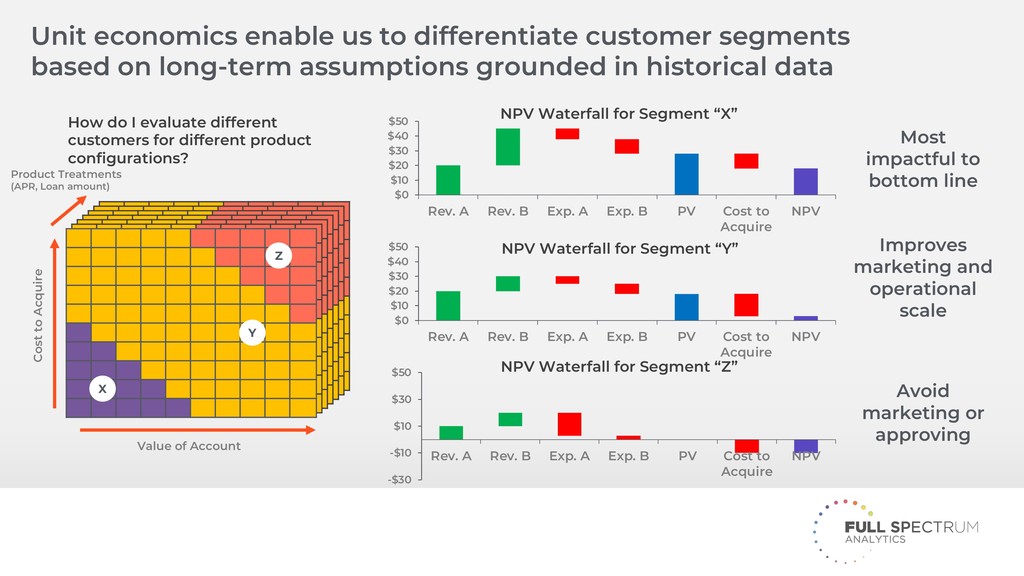
configurations? Cost to Acquire Value of Account Product Treatments (APR, Loan amount) X Z $0 $10 $20 $30 $40 $50 Rev. A Rev. B Exp. A Exp. B PV Cost to Acquire NPV NPV Waterfall for Segment “Y” $0 $10 $20 $30 $40 $50 Rev. A Rev. B Exp. A Exp. B PV Cost to Acquire NPV NPV Waterfall for Segment “X” -$30 -$10 $10 $30 $50 Rev. A Rev. B Exp. A Exp. B PV Cost to Acquire NPV Unit economics enable us to differentiate customer segments based on long-term assumptions grounded in historical data NPV Waterfall for Segment “Z” Most impactful to bottom line Improves marketing and operational scale Avoid marketing or approving
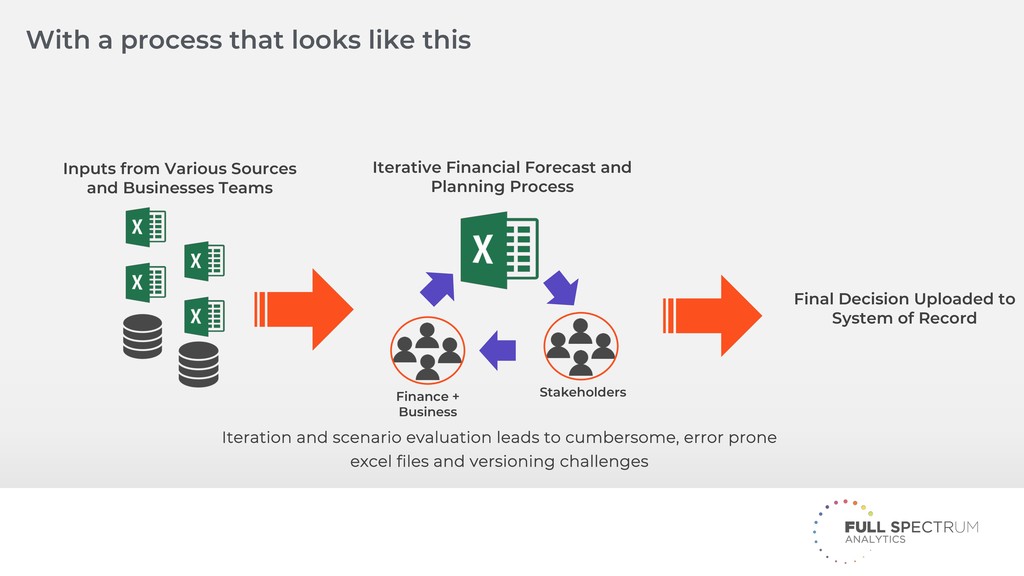
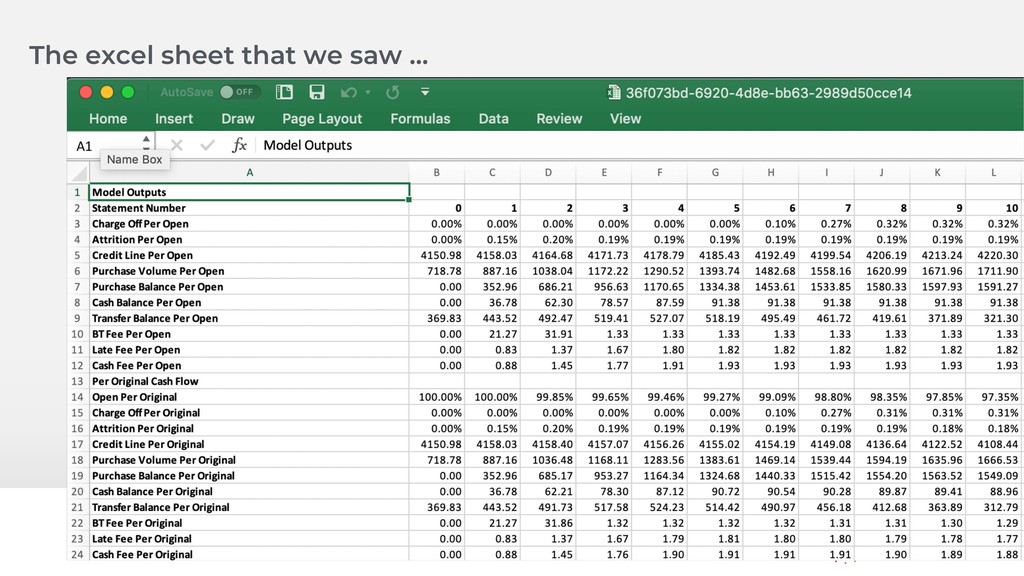
Teams Iterative Financial Forecast and Planning Process Final Decision Uploaded to System of Record Iteration and scenario evaluation leads to cumbersome, error prone excel files and versioning challenges With a process that looks like this
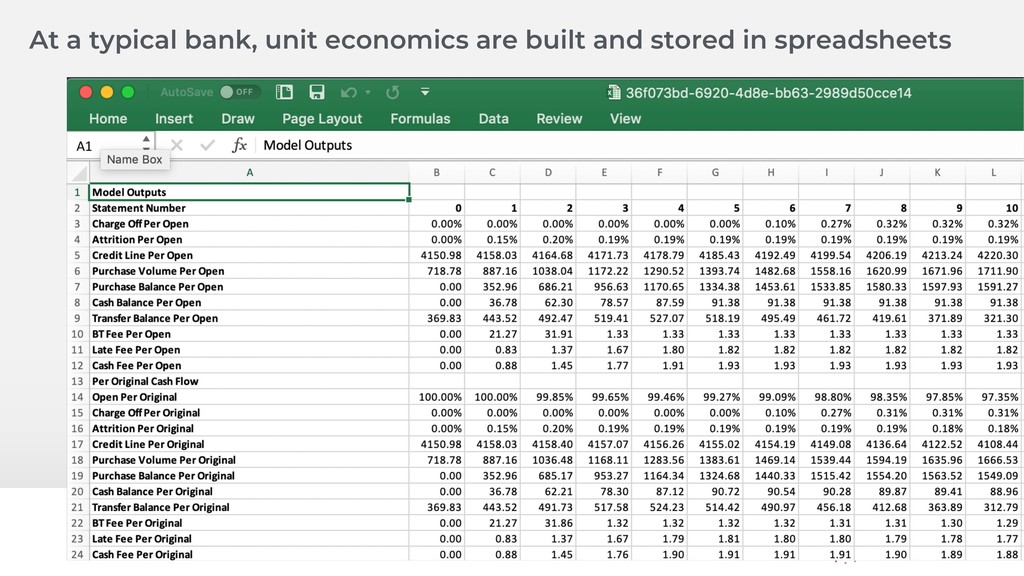
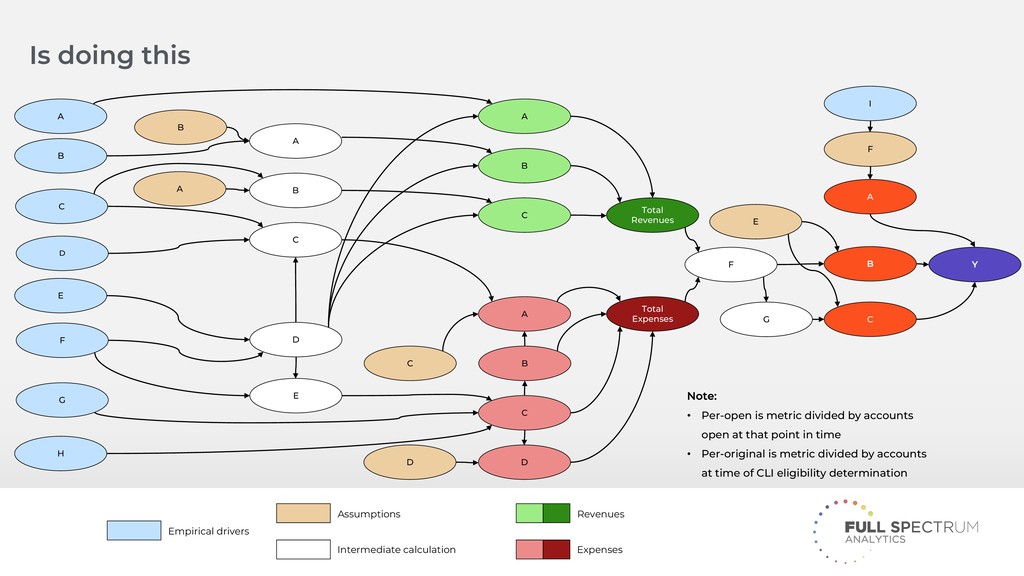
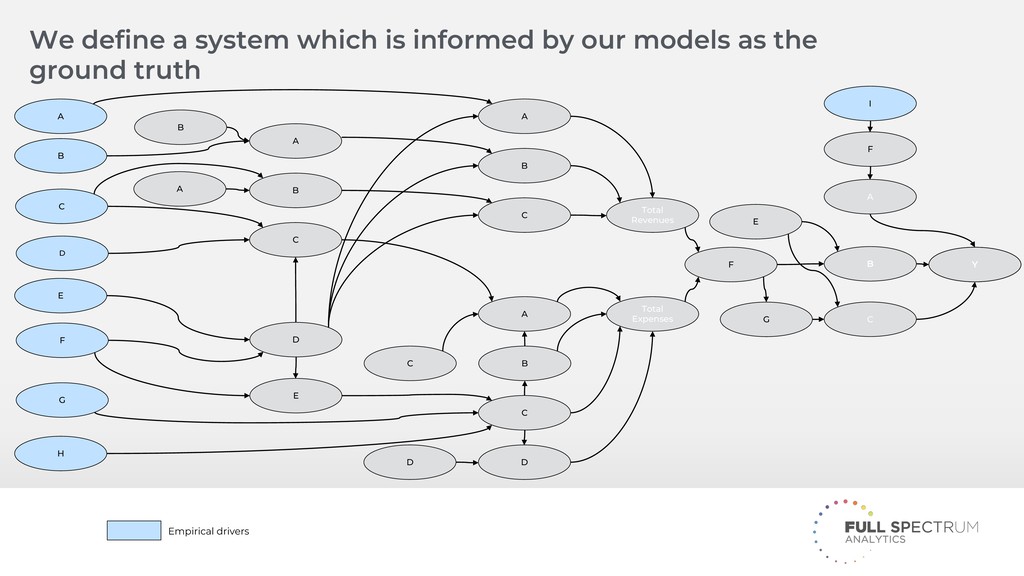
B D F Total Revenues Total Expenses F D A C B C E C D Is doing this E Empirical drivers Assumptions Intermediate calculation Revenues Expenses C Note: • Per-open is metric divided by accounts open at that point in time • Per-original is metric divided by accounts at time of CLI eligibility determination D G A G C I F A Y
Performance Targeting Unit Economics Data Analytics Decisions Growth More Data Off the shelf models Treatments Reduced Average Fixed Costs Improved Models Improved Strategy Customer Experience Banking Data flywheel Improved Testing
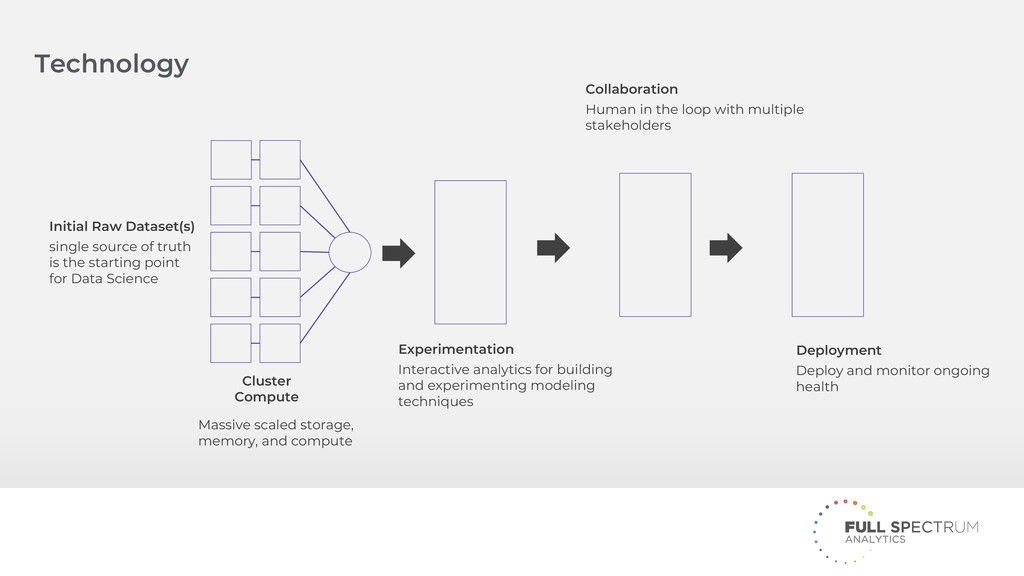
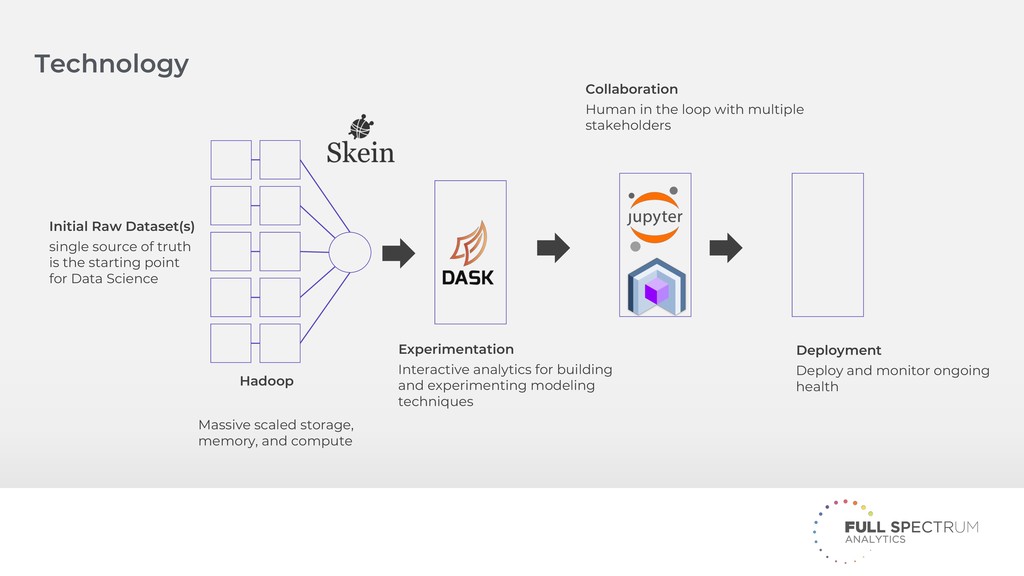
Raw Dataset(s) single source of truth is the starting point for Data Science Experimentation Interactive analytics for building and experimenting modeling techniques Collaboration Human in the loop with multiple stakeholders Deployment Deploy and monitor ongoing health
Dataset(s) single source of truth is the starting point for Data Science Experimentation Interactive analytics for building and experimenting modeling techniques Collaboration Human in the loop with multiple stakeholders Deployment Deploy and monitor ongoing health


 namiki64
 ueponx
 bgpat
 makocchi
 mohab1
 sansantech
 jtakeda
 riyaamemiya
 ykanoh
 yuuuuuuu168
 ivry_presentationmaterials
 taketakekaho
 jonyablonski
 aleyda
 caitiem20
 axbom
 jlugia
 bermonpainter
 scottboms
 maggiecrowley
 lcolladotor
 baasie
 rkendrick25
 lara