Upgrade to Pro
— share decks privately, control downloads, hide ads and more …
Speaker Deck
Features
Speaker Deck
PRO
Sign in
Sign up for free
Search
Search
Real-time application monitoring
Search
Igor Afonov
June 19, 2012
Programming
1k
5
Share
Embed
Copy iframe code
Copy JS code
Copy link
Start on current slide
Real-time application monitoring
Real-time application monitoring. Coffee and code Donetsk June 2012.
Igor Afonov
June 19, 2012
More Decks by Igor Afonov
See All by Igor Afonov
Application deployment with Chef
iafonov
6
1.1k
Web servers - and how I created my own one
iafonov
8
1.2k
Chef - Infrastructure as code
iafonov
6
690
Other Decks in Programming
See All in Programming
LLMによるContent Moderationの本番運用の裏側と品質担保への挑戦
suikabar
3
860
act1-costs.pdf
sumedhbala
0
230
AIエージェントで 変わるAndroid開発環境
takahirom
2
680
Hatena Engineer Seminar #37「言語モデルの活用に関する研究」
slashnephy
0
520
なぜ型を書くのか? TSKaigi2026で改めて考える #tskaigi_smarthr
kajitack
0
380
Generative UI & AI-Assistants for Your Angular Solutions
manfredsteyer
PRO
1
190
そのテスト、説明できますか?~LWテスト戦略FW~のご紹介
nakahara
0
210
OSINT for SRE: 学術論文とポストモーテムから探る システム障害の共通パターン / SRE NEXT 2026
tomoyk
1
3.9k
AI 輔助遺留系統現代化的經驗分享
jame2408
1
1.2k
継続モナドとリアクティブプログラミング
yukikurage
3
610
型も通る、synthも通る、それでも危ない 〜AIのCDKの権限とコストを機械で検証する〜 / It Passes Type Checks, It Passes Synth Checks, but It’s Still Risky — Automatically Verifying Permissions and Costs in AI’s CDK —
seike460
PRO
1
360
AI駆動開発を妨げる技術的負債の解消アプローチ / ai-refactoring-approach
minodriven
17
9.1k
Featured
See All Featured
Being A Developer After 40
akosma
91
590k
Kristin Tynski - Automating Marketing Tasks With AI
techseoconnect
PRO
0
290
The SEO identity crisis: Don't let AI make you average
varn
0
520
Lightning talk: Run Django tests with GitHub Actions
sabderemane
0
220
For a Future-Friendly Web
brad_frost
183
10k
Agile Leadership in an Agile Organization
kimpetersen
PRO
0
190
Embracing the Ebb and Flow
colly
88
5.1k
Visual Storytelling: How to be a Superhuman Communicator
reverentgeek
2
590
How to train your dragon (web standard)
notwaldorf
97
6.7k
How to Get Subject Matter Experts Bought In and Actively Contributing to SEO & PR Initiatives.
livdayseo
0
150
Agile that works and the tools we love
rasmusluckow
331
22k
Writing Fast Ruby
sferik
630
63k
Transcript
Real-time application monitoring Igor Afonov @iafonov
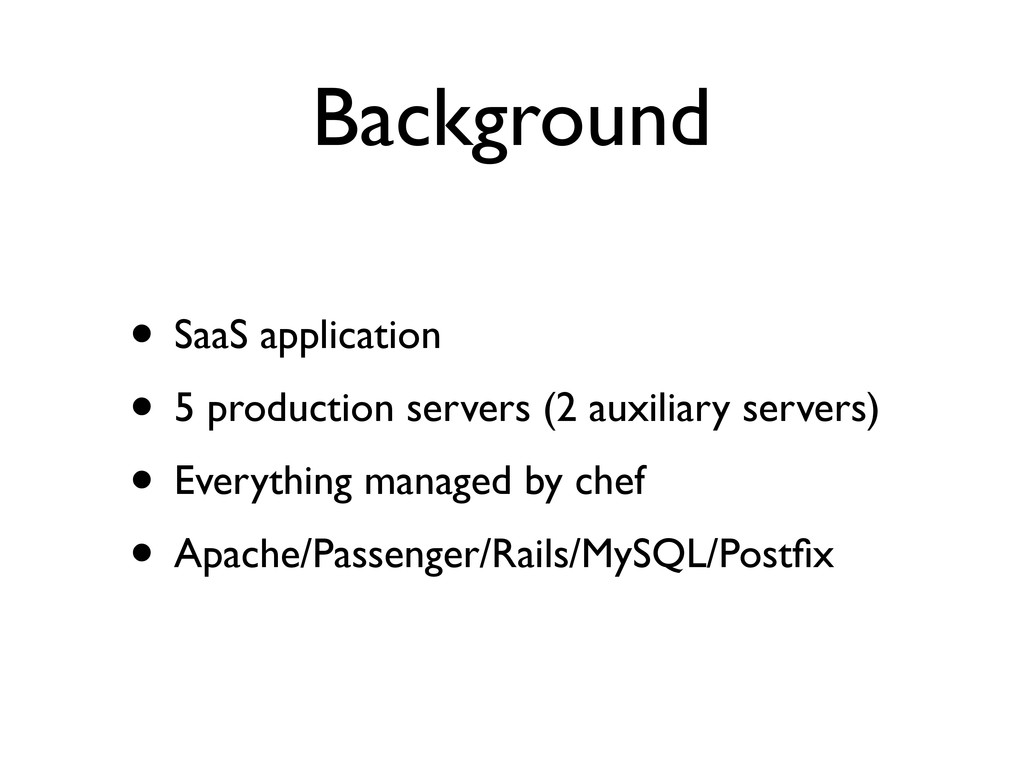
Background • SaaS application • 5 production servers (2 auxiliary
servers) • Everything managed by chef • Apache/Passenger/Rails/MySQL/Postfix
Metrics that matter • Server state • Application state
How metrics data is stored • Round-robin database • RRDTool
(C), Whisper (Python) (Minor offtopic)
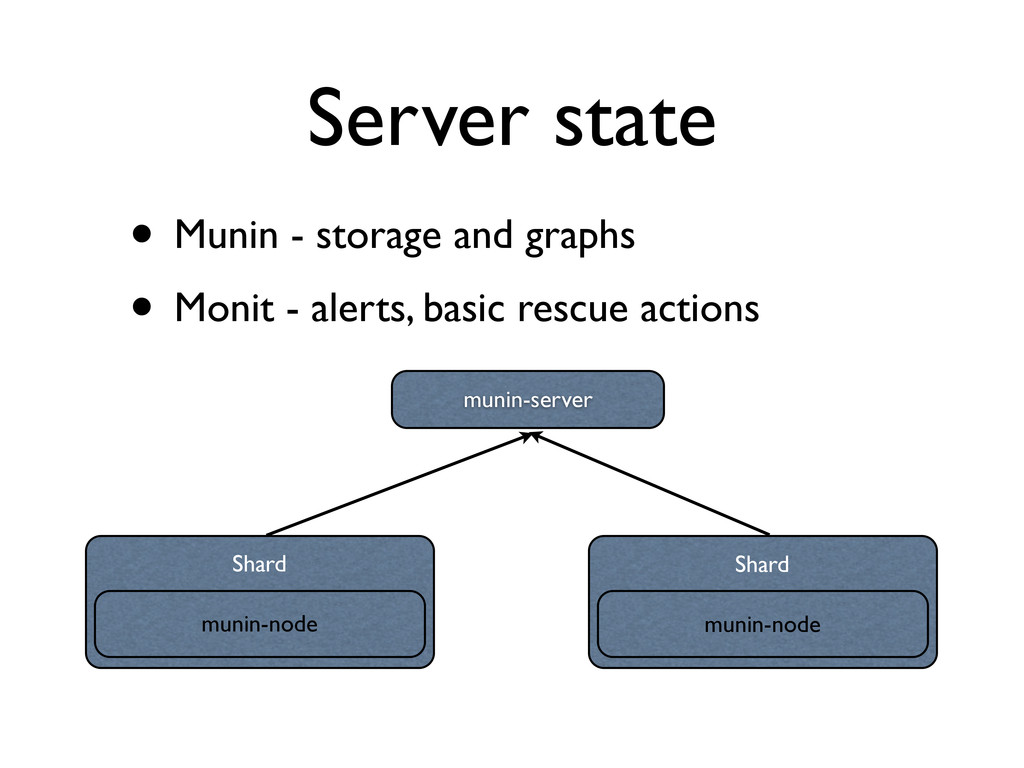
Server state • Munin - storage and graphs • Monit
- alerts, basic rescue actions Shard munin-server munin-node Shard munin-node
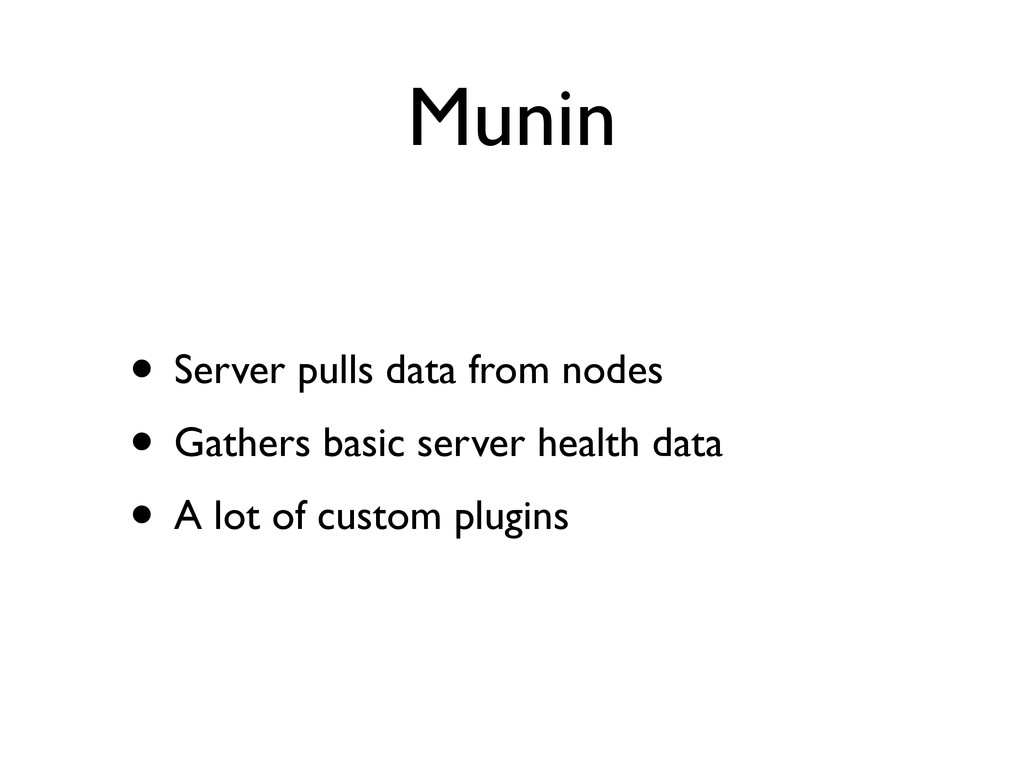
Munin • Server pulls data from nodes • Gathers basic
server health data • A lot of custom plugins
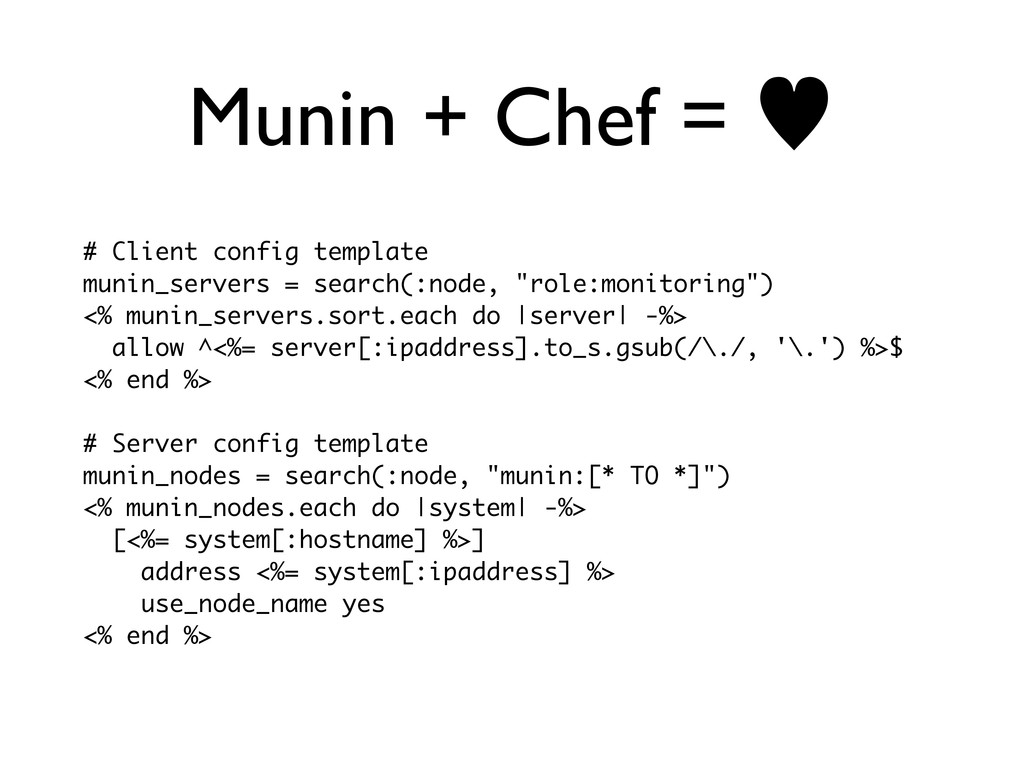
Munin + Chef = — # Client config template munin_servers
= search(:node, "role:monitoring") <% munin_servers.sort.each do |server| -%> allow ^<%= server[:ipaddress].to_s.gsub(/\./, '\.') %>$ <% end %> # Server config template munin_nodes = search(:node, "munin:[* TO *]") <% munin_nodes.each do |system| -%> [<%= system[:hostname] %>] address <%= system[:ipaddress] %> use_node_name yes <% end %>
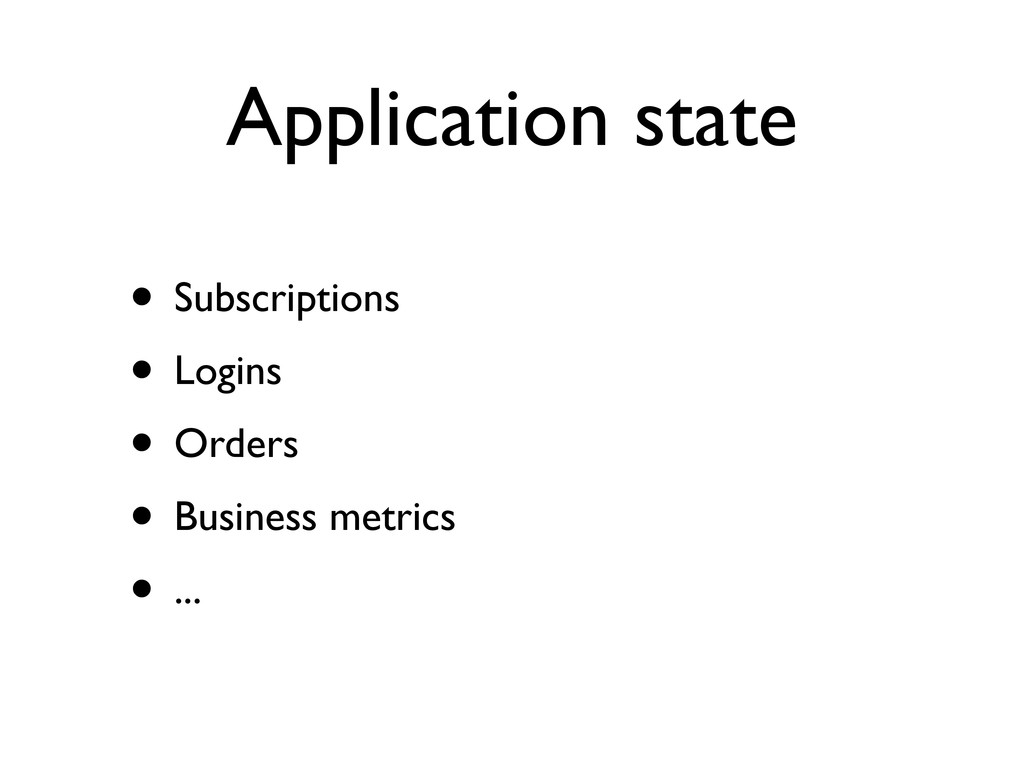
Application state • Subscriptions • Logins • Orders • Business
metrics • ...
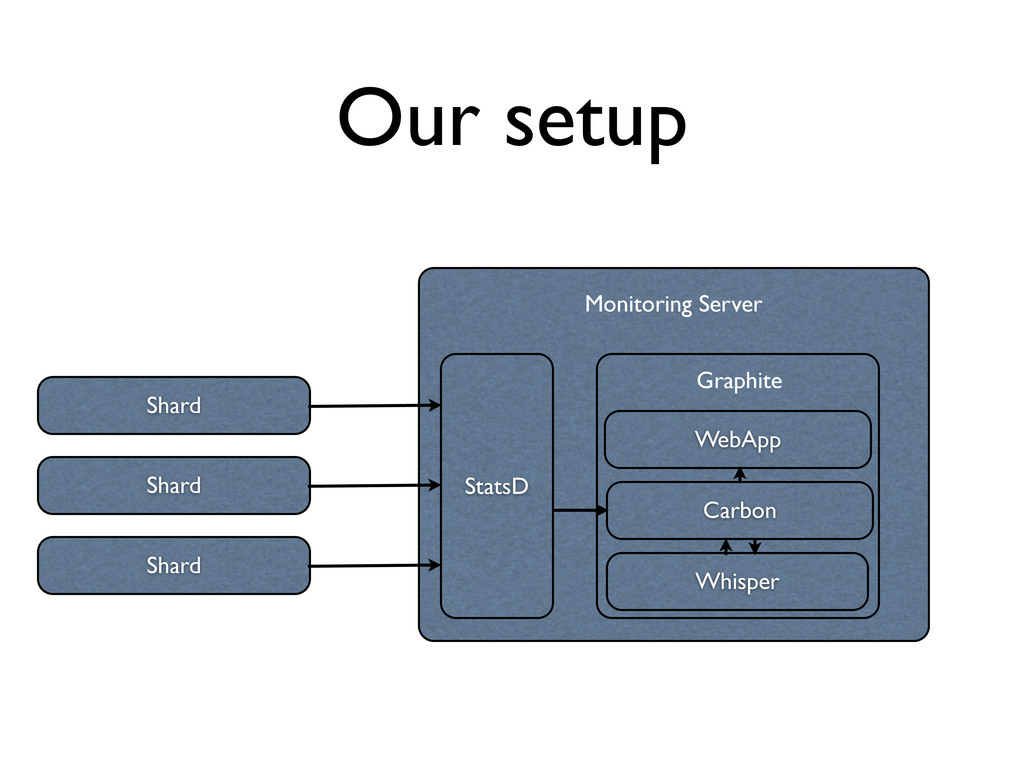
Our setup Shard Monitoring Server StatsD Graphite Whisper Carbon WebApp
Shard Shard
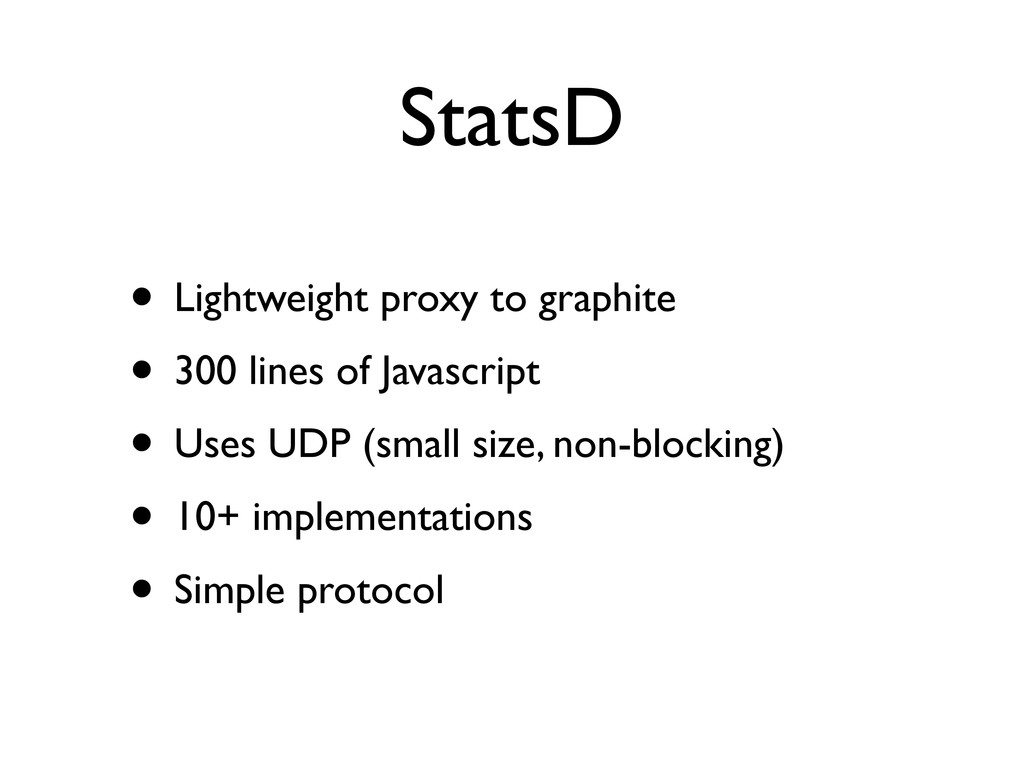
StatsD • Lightweight proxy to graphite • 300 lines of
Javascript • Uses UDP (small size, non-blocking) • 10+ implementations • Simple protocol
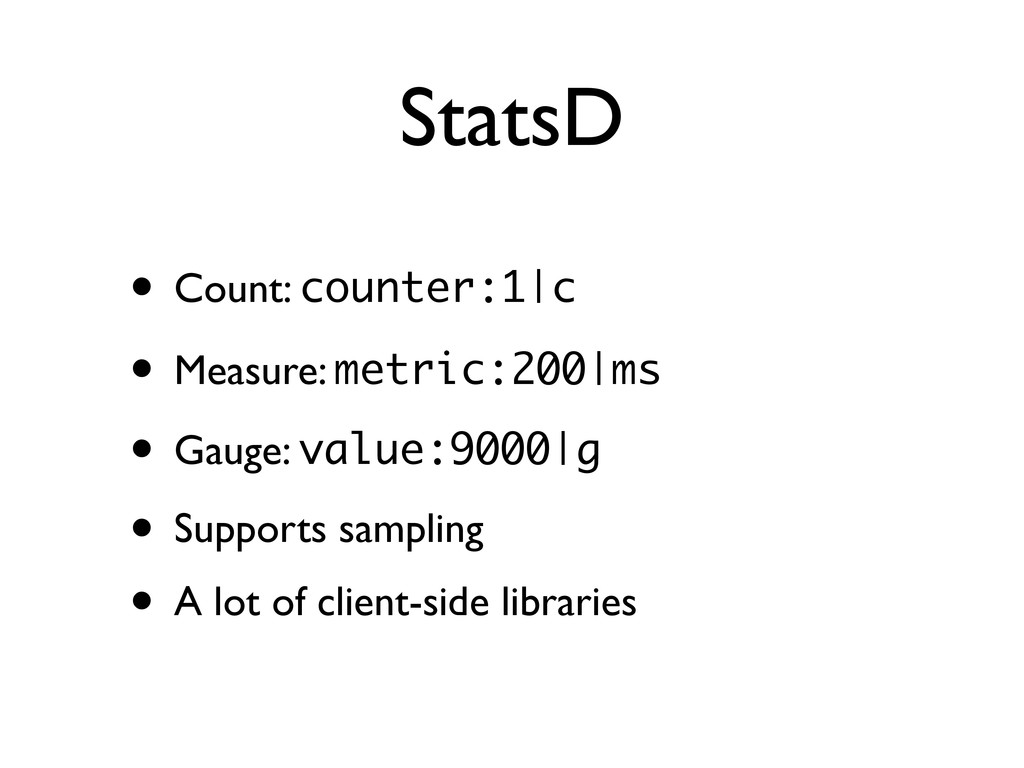
StatsD • Count: counter:1|c • Measure: metric:200|ms • Gauge: value:9000|g
• Supports sampling • A lot of client-side libraries
StatsD StatsD.server = '178.22.33.88:8125' # increment counter StatsD.increment("users.new") # measure
task StatsD.measure("cron.#{task}") do task.run end # meta-programming - track subscriptions Subscription.extend StatsD::Instrument Subscription.statsd_count :subscribe, 'subscriptions'
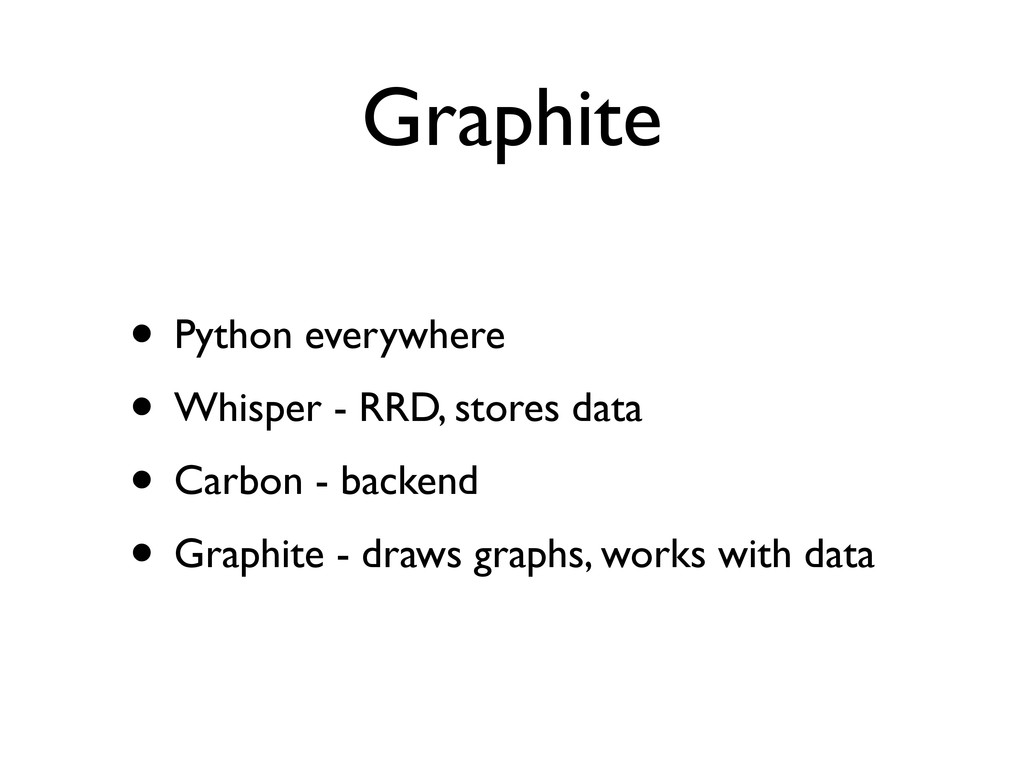
Graphite • Python everywhere • Whisper - RRD, stores data
• Carbon - backend • Graphite - draws graphs, works with data
Graphite [stats] priority = 100 pattern = ^stats\..* retentions =
10:2160,60:10080,600:262974 (Storage schemas)
Problems • Basic UI • Complex installation and setup
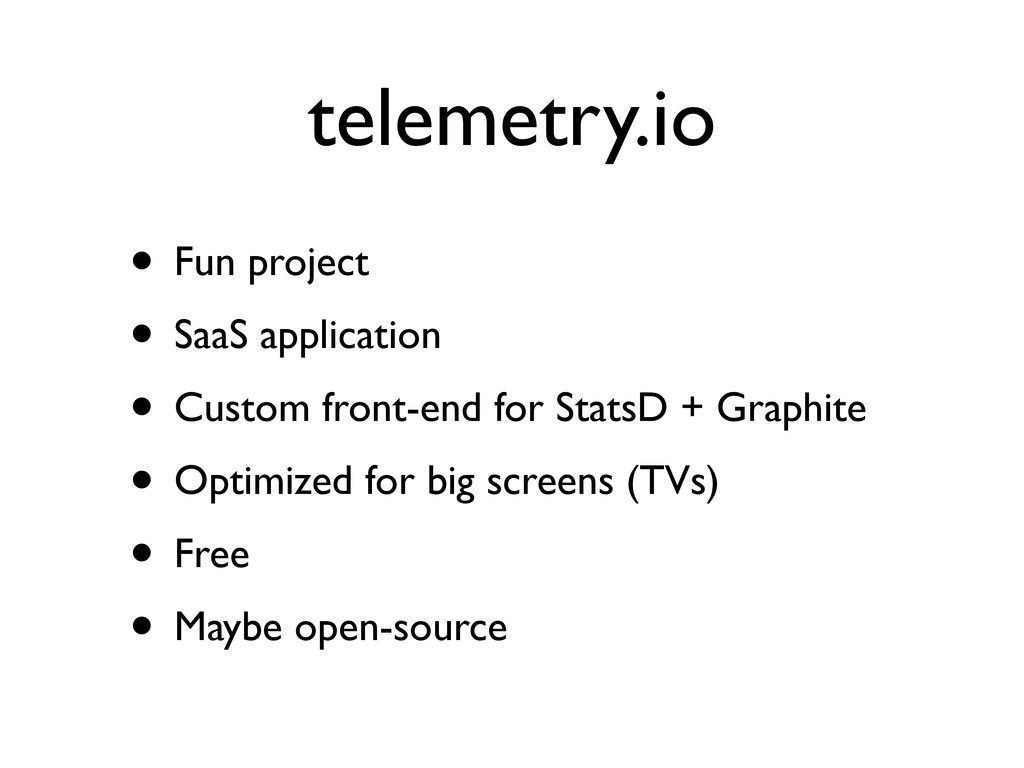
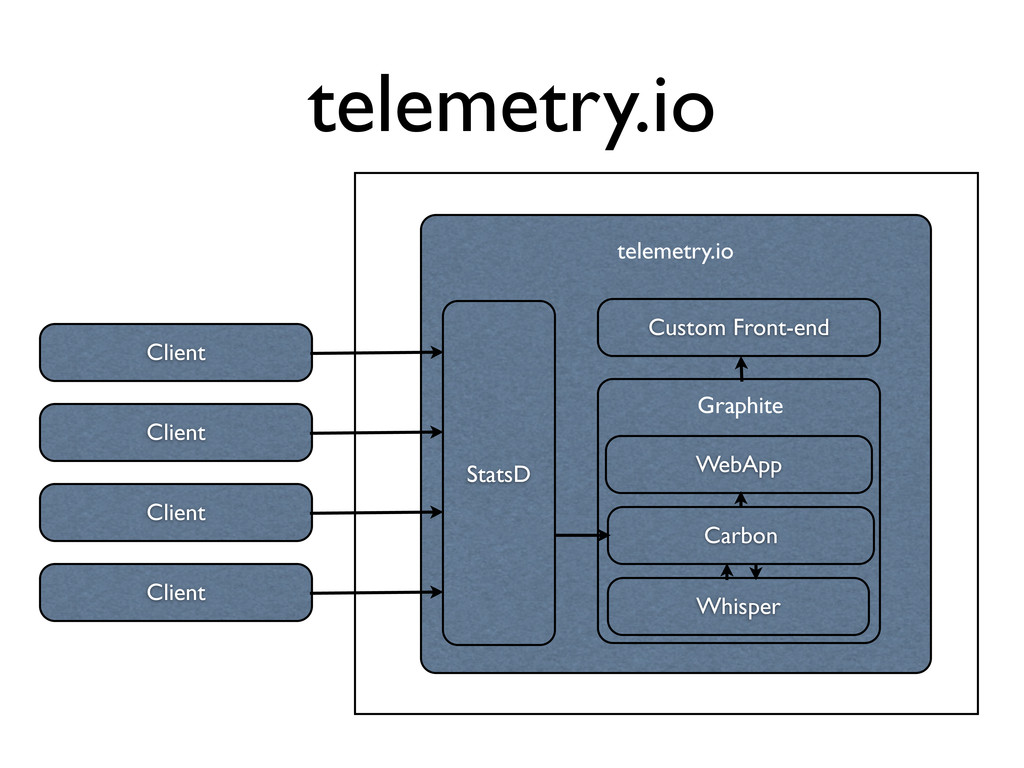
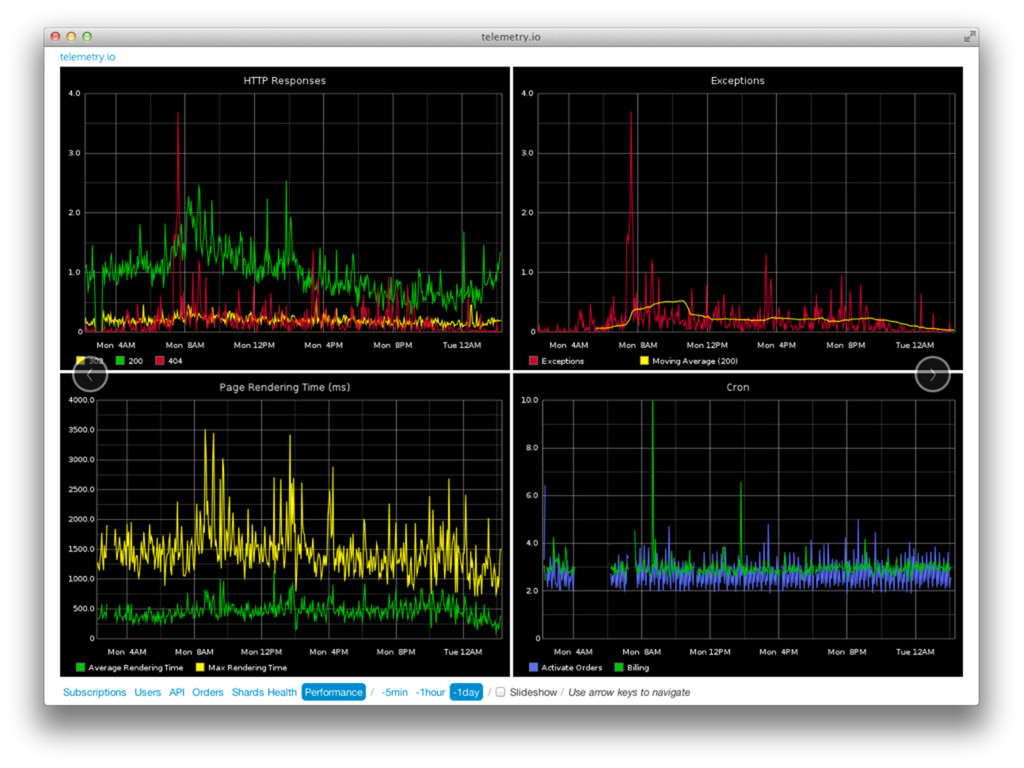
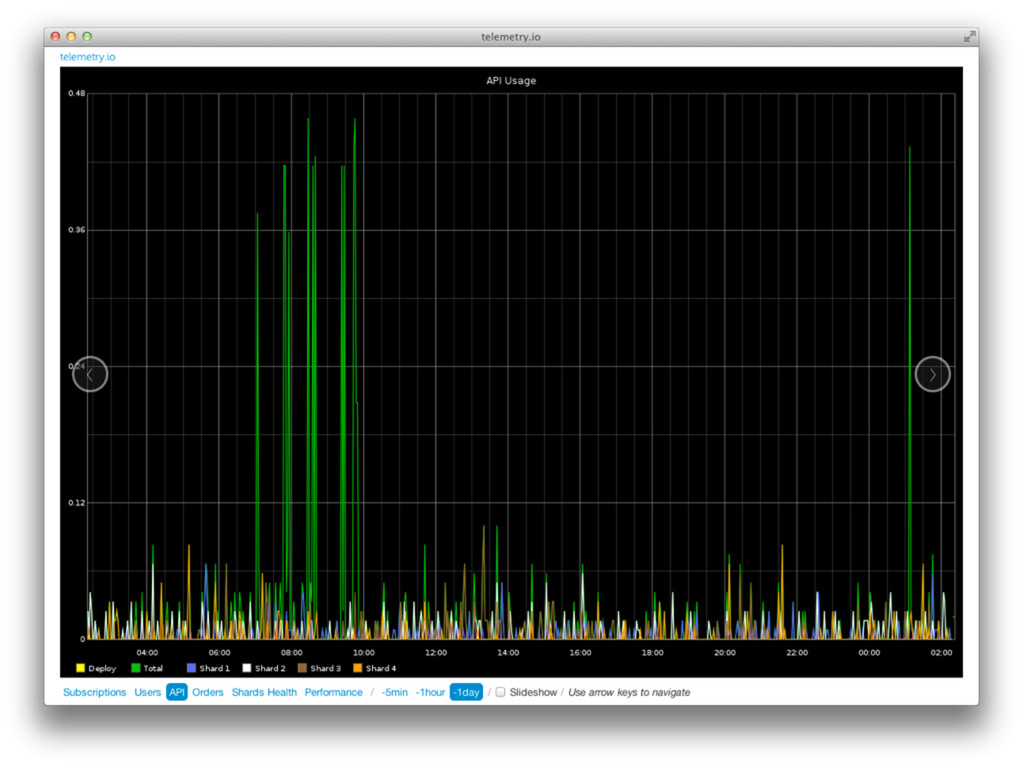
telemetry.io • Fun project • SaaS application • Custom front-end
for StatsD + Graphite • Optimized for big screens (TVs) • Free • Maybe open-source
telemetry.io Client telemetry.io StatsD Graphite Whisper Carbon WebApp Custom Front-end
Client Client Client
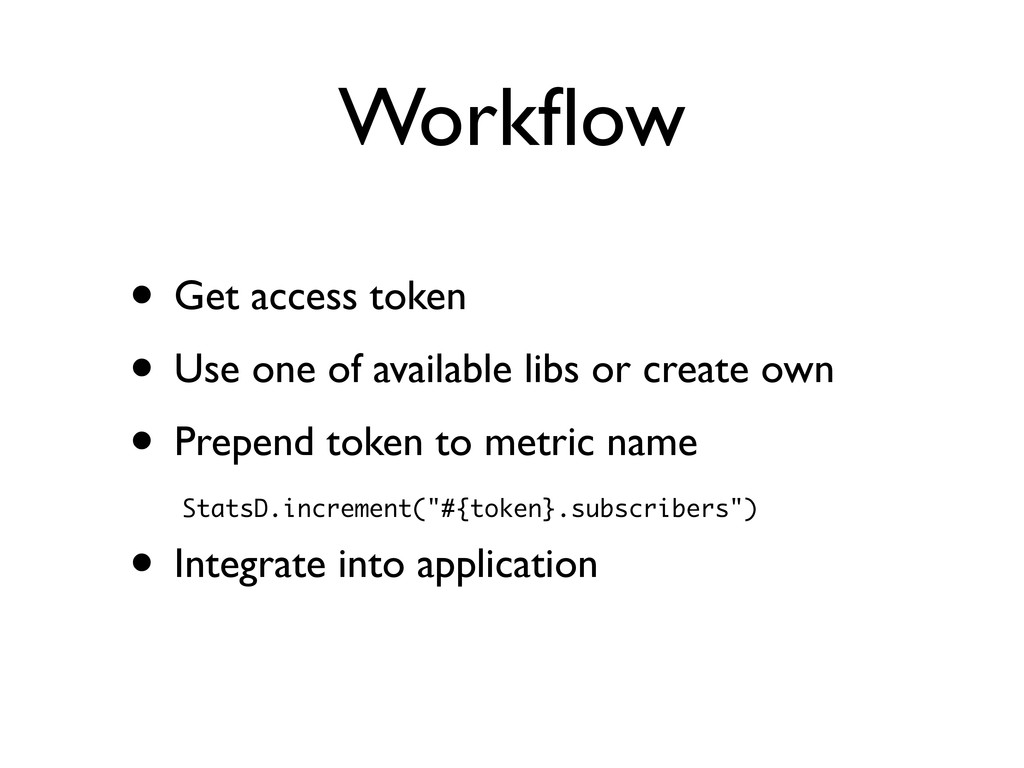
Workflow • Get access token • Use one of available
libs or create own • Prepend token to metric name • Integrate into application StatsD.increment("#{token}.subscribers")
None
None
None
None
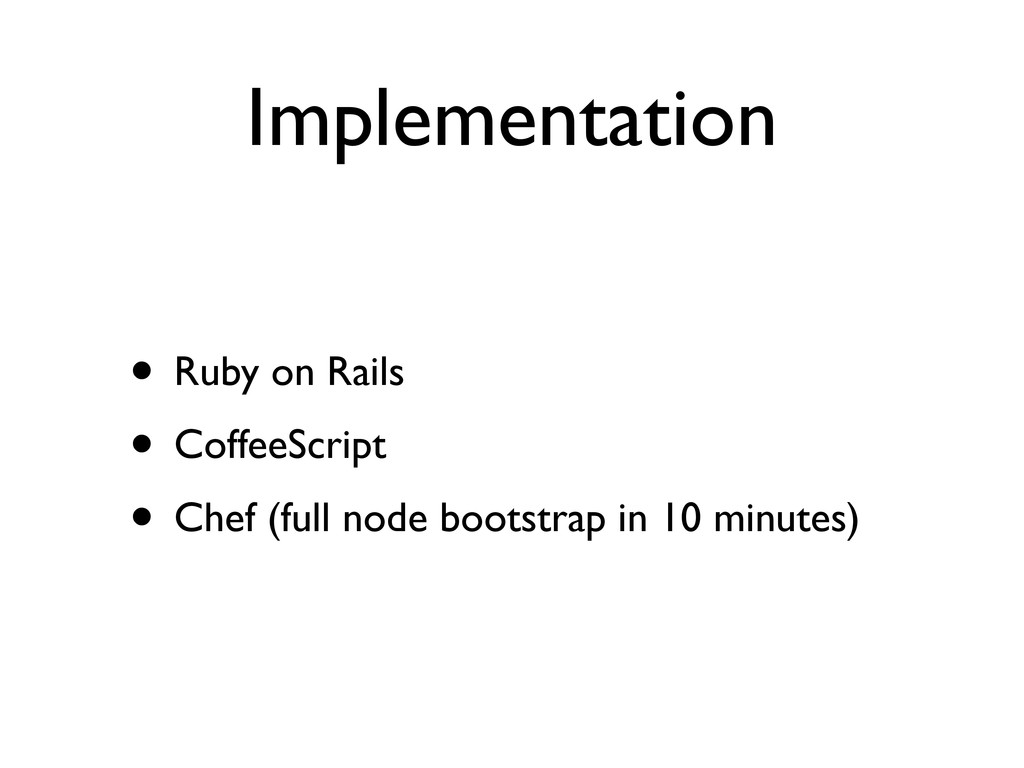
Implementation • Ruby on Rails • CoffeeScript • Chef (full
node bootstrap in 10 minutes)
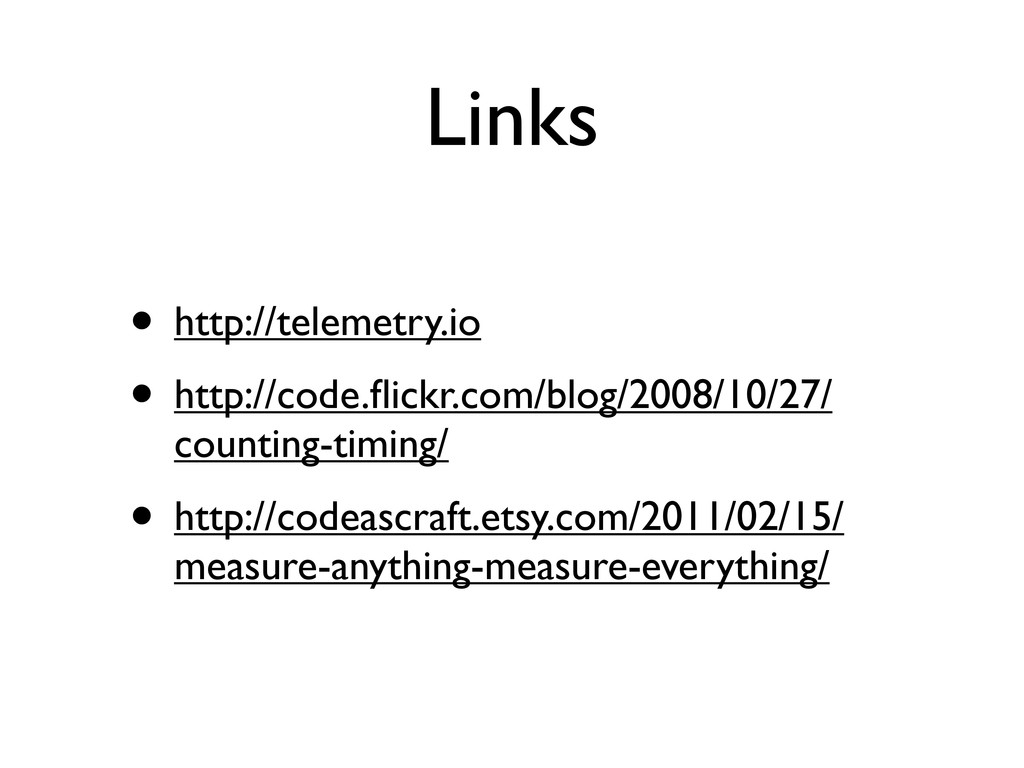
Links • http://telemetry.io • http://code.flickr.com/blog/2008/10/27/ counting-timing/ • http://codeascraft.etsy.com/2011/02/15/ measure-anything-measure-everything/
http://iafonov.github.com/ @iafonov
![Graphite [stats] priority = 100 pattern = ^stats\..* retentions =](https://files.speakerdeck.com/presentations/4fe02a2f2d2d2f0022020f5f/slide_13.jpg)