Lecure 6 for the Kallisto vs Salmon controversy of 2017. The appoaches are extremely fast and convenient. Will probably replace traditional methods (for cases when a transcriptome is available).
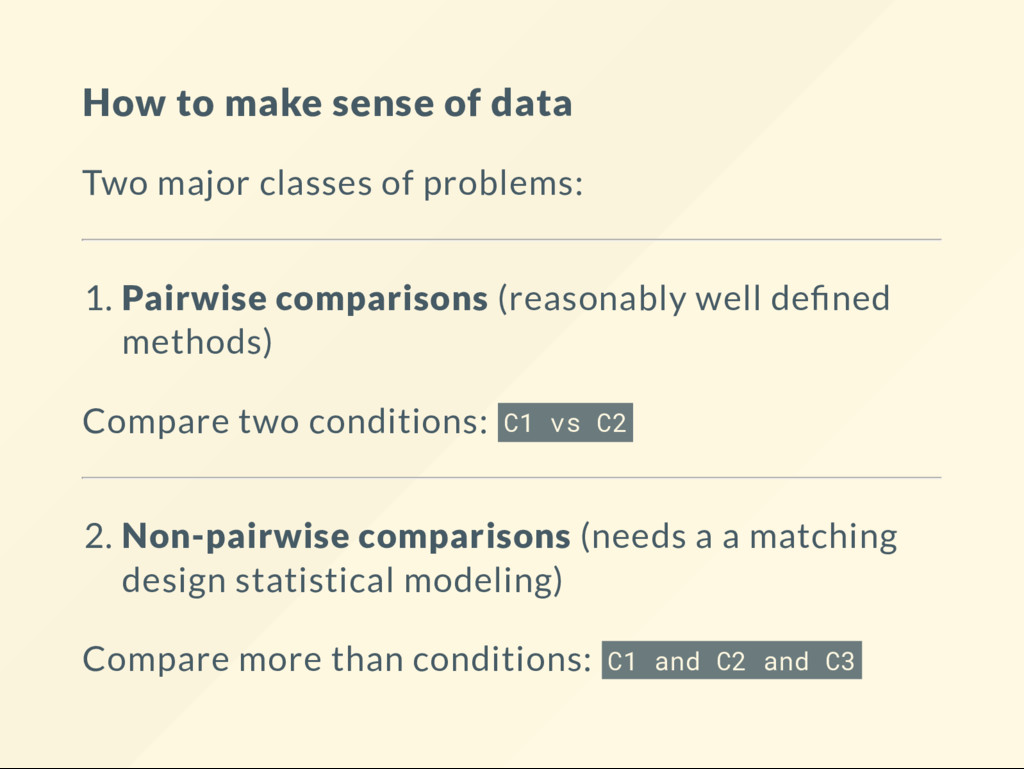
problems: 1. Pairwise comparisons (reasonably well de ned methods) Compare two conditions: C1 vs C2 2. Non-pairwise comparisons (needs a a matching design statistical modeling) Compare more than conditions: C1 and C2 and C3
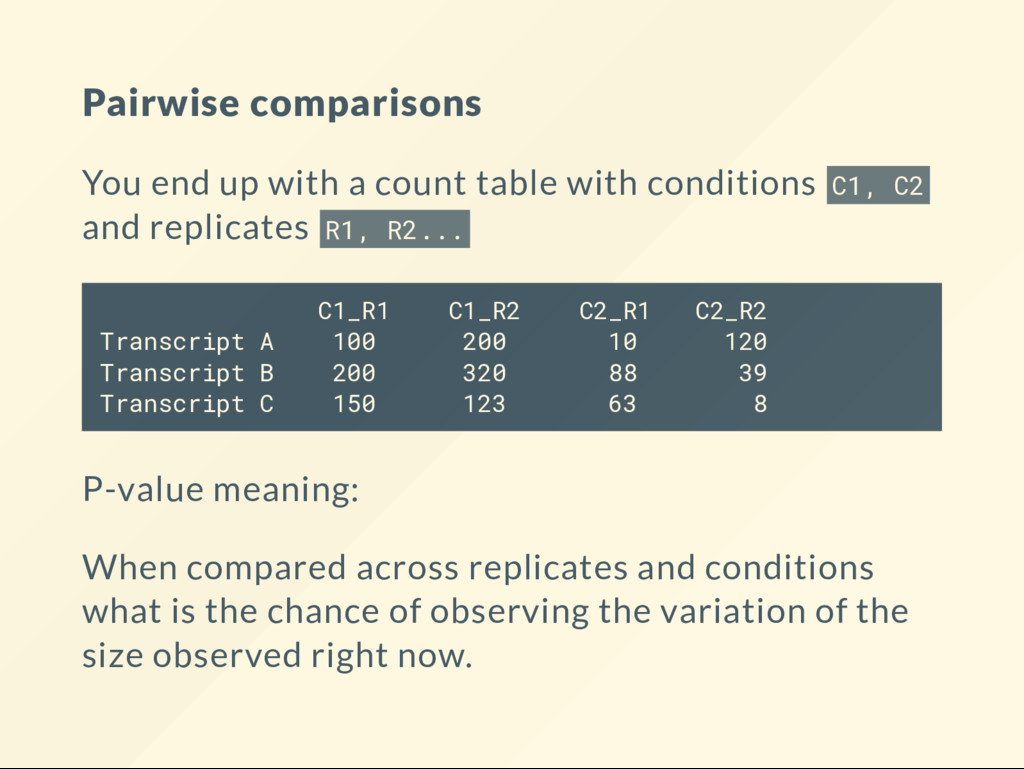
conditions C1, C2 and replicates R1, R2... C1_R1 C1_R2 C2_R1 C2_R2 Transcript A 100 200 10 120 Transcript B 200 320 88 39 Transcript C 150 123 63 8 P-value meaning: When compared across replicates and conditions what is the chance of observing the variation of the size observed right now.
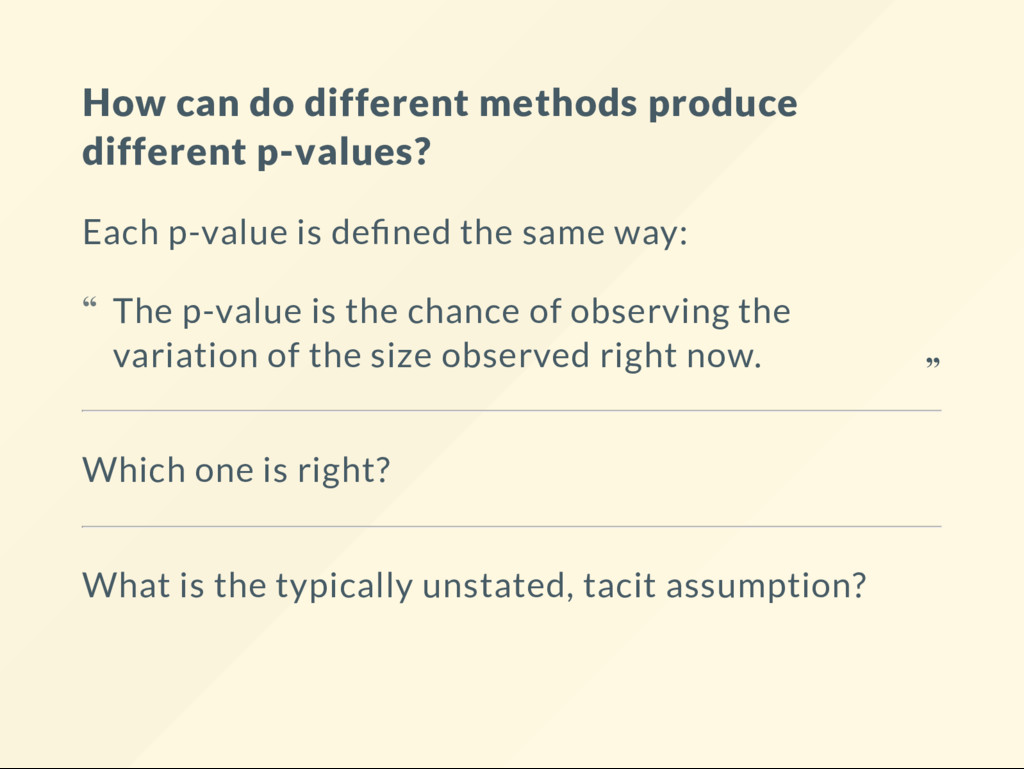
is de ned the same way: Which one is right? What is the typically unstated, tacit assumption? The p-value is the chance of observing the variation of the size observed right now. “ “
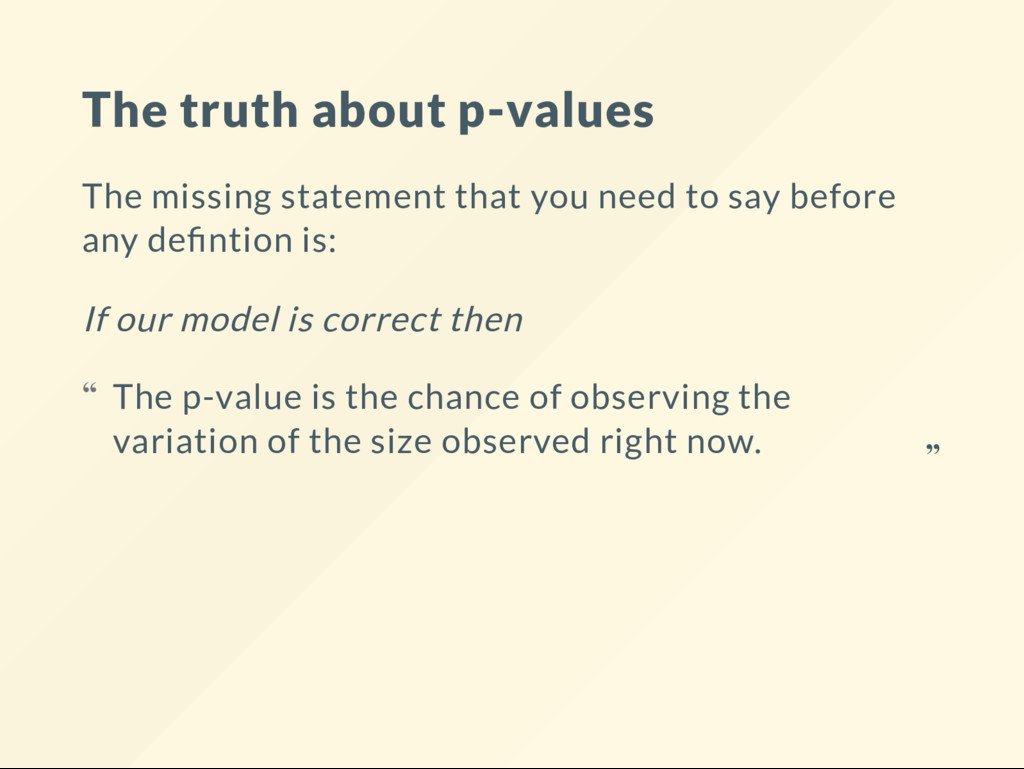
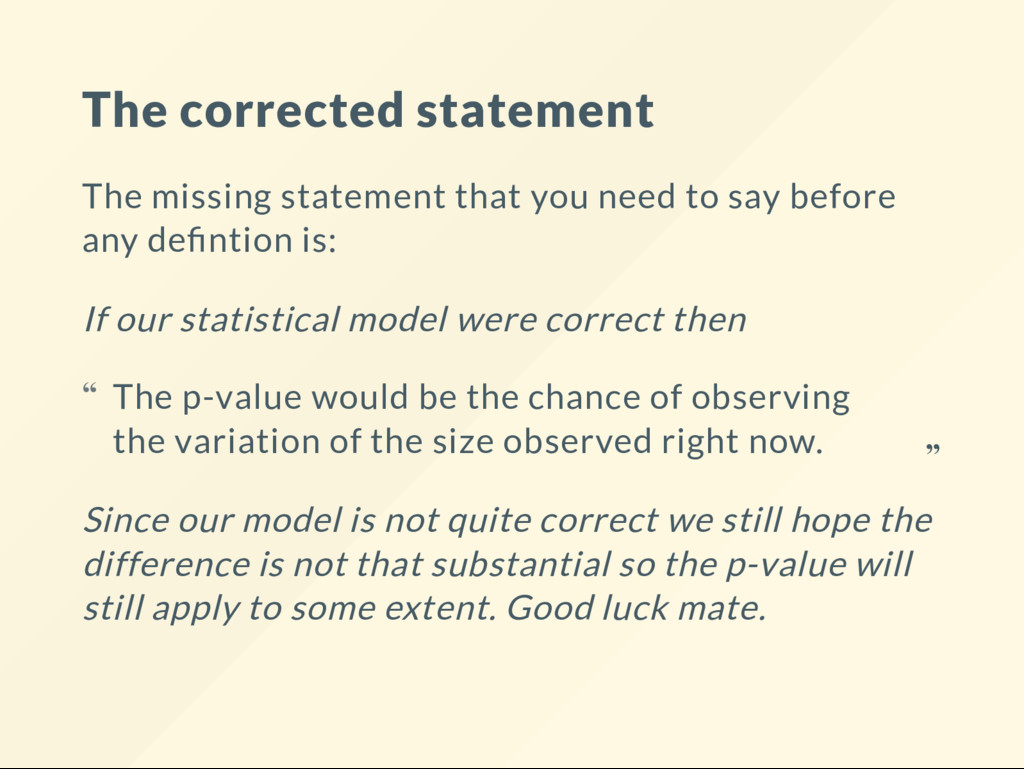
say before any de ntion is: If our statistical model were correct then Since our model is not quite correct we still hope the difference is not that substantial so the p-value will still apply to some extent. Good luck mate. The p-value would be the chance of observing the variation of the size observed right now. “ “
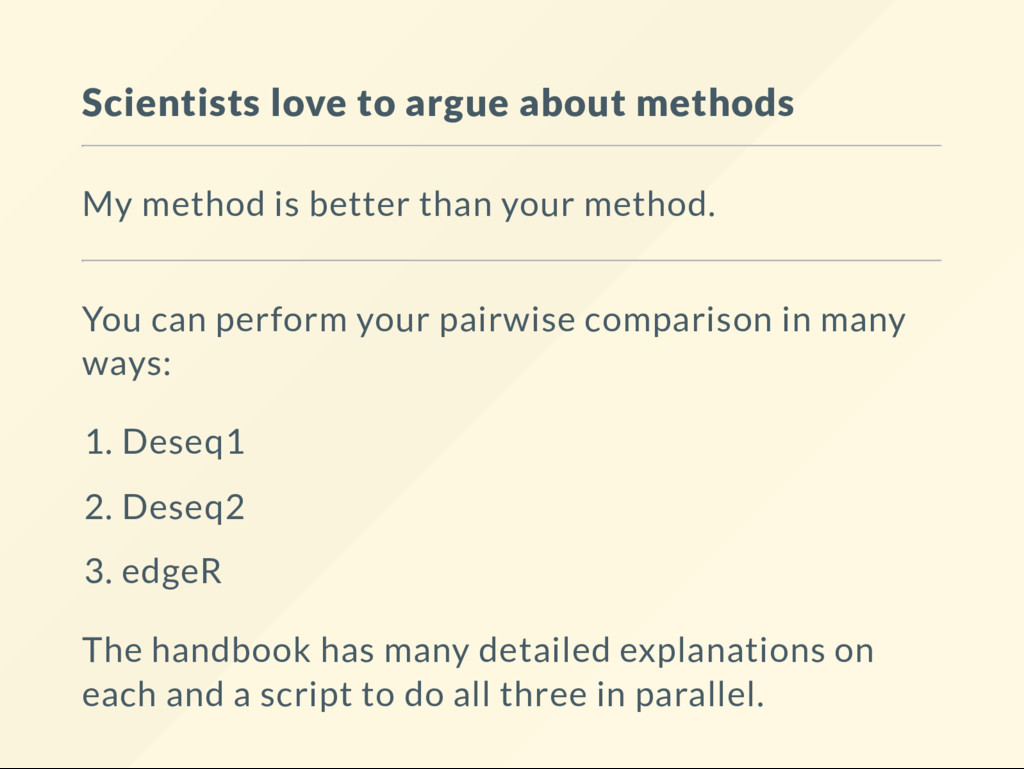
than your method. You can perform your pairwise comparison in many ways: 1. Deseq1 2. Deseq2 3. edgeR The handbook has many detailed explanations on each and a script to do all three in parallel.
with a list of transcripts, genes, features. Most publications are about interpreting these lists of genes. Go back to Lecture 5: How do I interpret a list of genes?
interface. Runnable by someone else. Shareable between users. Modifyiable, customizable. It is still a script, but a web enabled one. Borrow each others scripts, learn and create full examples.
teaching this course. Now joining other tools that came out from this course: Galaxy, Biostar, Biostar Handbook and now the the new baby: Bioinformatics Recipes We have very high hopes and expectations - I think this time next year the bioinformatics world will be runnning on recipes.