Upgrade to Pro — share decks privately, control downloads, hide ads and more …

The Urban Environment - Stephen Holgate

IAQM
March 01, 2007

The Urban Environment - Stephen Holgate

health, PM

IAQM

March 01, 2007
Tweet

Other Decks in Science

Transcript

  1. The Urban Environment Impacts on Health and Wellbeing •A successful

    urban area stimulates those who live and work there and reinforces self-esteem. •The urban environment affect health and wellbeing of everyone who lives and works there. •Many problems are concentrated in the most deprived areas where environmental, social and economic factors interact especially children and older people. •Relationship between health, wellbeing and place are complex interacting and poorly understood.
  2. Effects of Urban Environment on Health • Air pollution: 24,000

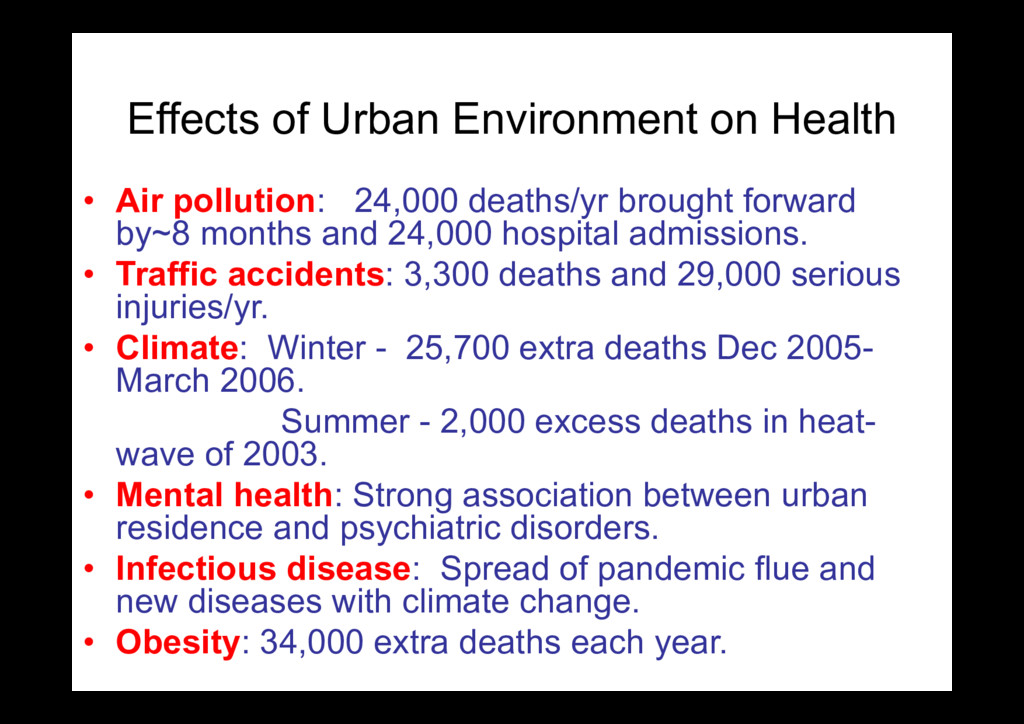
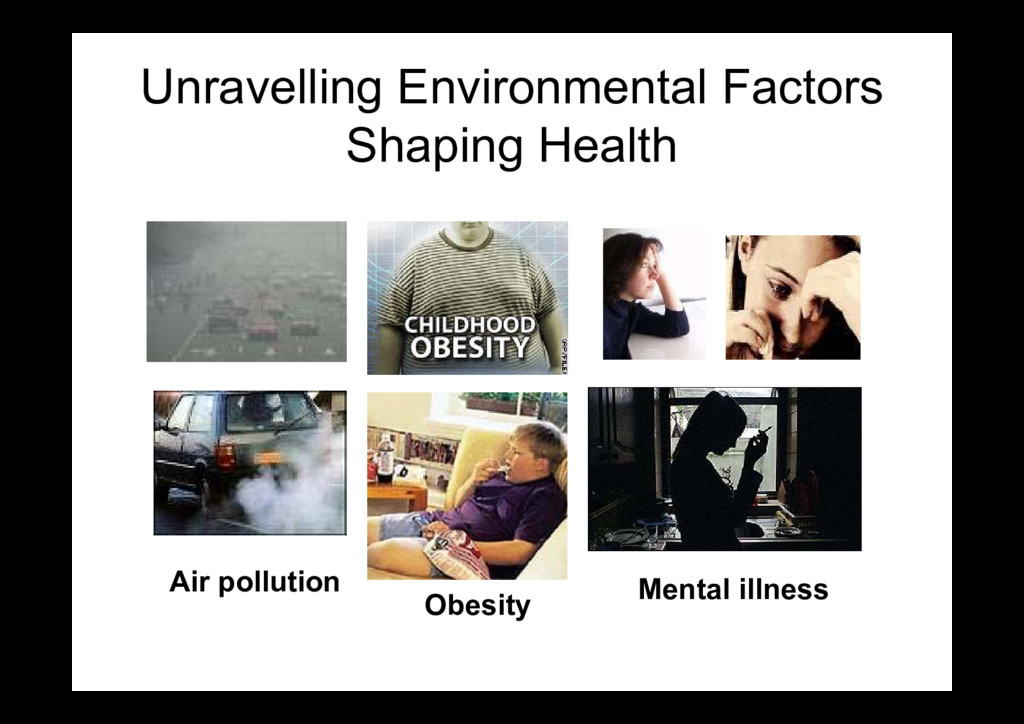
    deaths/yr brought forward by~8 months and 24,000 hospital admissions. • Traffic accidents: 3,300 deaths and 29,000 serious injuries/yr. • Climate: Winter - 25,700 extra deaths Dec 2005- March 2006. Summer - 2,000 excess deaths in heat- wave of 2003. • Mental health: Strong association between urban residence and psychiatric disorders. • Infectious disease: Spread of pandemic flue and new diseases with climate change. • Obesity: 34,000 extra deaths each year.
  3. •1,000,000,000,000 particles enter into lungs daily •10,000 lts of air

    pass through the lungs every 24 hours. •Surface area exposed to the external environment - 150 m2 AIR POLLUTION PARTICLES AND THE LUNG
  4. 0 2000 4000 6000 8000 10000 12000 0 20 40

    60 80 Time (mins following inhalation) CPM/ gram blood Tc99-Technigas <100nm mmd
  5. % Increase Mortality Hospitalisation Symptoms Decreased lung function 4 3

    2 1 Percentage Change in Health End-point for a 10g/m3 Increase in PM10 (summarised from over 100 studies) Adverse health effects of particles persist after controlling for smoking
  6. Cardiovascular Mortality: PM2.5 and Black Smoke: Long-term Exposure * *

    PM2.5 Black Smoke Relative risk of all cause mortality per 10 g/m3 change in annual average PM2.5: 1.06 (95% CI:1.02-1.11)
  7. Asthma & Bronchitis Associated with PM10 Influence of Closing and

    Reopening a Steel Mill in Utah Valley Pope, Am J Public Health 1989 0 100 200 300 Fe Cu Zn Pb Ni 0 100 200 300 0 100 200 300 Concentration (ppb) 1985-86 1986-87 1987-88 0 50 100 150 200 250 PM10 (g/m3) Mean High PM10 Mean PM10 1985-86 1986-87 1987-88 0 20 40 60 80 100 Hospital Admissions Asthma + Bronchitis Ages 0-17
  8. Emission of nitrogen oxides, sulphur dioxide, ammonia and non methyl

    VOC from anthrop0genic sources by sector in the UK
  9. Proportion of diesel vehicles in car fleet (D’Amato et al,

    Clin Exp Allergy 2000; 30: 628-636) COUNTRY DIESEL CARS (%) Austria 54% Belgium 52.2% Spain 47.3% France 40.2% Italy 22.5% Holland 20.3% Portugal 18.8% Germany 17.6% UK 15.3% Sweden 11.0% EUROPEAN MEAN 25.3%* * Forecast to increase to 50% by 2010
  10. The web of connections between increased car ownership and use

    and environmental and social outcomes in urban areas The Urban Environment – Royal Commission on Environmental Pollution March 2007
  11. Reccommendations that Directly Influence Health • Reduce hot spots of

    air pollution in urban settings. • Promotion of overall air pollution reduction for the whole population (Gap Closure).
  12. Reccommendations that Directly Influence Health • Reduce hot spots of

    air pollution in urban settings. • Promotion of overall air pollution reduction for the whole population (Gap Closure). • Develop a statutory framework for Health Impact Assessments as a component of Environment Impact Assessment in urban planning.