Upgrade to Pro — share decks privately, control downloads, hide ads and more …

Beneath the Bytecode: Observing the JVM at Work Using Bytecode Instrumentation

Beneath the Bytecode: Observing the JVM at Work Using Bytecode Instrumentation

ICOOOLPS Workshop

July 18, 2016
Tweet

More Decks by ICOOOLPS Workshop

Other Decks in Science

Transcript

  1. http://d3s.mff.cuni.cz CHARLES UNIVERSITY IN PRAGUE faculty of mathematics and physics

    faculty of mathematics and physics Beneath the Bytecode Observing the JVM at Work Using Bytecode Instrumentation Lubomír Bulej
  2. L. Bulej, Workshop on Implementation, Compilation, Optimization of Object-Oriented Languages,

    Programs, and Systems, ECOOP 2016, Rome, Italy 2/63 PHASE_ONLOAD By way of introduction...
  3. L. Bulej, Workshop on Implementation, Compilation, Optimization of Object-Oriented Languages,

    Programs, and Systems, ECOOP 2016, Rome, Italy 3/63 About myself and this talk Performance-related background Observing and measuring what applications do (easily, accurately, promptly—pick two) Experimental evaluation on modern platforms Last few years Frameworks for construction of instrumentation-based dynamic program analysis tools Observing and measuring what applications do … This talk Making the JVM more observable for instrumentation-based dynamic program analysis tools
  4. L. Bulej, Workshop on Implementation, Compilation, Optimization of Object-Oriented Languages,

    Programs, and Systems, ECOOP 2016, Rome, Italy 4/63 PHASE_PRIMORDIAL Bytecode instrumentation and the birth of DiSL.
  5. L. Bulej, Workshop on Implementation, Compilation, Optimization of Object-Oriented Languages,

    Programs, and Systems, ECOOP 2016, Rome, Italy 5/63 Dynamic program analysis Observe a program in execution Identify events relevant to the analysis Trigger analysis code on the events Report properties of that execution The results of the analysis [Hopefully] gain actionable insight Optimize, debug, extend, refactor, … DPA tools rely on observability!
  6. L. Bulej, Workshop on Implementation, Compilation, Optimization of Object-Oriented Languages,

    Programs, and Systems, ECOOP 2016, Rome, Italy 6/63 Observation options on the JVM Debugging interfaces The usual alphabet soup JPDA = JVMTI + JDWP + JDI Unsuitable if used in isolation Bytecode instrumentation (+ JVMTI) Instrumentation captures application-level events JVMTI provides JVM-level events (and more) JVM modification The JVM is not sacred, but...
  7. L. Bulej, Workshop on Implementation, Compilation, Optimization of Object-Oriented Languages,

    Programs, and Systems, ECOOP 2016, Rome, Italy 7/63 The recommended approach Bytecode instrumentation Insert code to reify application events for analysis (Too) many ways to manipulate bytecode AspectJ, Soot, Javassist, ..., BCEL, ASM, JNIF Analysis tools mostly insert code... Gather context data and invoke analysis code … inserting code only needs a few features Expressiveness regarding code locations Control over what really gets inserted Reasonable development effort
  8. L. Bulej, Workshop on Implementation, Compilation, Optimization of Object-Oriented Languages,

    Programs, and Systems, ECOOP 2016, Rome, Italy 8/63 Effort vs. expressiveness vs. control The AspectJ way High-level concepts, low effort, but limited expressiveness, control, and performance The ASM way High expressiveness, control, and performance, but bytecode-level concepts and high effort The DiSL way AspectJ-like (AOP-inspired) concepts ASM-like control, performance, and coverage
  9. L. Bulej, Workshop on Implementation, Compilation, Optimization of Object-Oriented Languages,

    Programs, and Systems, ECOOP 2016, Rome, Italy 9/63 Effort vs. expressiveness vs. control The AspectJ way High-level concepts, low effort, but limited expressiveness, control, and performance The ASM way High expressiveness, control, and performance, but bytecode-level concepts and high effort The DiSL way AspectJ-like (AOP-inspired) concepts ASM-like control, performance, and coverage pointcut executionPointcut() : execution (* HelloWorld.*(..)); before(): executionPointcut() { System.out.println ( "On "+ thisJoinPointStaticPart.getSignature() + " method entry" ); } after(): executionPointcut() { System.out.println ( "On "+ thisJoinPointStaticPart.getSignature() + " method exit" ); } pointcut executionPointcut() : execution (* HelloWorld.*(..)); before(): executionPointcut() { System.out.println ( "On "+ thisJoinPointStaticPart.getSignature() + " method entry" ); } after(): executionPointcut() { System.out.println ( "On "+ thisJoinPointStaticPart.getSignature() + " method exit" ); }
  10. L. Bulej, Workshop on Implementation, Compilation, Optimization of Object-Oriented Languages,

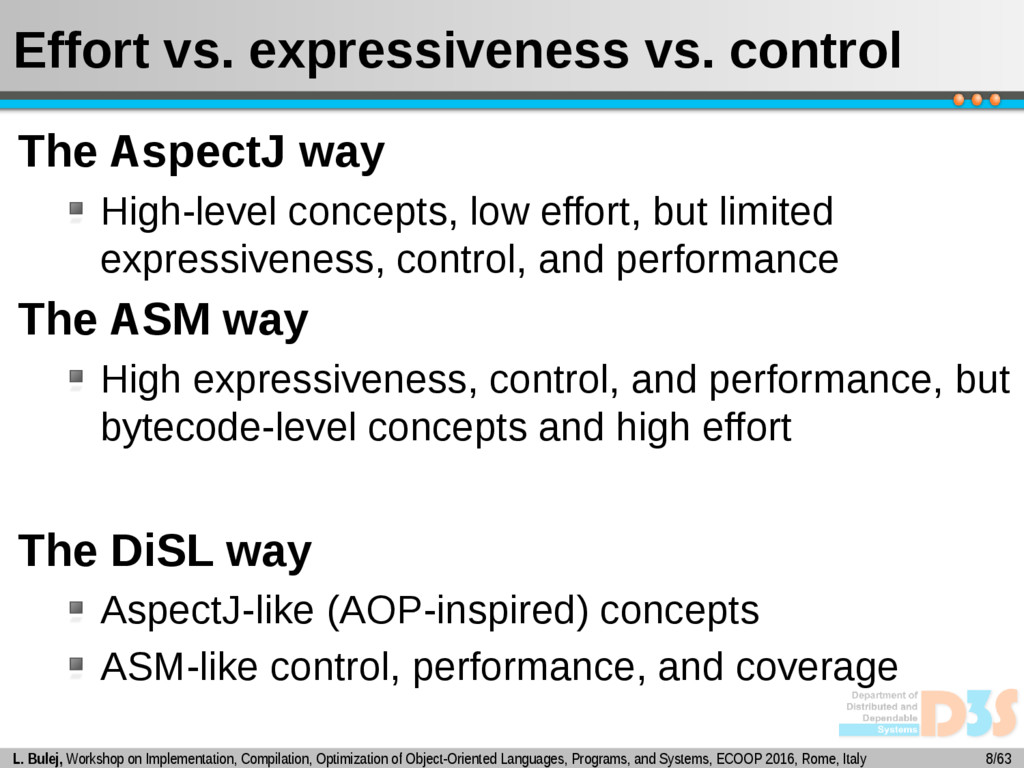
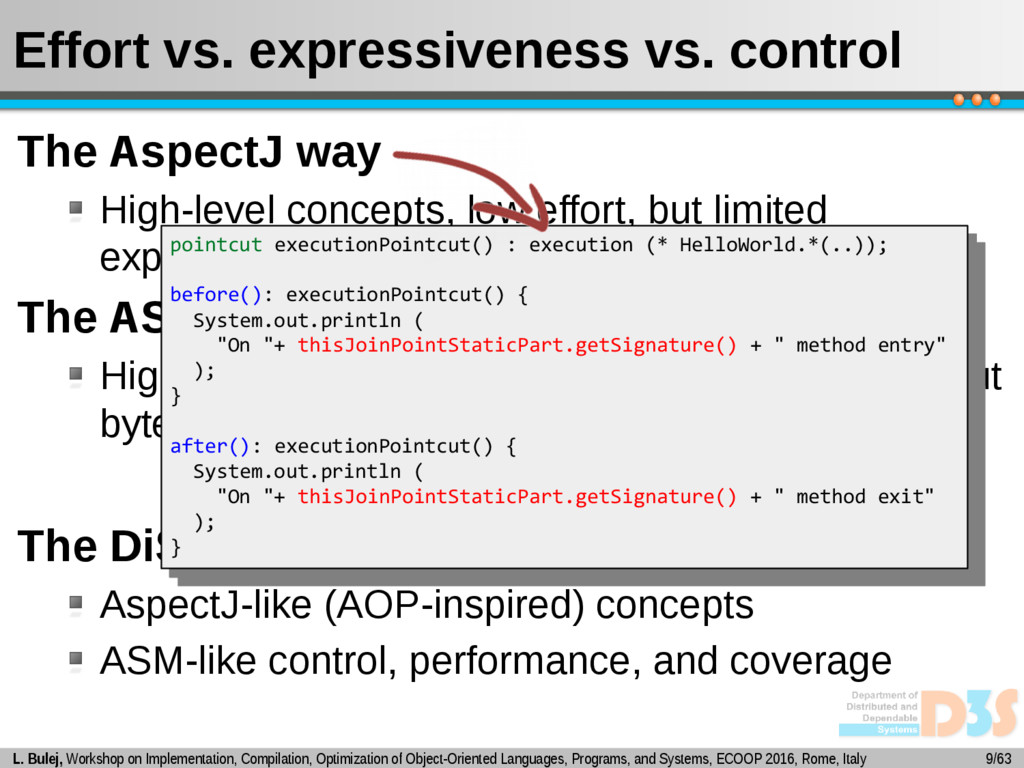
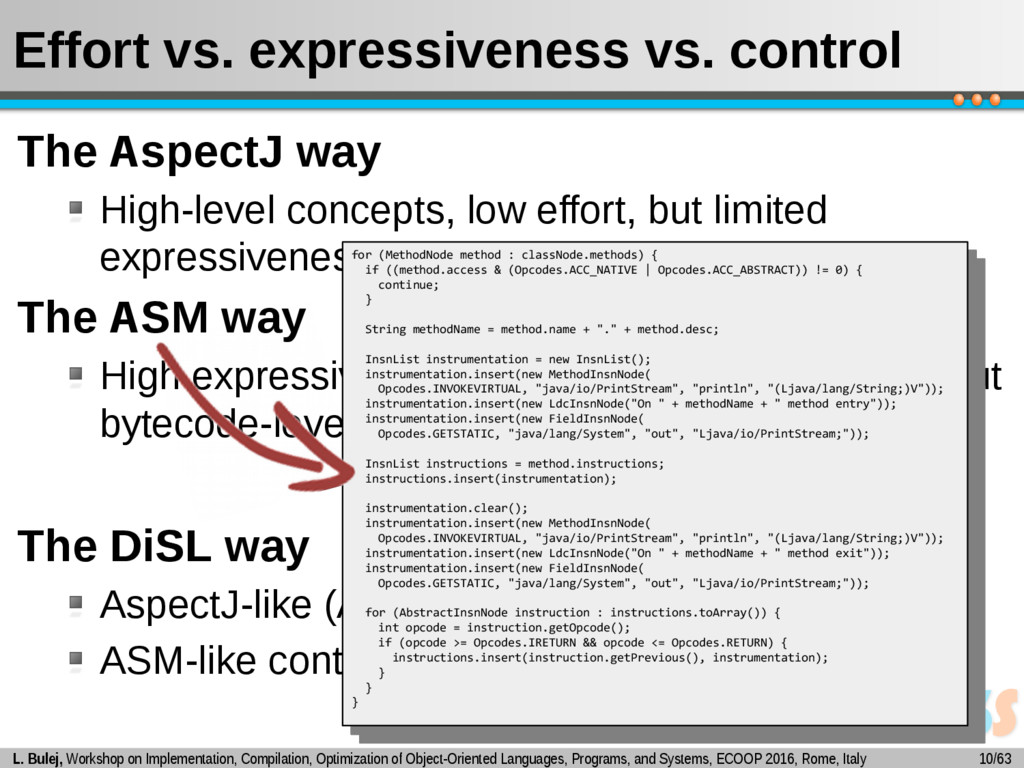
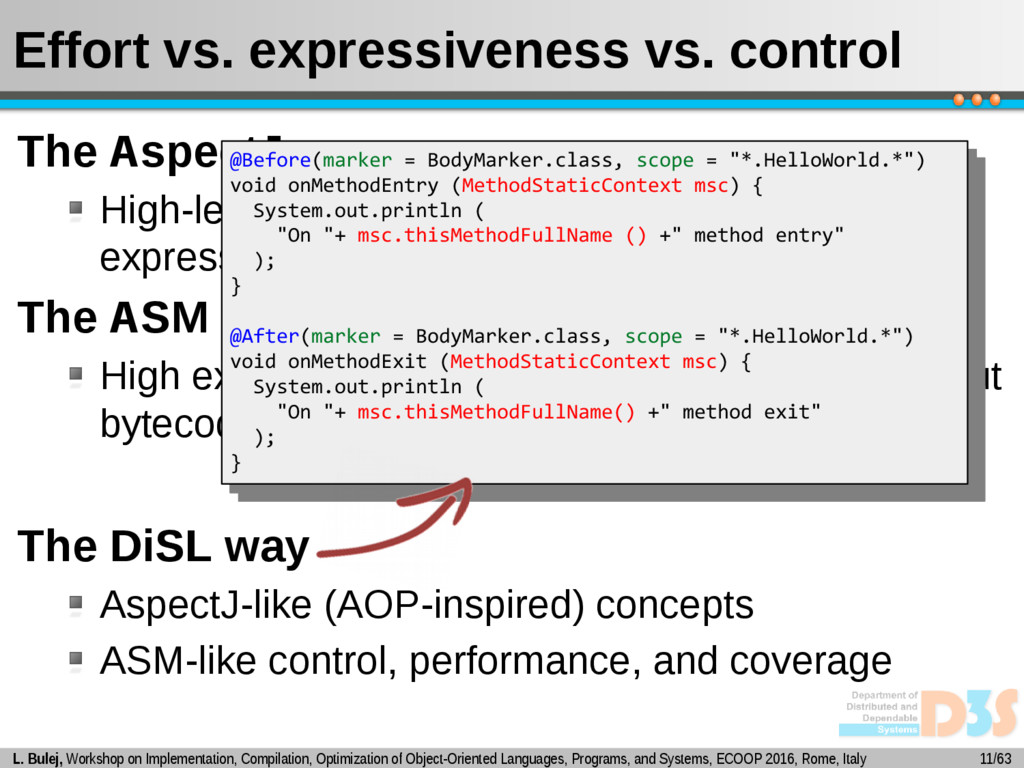
    Programs, and Systems, ECOOP 2016, Rome, Italy 10/63 Effort vs. expressiveness vs. control The AspectJ way High-level concepts, low effort, but limited expressiveness, control, and performance The ASM way High expressiveness, control, and performance, but bytecode-level concepts and high effort The DiSL way AspectJ-like (AOP-inspired) concepts ASM-like control, performance, and coverage for (MethodNode method : classNode.methods) { if ((method.access & (Opcodes.ACC_NATIVE | Opcodes.ACC_ABSTRACT)) != 0) { continue; } String methodName = method.name + "." + method.desc; InsnList instrumentation = new InsnList(); instrumentation.insert(new MethodInsnNode( Opcodes.INVOKEVIRTUAL, "java/io/PrintStream", "println", "(Ljava/lang/String;)V")); instrumentation.insert(new LdcInsnNode("On " + methodName + " method entry")); instrumentation.insert(new FieldInsnNode( Opcodes.GETSTATIC, "java/lang/System", "out", "Ljava/io/PrintStream;")); InsnList instructions = method.instructions; instructions.insert(instrumentation); instrumentation.clear(); instrumentation.insert(new MethodInsnNode( Opcodes.INVOKEVIRTUAL, "java/io/PrintStream", "println", "(Ljava/lang/String;)V")); instrumentation.insert(new LdcInsnNode("On " + methodName + " method exit")); instrumentation.insert(new FieldInsnNode( Opcodes.GETSTATIC, "java/lang/System", "out", "Ljava/io/PrintStream;")); for (AbstractInsnNode instruction : instructions.toArray()) { int opcode = instruction.getOpcode(); if (opcode >= Opcodes.IRETURN && opcode <= Opcodes.RETURN) { instructions.insert(instruction.getPrevious(), instrumentation); } } } for (MethodNode method : classNode.methods) { if ((method.access & (Opcodes.ACC_NATIVE | Opcodes.ACC_ABSTRACT)) != 0) { continue; } String methodName = method.name + "." + method.desc; InsnList instrumentation = new InsnList(); instrumentation.insert(new MethodInsnNode( Opcodes.INVOKEVIRTUAL, "java/io/PrintStream", "println", "(Ljava/lang/String;)V")); instrumentation.insert(new LdcInsnNode("On " + methodName + " method entry")); instrumentation.insert(new FieldInsnNode( Opcodes.GETSTATIC, "java/lang/System", "out", "Ljava/io/PrintStream;")); InsnList instructions = method.instructions; instructions.insert(instrumentation); instrumentation.clear(); instrumentation.insert(new MethodInsnNode( Opcodes.INVOKEVIRTUAL, "java/io/PrintStream", "println", "(Ljava/lang/String;)V")); instrumentation.insert(new LdcInsnNode("On " + methodName + " method exit")); instrumentation.insert(new FieldInsnNode( Opcodes.GETSTATIC, "java/lang/System", "out", "Ljava/io/PrintStream;")); for (AbstractInsnNode instruction : instructions.toArray()) { int opcode = instruction.getOpcode(); if (opcode >= Opcodes.IRETURN && opcode <= Opcodes.RETURN) { instructions.insert(instruction.getPrevious(), instrumentation); } } }
  11. L. Bulej, Workshop on Implementation, Compilation, Optimization of Object-Oriented Languages,

    Programs, and Systems, ECOOP 2016, Rome, Italy 11/63 Effort vs. expressiveness vs. control The AspectJ way High-level concepts, low effort, but limited expressiveness, control, and performance The ASM way High expressiveness, control, and performance, but bytecode-level concepts and high effort The DiSL way AspectJ-like (AOP-inspired) concepts ASM-like control, performance, and coverage @Before(marker = BodyMarker.class, scope = "*.HelloWorld.*") void onMethodEntry (MethodStaticContext msc) { System.out.println ( "On "+ msc.thisMethodFullName () +" method entry" ); } @After(marker = BodyMarker.class, scope = "*.HelloWorld.*") void onMethodExit (MethodStaticContext msc) { System.out.println ( "On "+ msc.thisMethodFullName() +" method exit" ); } @Before(marker = BodyMarker.class, scope = "*.HelloWorld.*") void onMethodEntry (MethodStaticContext msc) { System.out.println ( "On "+ msc.thisMethodFullName () +" method entry" ); } @After(marker = BodyMarker.class, scope = "*.HelloWorld.*") void onMethodExit (MethodStaticContext msc) { System.out.println ( "On "+ msc.thisMethodFullName() +" method exit" ); }
  12. L. Bulej, Workshop on Implementation, Compilation, Optimization of Object-Oriented Languages,

    Programs, and Systems, ECOOP 2016, Rome, Italy 12/63 Briefly about DiSL Anything can be instrumented High coverage (the Java Class Library is not sacred) User retains control over instrumentation What you see is what gets inserted Java as instrumentation language Java code snippets to be inserted User-defined guards for fine-grained scope control User-defined markers and static contexts Needs to be isolated from the base program Java code executed during load-time instrumentation
  13. L. Bulej, Workshop on Implementation, Compilation, Optimization of Object-Oriented Languages,

    Programs, and Systems, ECOOP 2016, Rome, Italy 13/63 DiSL high-level architecture [1] L. Marek, A. Villazón, Y. Zheng, D. Ansaloni, W. Binder, and Z. Qi. DiSL: a domain-specific language for bytecode instrumentation. AOSD’12.
  14. L. Bulej, Workshop on Implementation, Compilation, Optimization of Object-Oriented Languages,

    Programs, and Systems, ECOOP 2016, Rome, Italy 14/63 PHASE_START The trouble with internal observation and the birth of ShadowVM.
  15. L. Bulej, Workshop on Implementation, Compilation, Optimization of Object-Oriented Languages,

    Programs, and Systems, ECOOP 2016, Rome, Italy 15/63 Internal observation begets trouble Analysis shares the JVM with the base program Not endorsed, yet common practice with many DPA tools Problems awaiting the unwary Order of loaded classes Deadlock on non-wait-free analyses State corruption of non-reentrant code Calling methods on base-program state VM crashes with plausible instrumentation Spurious bytecode verification failures Coverage under-approximations Reference-handler over-analysis [2] S. Kell, D. Ansaloni, W. Binder, and L. Marek. The JVM is not observable enough (and what to do about it). VMIL’12.
  16. L. Bulej, Workshop on Implementation, Compilation, Optimization of Object-Oriented Languages,

    Programs, and Systems, ECOOP 2016, Rome, Italy 16/63 Real obstacles, not just quirks Reducing observation scope: work-around Cost: increased coverage under-approximation Polymorphic bytecode instrumentation: band-aid Avoids instrumentation reentrancy issues Helps surviving VM bootstrap with instrumented JCL Cost: duplicated method bodies, coverage under-approximation The ShadowVM way: priceless Minimal instrumentation to reify events and capture context Analysis executing in a separate JVM (ShadowVM) Cost: marshalling, transport, dispatching, ... [3] P. Moret, W. Binder, and E. Tanter. Polymorphic bytecode instrumentation. AOSD’10.
  17. L. Bulej, Workshop on Implementation, Compilation, Optimization of Object-Oriented Languages,

    Programs, and Systems, ECOOP 2016, Rome, Italy 17/63 Real obstacles, not just quirks Reducing observation scope: work-around Cost: increased coverage under-approximation Polymorphic bytecode instrumentation: band-aid Avoids instrumentation reentrancy issues Helps surviving VM bootstrap with instrumented JCL Cost: duplicated method bodies, coverage under-approximation The ShadowVM way: priceless Minimal instrumentation to reify events and capture context Analysis executing in a separate JVM (ShadowVM) Cost: marshalling, transport, dispatching, ... [3] P. Moret, W. Binder, and E. Tanter. Polymorphic bytecode instrumentation. AOSD’10. @AfterReturning(marker=BytecodeMarker.class, args="new") public static void onObjectAllocation ( DynamicContext dc, AllocationSiteStaticContext sc ) { // Snatch the allocated object from the top of // the stack and transmit the event to analysis. AllocationCounterStub.onObjectAllocation ( dc.getStackValue (0, Object.class), sc.getAllocationSiteId () ); } @AfterReturning(marker=BytecodeMarker.class, args="new") public static void onObjectAllocation ( DynamicContext dc, AllocationSiteStaticContext sc ) { // Snatch the allocated object from the top of // the stack and transmit the event to analysis. AllocationCounterStub.onObjectAllocation ( dc.getStackValue (0, Object.class), sc.getAllocationSiteId () ); }
  18. L. Bulej, Workshop on Implementation, Compilation, Optimization of Object-Oriented Languages,

    Programs, and Systems, ECOOP 2016, Rome, Italy 18/63 Real obstacles, not just quirks Reducing observation scope: work-around Cost: increased coverage under-approximation Polymorphic bytecode instrumentation: band-aid Avoids instrumentation reentrancy issues Helps surviving VM bootstrap with instrumented JCL Cost: duplicated method bodies, coverage under-approximation The ShadowVM way: priceless Minimal instrumentation to reify events and capture context Analysis executing in a separate JVM (ShadowVM) Cost: marshalling, transport, dispatching, ... [3] P. Moret, W. Binder, and E. Tanter. Polymorphic bytecode instrumentation. AOSD’10. public class AllocationCountAnalysis extends RemoteAnalysis { public void onObjectAllocation (ShadowObject obj, ShadowString site) { __getCounter (obj.getShadowClass (), site).incrementAndGet (); } private AtomicLong __getCounter (ShadowClass sc, ShadowString site) { // Get/create ConcurrentHashMap <ShadowString, AtomicLong> // associated with the ShadowClass (it’s a ShadowObject). return sc.computeStateIfAbsent (...).computeIfAbsent (site, ...); } } public class AllocationCountAnalysis extends RemoteAnalysis { public void onObjectAllocation (ShadowObject obj, ShadowString site) { __getCounter (obj.getShadowClass (), site).incrementAndGet (); } private AtomicLong __getCounter (ShadowClass sc, ShadowString site) { // Get/create ConcurrentHashMap <ShadowString, AtomicLong> // associated with the ShadowClass (it’s a ShadowObject). return sc.computeStateIfAbsent (...).computeIfAbsent (site, ...); } }
  19. L. Bulej, Workshop on Implementation, Compilation, Optimization of Object-Oriented Languages,

    Programs, and Systems, ECOOP 2016, Rome, Italy 19/63 ShadowVM high-level architecture Observed JVM JVMTI agent Instrumented base program Instrumented Java class library Event API (JNI) instrumentation process Instrumentation JVM Instrumentation server Java class library Instrumentation classes Instrumentation framework 2 analysis process Analysis JVM Analysis server Java class library Analysis classes Shadow API classes 3 observed process 1 [4] L. Marek, S. Kell, Y. Zheng, L. Bulej, W. Binder, P. Tůma, D. Ansaloni, A. Sarimbekov, and A. Sewe. ShadowVM: Robust and comprehensive dynamic program analysis for the Java platform. GPCE’13.
  20. L. Bulej, Workshop on Implementation, Compilation, Optimization of Object-Oriented Languages,

    Programs, and Systems, ECOOP 2016, Rome, Italy 20/63 Briefly about ShadowVM Base-program JVM: Event API (native) Marshal data and send events to analysis JVM Analysis JVM: RemoteAnalysis + Shadow API Lifecycle events from base-program JVM Shadows of objects in base-program JVM Mostly identity only, allows attaching state information Avoids/mitigates many observability issues Some tip-toeing still around critical classes Allows near-full coverage without dynamic bypass Recast of ElephantTracks (DiSL + ShadowVM) Producing events ~ 600 LOC vs 6.6k LOC (original) Analyzing events ~ 1.6k LOC vs 2.7k LOC (original)
  21. L. Bulej, Workshop on Implementation, Compilation, Optimization of Object-Oriented Languages,

    Programs, and Systems, ECOOP 2016, Rome, Italy 21/63 PHASE_LIVE Looking beneath the bytecode. [5] Y. Zheng, L. Bulej, and W. Binder. Accurate profiling in presence of Dynamic Compilation. OOPSLA’15.
  22. L. Bulej, Workshop on Implementation, Compilation, Optimization of Object-Oriented Languages,

    Programs, and Systems, ECOOP 2016, Rome, Italy 22/63 Bytecode Dynamic compilation makes JVM fast Instrumented code runs at (full speed – overhead) ... Interpreter Dynamic Compiler JVM Bytecode Instrumented Bytecode Target bytecode Inserted code Treated equally as the base-program code. Is it good or bad?
  23. L. Bulej, Workshop on Implementation, Compilation, Optimization of Object-Oriented Languages,

    Programs, and Systems, ECOOP 2016, Rome, Italy 23/63 The compiler is color blind The compiler optimizes all bytecode No distinction between base-program and inserted code Target bytecode can be moved/optimized away The inserted bytecode stays where it was Observing what does not happen anymore The inserted bytecode should have been moved or removed Target bytecode cannot be moved/optimized away The inserted bytecode prevented the optimization Observing what would not normally happen The inserted bytecode should have been ignored (if possible)
  24. L. Bulej, Workshop on Implementation, Compilation, Optimization of Object-Oriented Languages,

    Programs, and Systems, ECOOP 2016, Rome, Italy 24/63 if new A foo() … cond Example of perturbed optimization Java snippet IR graph A a = new A(); if (cond) { // 10% taken a.foo(); // “a” escapes }
  25. L. Bulej, Workshop on Implementation, Compilation, Optimization of Object-Oriented Languages,

    Programs, and Systems, ECOOP 2016, Rome, Italy 25/63 Example: normal execution if new A new A foo() … cond Java snippet Partial escape analysis Heap allocation moved into condition body, otherwise “A” gets allocated on the stack [6] L. Stadler, T. Würthinger, and H. Mössenböck. Partial Escape Analysis and Scalar Replacement for Java. CGO'14. IR graph A a = new A(); if (cond) { // 10% taken a.foo(); // “a” escapes }
  26. L. Bulej, Workshop on Implementation, Compilation, Optimization of Object-Oriented Languages,

    Programs, and Systems, ECOOP 2016, Rome, Italy 26/63 Example: counting allocations if new A Emit new A foo() … cond Java snippet After 1000 executions Without instrumentation 100 allocations occurred With instrumentation 100 allocations occurred 1000 allocations counted A a = new A(); EmitAllocEvent(); if (cond) { // 10% taken a.foo(); // a escapes } IR graph
  27. L. Bulej, Workshop on Implementation, Compilation, Optimization of Object-Oriented Languages,

    Programs, and Systems, ECOOP 2016, Rome, Italy 27/63 Example: observing allocations if Emit new A foo() … cond A a = new A(); EmitAllocEvent(a); if (cond) { // 10% taken a.foo(); // a escapes } Interested in the allocated object. IR graph Java snippet After 1000 executions Without instrumentation 100 allocations occurred With instrumentation 1000 allocations occurred 1000 allocations observed
  28. L. Bulej, Workshop on Implementation, Compilation, Optimization of Object-Oriented Languages,

    Programs, and Systems, ECOOP 2016, Rome, Italy 28/63 Perturbation leads to inaccurate data Example: modeling GC performance Simplified trace-based simulation vs JVM with JIT [7] P. Libič, L. Bulej, V. Horký, and P. Tůma. On the limits of modeling generational garbage collector performance. ICPE’14. Workload: fop Good Simulated minor GC counts close to reality.
  29. L. Bulej, Workshop on Implementation, Compilation, Optimization of Object-Oriented Languages,

    Programs, and Systems, ECOOP 2016, Rome, Italy 29/63 Example: modeling GC performance Simplified trace-based simulation vs JVM with JIT [7] P. Libič, L. Bulej, V. Horký, and P. Tůma. On the limits of modeling generational garbage collector performance. ICPE’14. Perturbation leads to inaccurate data Workload: multifop Bad Simulated minor GC counts far from reality. Input trace data contain over-profiled allocations. More frequent minor GC counts predicted.
  30. L. Bulej, Workshop on Implementation, Compilation, Optimization of Object-Oriented Languages,

    Programs, and Systems, ECOOP 2016, Rome, Italy 30/63 Instrumentation needs special care What we want the compiler to do Isolate instrumentation code from base-program Ignore instrumentation in optimization decisions Adapt instrumentation to compiler optimizations Allow instrumentation to query compiler decisions Assuming modern compiler (e.g. Graal) Method as compilation units IR-based compilation Graph-based IR in SSA form Dedicated IR nodes for method entry/exit Dedicated IR nodes for merging control flows Single-tier compilation
  31. L. Bulej, Workshop on Implementation, Compilation, Optimization of Object-Oriented Languages,

    Programs, and Systems, ECOOP 2016, Rome, Italy 31/63 Solution approach What the compiler actually needs to do Recognize delimitation API for instrumentation Extract inserted code from the base-program IR Inserted Code sub-Graph (ICG) Associated with base-program IR node Weak data-flow edges Perform reconciling operations on ICGs In response to compiler’s operations on the base-program IR Splice ICGs back before generating machine code Provide API to allow querying compiler decisions
  32. L. Bulej, Workshop on Implementation, Compilation, Optimization of Object-Oriented Languages,

    Programs, and Systems, ECOOP 2016, Rome, Italy 32/63 Details: delimitation API Allows identifying instrumentation code instrumentationBegin (PRED | SUCC | HERE) marks the begin of a block of inserted code PRED: associates the ICG to the preceding IR node SUCC: associates the ICG to the succeeding IR node HERE: anchors the ICG to its original location InstrumentationEnd () marks the end of a block of inserted code
  33. L. Bulej, Workshop on Implementation, Compilation, Optimization of Object-Oriented Languages,

    Programs, and Systems, ECOOP 2016, Rome, Italy 33/63 Details: reconciling operations Node elimination Remove associated ICGs Value replacement Update weak data-flow edges of ICGs Node cloning Clone associated ICGs Node expansion Update associated IR nodes of ICGs Node movement No reconciling operation needed ICG stays associated with the moved node Often implemented as clone + elimination
  34. L. Bulej, Workshop on Implementation, Compilation, Optimization of Object-Oriented Languages,

    Programs, and Systems, ECOOP 2016, Rome, Italy 34/63 Details: optimizations as compositions Partial escape analysis Node cloning + value replacement + node elimination Inlining Value replacement + node elimination Lowering value replacement + node expansion
  35. L. Bulej, Workshop on Implementation, Compilation, Optimization of Object-Oriented Languages,

    Programs, and Systems, ECOOP 2016, Rome, Italy 35/63 if foo() … cond Emit new A Example of ICG extraction Java snippet IR graph A a = new A(); instrumentationBegin(PRED); EmitAllocEvent(a); instrumentationEnd(); if (cond) { // 10% taken a.foo(); // “a” escapes }
  36. L. Bulej, Workshop on Implementation, Compilation, Optimization of Object-Oriented Languages,

    Programs, and Systems, ECOOP 2016, Rome, Italy 36/63 if foo() … cond Emit new A Emit new A Example of node cloning Java snippet IR graph A a = new A(); instrumentationBegin(PRED); EmitAllocEvent(a); instrumentationEnd(); if (cond) { // 10% taken a.foo(); // “a” escapes }
  37. L. Bulej, Workshop on Implementation, Compilation, Optimization of Object-Oriented Languages,

    Programs, and Systems, ECOOP 2016, Rome, Italy 37/63 if foo() … cond Emit Emit new A new A Example of value replacement Java snippet IR graph A a = new A(); instrumentationBegin(PRED); EmitAllocEvent(a); instrumentationEnd(); if (cond) { // 10% taken a.foo(); // “a” escapes }
  38. L. Bulej, Workshop on Implementation, Compilation, Optimization of Object-Oriented Languages,

    Programs, and Systems, ECOOP 2016, Rome, Italy 38/63 if foo() … cond Emit Emit new A new A Example of node elimination Java snippet IR graph A a = new A(); instrumentationBegin(PRED); EmitAllocEvent(a); instrumentationEnd(); if (cond) { // 10% taken a.foo(); // “a” escapes }
  39. L. Bulej, Workshop on Implementation, Compilation, Optimization of Object-Oriented Languages,

    Programs, and Systems, ECOOP 2016, Rome, Italy 39/63 Emit foo() if … cond new A Example of ICG splicing Java snippet IR graph A a = new A(); instrumentationBegin(PRED); EmitAllocEvent(a); instrumentationEnd(); if (cond) { // 10% taken a.foo(); // “a” escapes }
  40. L. Bulej, Workshop on Implementation, Compilation, Optimization of Object-Oriented Languages,

    Programs, and Systems, ECOOP 2016, Rome, Italy 40/63 Details: static/dynamic query intrinsics Query compiler decisions and runtime paths isMethodCompiled() returns true in compiled code isMethodInlined() returns true if the enclosing method is inlined getRootName() returns the name of the method being compiled getAllocType() returns the kind of heap allocation for a preceding associated allocation getLockType() returns the kind of lock type for a preceding associated lock acquisition
  41. L. Bulej, Workshop on Implementation, Compilation, Optimization of Object-Oriented Languages,

    Programs, and Systems, ECOOP 2016, Rome, Italy 41/63 Programming model 1.Wrap the instrumentation with invocations to the delimitation API (we have modified DiSL to automatically insert such invocations) 2.Choose associated bytecode, keeping in mind that inserted code will “follow” the bytecode (or its corresponding IR node) 3.Use isMethodCompiled() to limit the profiling to dynamically compiled code. 4.Use other query intrinsics to further limit the profiling scope or gather additional information.
  42. L. Bulej, Workshop on Implementation, Compilation, Optimization of Object-Oriented Languages,

    Programs, and Systems, ECOOP 2016, Rome, Italy 42/63 Example of usage: expected allocations Original instrumentation Inserted code treated as base-program code Equivalent delimited instrumentation Does not influence optimization decisions @AfterReturning(marker = BytecodeMarker.class, args = "new", order = 1) static void profileAllocation() { Profiler.profileAllocation(); } @AfterReturning(marker = BytecodeMarker.class, args = "new", order = 2) static void profileAllocation() { DelimitationAPI.instrumentationBegin(HERE); Profiler.profileAllocation(); DelimitationAPI.instrumentationEnd(); }
  43. L. Bulej, Workshop on Implementation, Compilation, Optimization of Object-Oriented Languages,

    Programs, and Systems, ECOOP 2016, Rome, Italy 43/63 Example of usage: actual allocations Counting allocations that actually occurred Inserted code follows the “new” node Inspecting the kind of actual allocations Query actual allocation path taken at runtime @AfterReturning(marker = BytecodeMarker.class, args = "new", order = 1) static void profileAllocation() { DelimitationAPI.instrumentationBegin(PRED); Profiler.profileAllocation(); DelimitationAPI.instrumentationEnd(); } @AfterReturning(marker = BytecodeMarker.class, args = "new", order = 1) static void profileAllocation() { DelimitationAPI.instrumentationBegin(PRED); Profiler.profileAllocation(CompilerDecision.getAllocType()); DelimitationAPI.instrumentationEnd(); }
  44. L. Bulej, Workshop on Implementation, Compilation, Optimization of Object-Oriented Languages,

    Programs, and Systems, ECOOP 2016, Rome, Italy 44/63 Now that we have it... We can improve the existing profilers.
  45. L. Bulej, Workshop on Implementation, Compilation, Optimization of Object-Oriented Languages,

    Programs, and Systems, ECOOP 2016, Rome, Italy 45/63 Allocation profiling (1) Stack allocation count and stack-allocated memory (in bytes)
  46. L. Bulej, Workshop on Implementation, Compilation, Optimization of Object-Oriented Languages,

    Programs, and Systems, ECOOP 2016, Rome, Italy 46/63 Allocation profiling (2) Over-profiled allocations for steady state (15th iteration)
  47. L. Bulej, Workshop on Implementation, Compilation, Optimization of Object-Oriented Languages,

    Programs, and Systems, ECOOP 2016, Rome, Italy 47/63 Life-time analysis: Sunflow (perturbed) Object life-time distribution. The bins on the left represent shorter-lived objects. The bin sizes are log-scaled.
  48. L. Bulej, Workshop on Implementation, Compilation, Optimization of Object-Oriented Languages,

    Programs, and Systems, ECOOP 2016, Rome, Italy 48/63 Life-time analysis: Sunflow (accurate) Object life-time distribution. The bins on the left represent shorter-lived objects. The bin sizes are log-scaled.
  49. L. Bulej, Workshop on Implementation, Compilation, Optimization of Object-Oriented Languages,

    Programs, and Systems, ECOOP 2016, Rome, Italy 49/63 Now that we have it... We can analyze new behavior.
  50. L. Bulej, Workshop on Implementation, Compilation, Optimization of Object-Oriented Languages,

    Programs, and Systems, ECOOP 2016, Rome, Italy 50/63 Actual (non-inlined) method calls (1) Over-profiled method calls. “Perturbed” includes inserted code when calculating target method size. “Accurate” does not.
  51. L. Bulej, Workshop on Implementation, Compilation, Optimization of Object-Oriented Languages,

    Programs, and Systems, ECOOP 2016, Rome, Italy 51/63 Actual (non-inlined) method calls (2) Over-profiled method calls. “Perturbed” includes inserted code when calculating target method size. “Accurate” does not.
  52. L. Bulej, Workshop on Implementation, Compilation, Optimization of Object-Oriented Languages,

    Programs, and Systems, ECOOP 2016, Rome, Italy 52/63 Hot non-inlined call sites Reasons for not inlining a call-site: #1: too many receiver types, but profiled types not frequent enough #2: wanted to inline one or more targets, but total size is over limit
  53. L. Bulej, Workshop on Implementation, Compilation, Optimization of Object-Oriented Languages,

    Programs, and Systems, ECOOP 2016, Rome, Italy 53/63 Receiver-types at non-inlined call sites Percentages of invocations at non-inlined call sites for which the receiver type can be resolved with 1–3 levels of calling context.
  54. L. Bulej, Workshop on Implementation, Compilation, Optimization of Object-Oriented Languages,

    Programs, and Systems, ECOOP 2016, Rome, Italy 54/63 Now that we have it... We can test compiler behavior from user code.
  55. L. Bulej, Workshop on Implementation, Compilation, Optimization of Object-Oriented Languages,

    Programs, and Systems, ECOOP 2016, Rome, Italy 55/63 Testing framework architecture
  56. L. Bulej, Workshop on Implementation, Compilation, Optimization of Object-Oriented Languages,

    Programs, and Systems, ECOOP 2016, Rome, Italy 56/63 Example PEA target code public void partialEscape(boolean cond) { A a = new A(); DelimitationAPI.instrumentationBegin(PRED); if (CompilerDecision.isMethodCompiled()) { isCompiled = true; counter++; } DelimitationAPI.instrumentationEnd(); if (cond) { a.bar(); // a escapes } } If compiled, count actual allocations associated with the previous IR node (the “new” instruction).
  57. L. Bulej, Workshop on Implementation, Compilation, Optimization of Object-Oriented Languages,

    Programs, and Systems, ECOOP 2016, Rome, Italy 57/63 Example PEA target code public void partialEscape(boolean cond) { A a = new A(); DelimitationAPI.instrumentationBegin(PRED); if (CompilerDecision.isMethodCompiled()) { isCompiled = true; counter++; } DelimitationAPI.instrumentationEnd(); if (cond) { a.bar(); // a escapes } }
  58. L. Bulej, Workshop on Implementation, Compilation, Optimization of Object-Oriented Languages,

    Programs, and Systems, ECOOP 2016, Rome, Italy 58/63 Example PEA test code public class PartialEscape extends JITTestCase { private boolean isCompiled = false; private int counter = 0; @Override protected void warmup() { partialEscape(likely(0.1)); } @Override protected boolean isWarmedUp() { return isCompiled; } @Test public void testPartialEscape() { counter = 0; for (int i = 0; i < 10000; i++) { partialEscape(likely(0.1)); } assertEquals(((double) counter) / 10000, 0.1, EPSILON); } ... Perform N invocations of partialEscape() with the value of condition becoming true on average (P × N) times and verify that actual allocation is performed only (P × N ± ε) times.
  59. L. Bulej, Workshop on Implementation, Compilation, Optimization of Object-Oriented Languages,

    Programs, and Systems, ECOOP 2016, Rome, Italy 59/63 Example PEA test code public class PartialEscape extends JITTestCase { private boolean isCompiled = false; private int counter = 0; @Override protected void warmup() { partialEscape(likely(0.1)); } @Override protected boolean isWarmedUp() { return isCompiled; } @Test public void testPartialEscape() { counter = 0; for (int i = 0; i < 10000; i++) { partialEscape(likely(0.1)); } assertEquals(((double) counter) / 10000, 0.1, EPSILON); } ...
  60. L. Bulej, Workshop on Implementation, Compilation, Optimization of Object-Oriented Languages,

    Programs, and Systems, ECOOP 2016, Rome, Italy 60/63 PHASE_DEAD A few words in closing...
  61. L. Bulej, Workshop on Implementation, Compilation, Optimization of Object-Oriented Languages,

    Programs, and Systems, ECOOP 2016, Rome, Italy 61/63 JVM is difficult to observe Optimized for execution, not observation Object tags kept in a globally locked hash map Creation of global references from native code In-process analysis inherently fragile Problems more likely with increasing coverage Careful tool design can mitigate problems Out-of-process analysis feasible but costly Compiler oblivious to instrumentation Causes over-profiling of optimized code Causes perturbation of optimizations
  62. L. Bulej, Workshop on Implementation, Compilation, Optimization of Object-Oriented Languages,

    Programs, and Systems, ECOOP 2016, Rome, Italy 62/63 JVM observability can be improved Instrumentation awareness is feasible Our changes merged into Graal Avoids perturbation of optimizations Allows looking beneath the bytecode Negligible impact on compilation time Improves accuracy, enables new tools Instrumentation is aware of compiler optimizations Actually executed runtime paths can be observed Some (fundamental) limitations remain Inserted code not executed atomically with the target code Global ordering of program events costly to capture
  63. L. Bulej, Workshop on Implementation, Compilation, Optimization of Object-Oriented Languages,

    Programs, and Systems, ECOOP 2016, Rome, Italy 63/63 Thank you! Much of this talk originated from the long-time work of my research colleagues, which I gratefully acknowledge. Any errors or omissions, alas, are mine. http://disl.ow2.org http://dag.inf.usi.ch/software/prof.acc http://openjdk.java.net/projects/graal/