Upgrade to Pro — share decks privately, control downloads, hide ads and more …

ITT 2015 - Kirk Pepperdine - The (not so) Dark Art of Performance Tuning, from Newts to Newton

ITT 2015 - Kirk Pepperdine - The (not so) Dark Art of Performance Tuning, from Newts to Newton

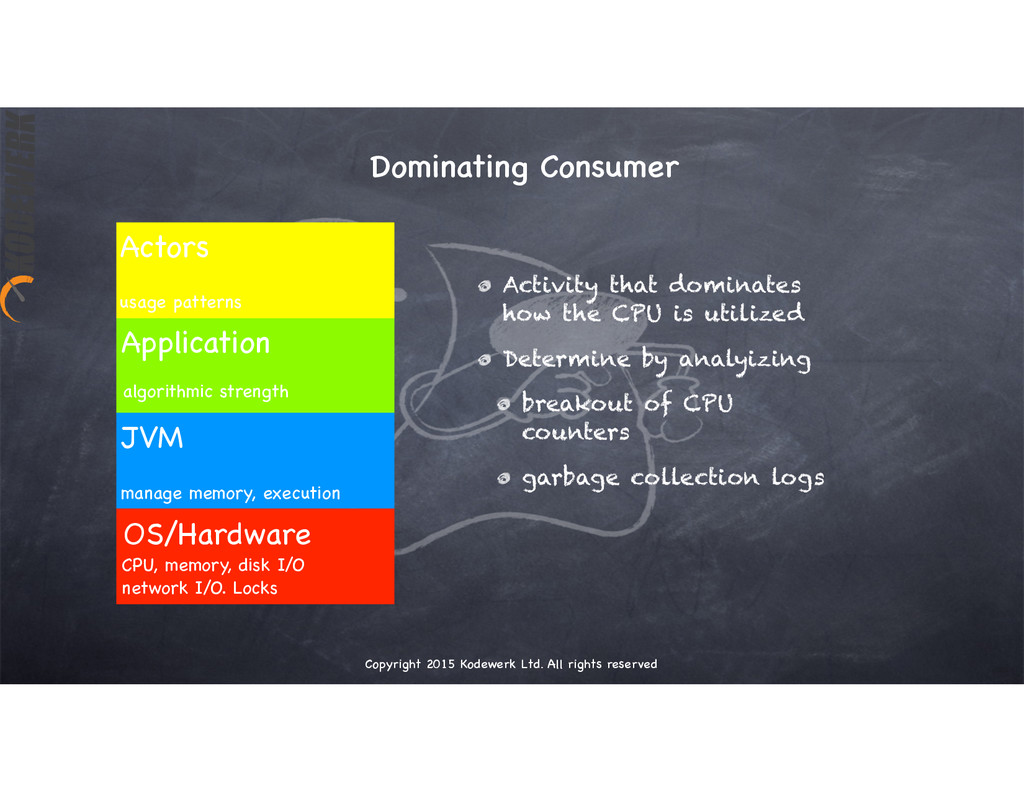
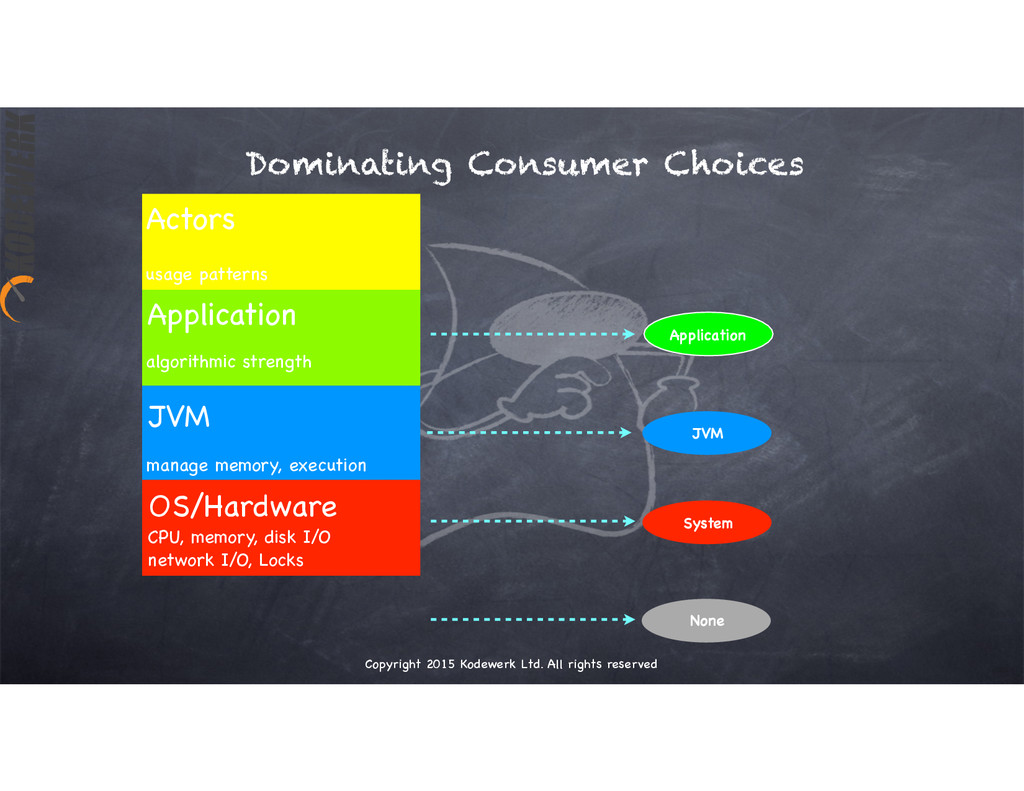
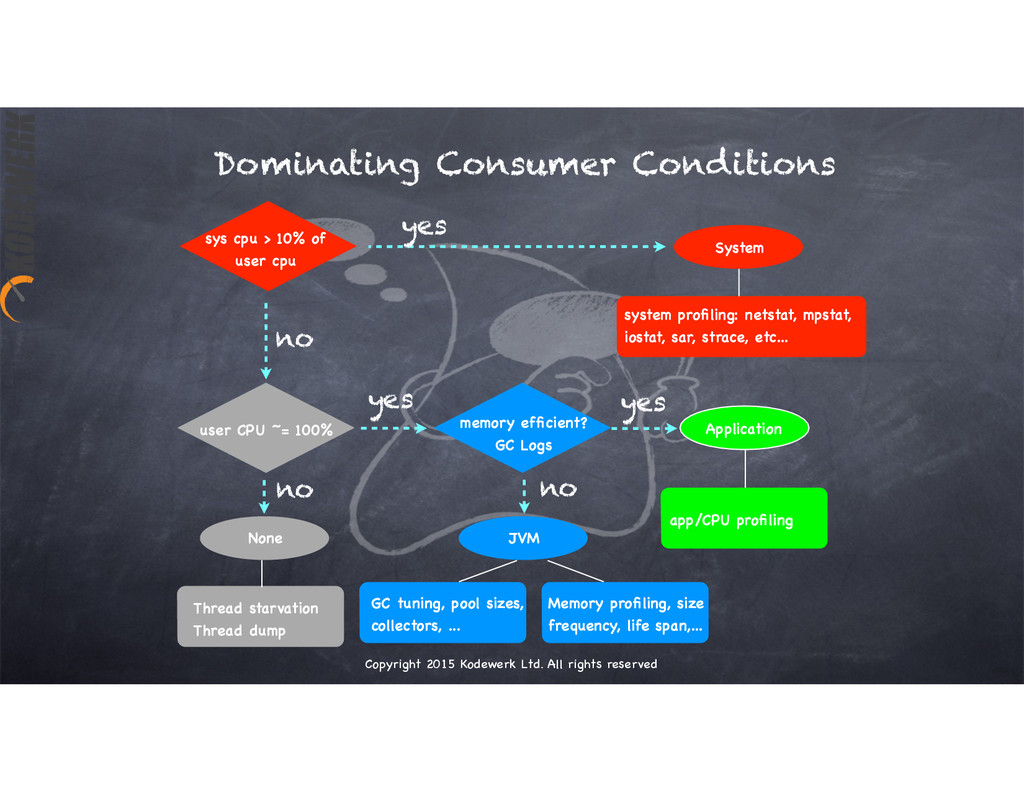
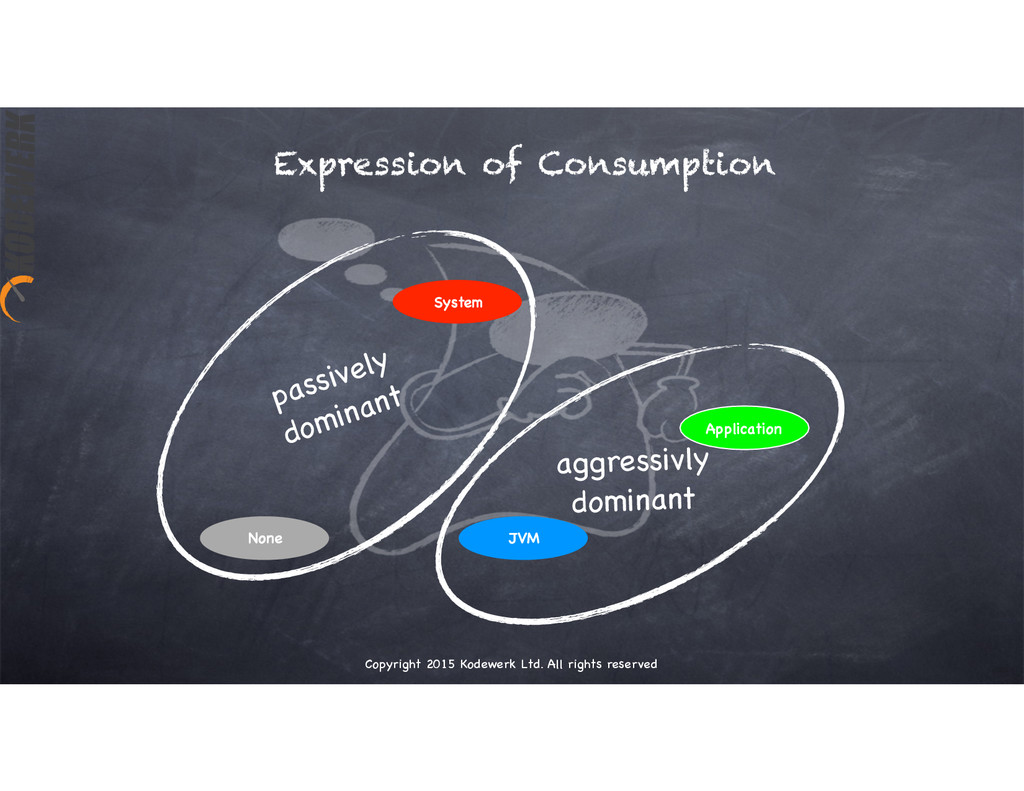
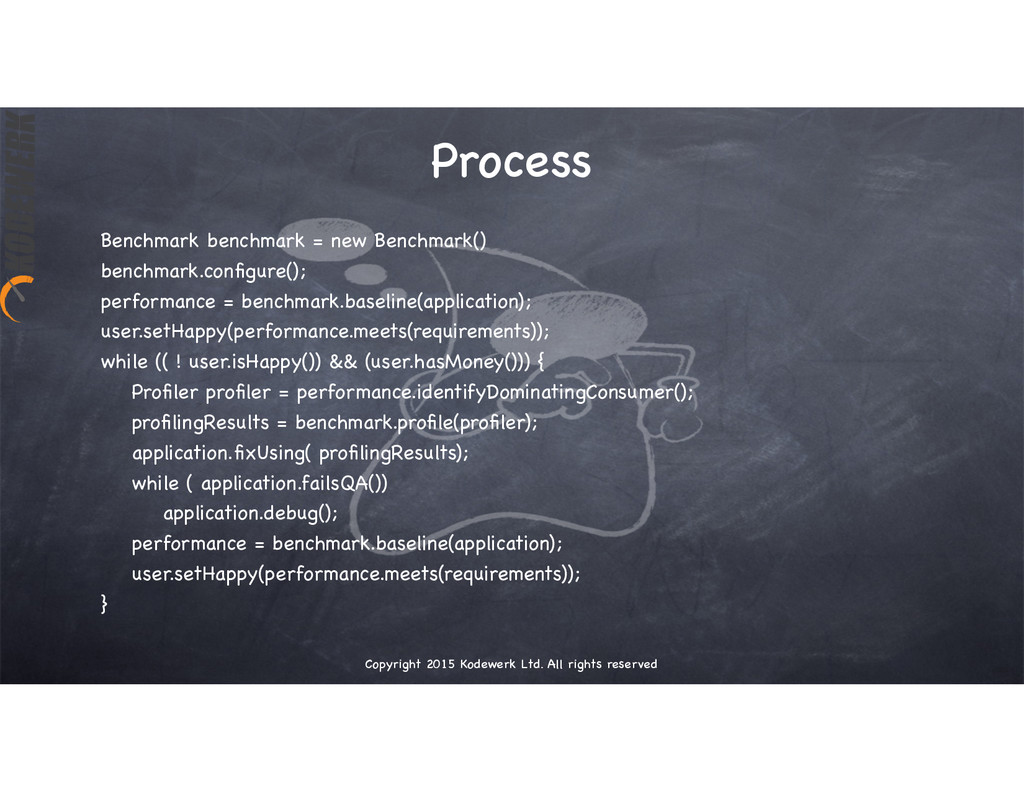
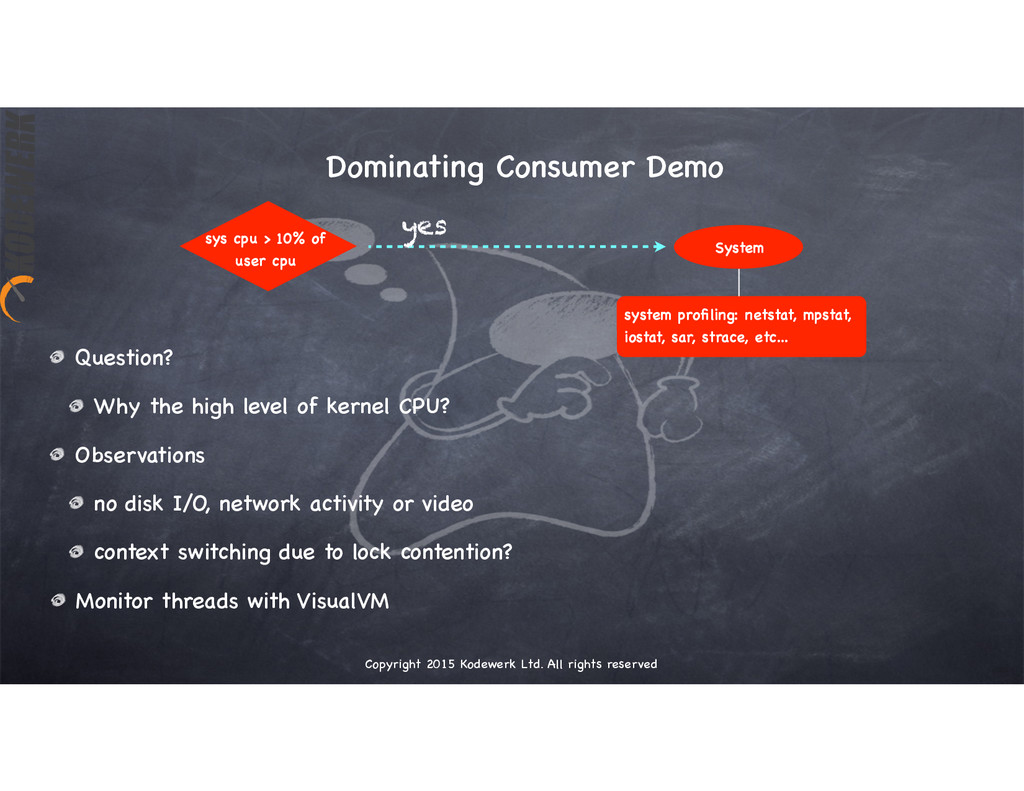
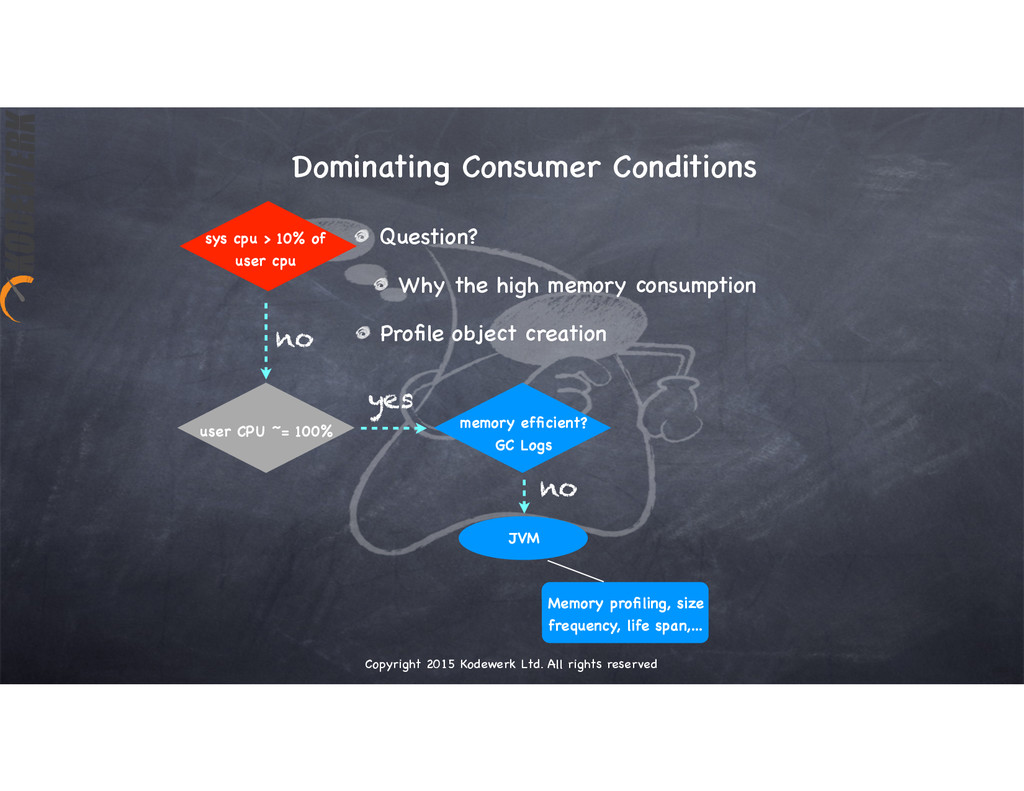
Performance optimization has always thought to be a fine art as it could not be easily formalized, or constrained into one solid workflow. However, there are common patterns all performance engineers could follow in their investigations. Kirk Pepperdine describes some approaches and tools to analyse modern application performance problems in J2SE and hardware.

Istanbul Tech Talks

April 27, 2015
Tweet

More Decks by Istanbul Tech Talks

Other Decks in Programming

Transcript

  1. Copyright 2015 Kodewerk Ltd. All rights reserved The (not so)

    Dark Art of Performance Tuning From Newts to Newton
  2. Copyright 2015 Kodewerk Ltd. All rights reserved Java Performance Tuning

    Workshops About Me Co-Founded jClarity Co-Founded www.javaperformancetuning.com Kodewerk Ltd Performance Consulting
  3. Copyright 2015 Kodewerk Ltd. All rights reserved Disclaimer The resemblance

    of any opinion, recommendation or comment made during this presentation to actual performance tuning advice is merely coincidental.
  4. Copyright 2015 Kodewerk Ltd. All rights reserved Our Typical Customer

    Application isn’t performing to project sponsors expectations users can wait for minutes for simply queries to complete Development team has been tuning for weeks no real improvement︙.
  5. Copyright 2015 Kodewerk Ltd. All rights reserved Finger Pointing Different

    team experts come to the table with different opinions I see StringBuffer is being used all over, lets change it to StringBuilder I think our DBMS is the problem, we need to migrate to [buzzword goes here] DBA claimed transactions are clearing very quickly Networking claims normal levels of saturation Server admin claims I/O channels are all ok but CPU is running hot no rouge applications are running along side application JEE Admin claims server is configured as it should be
  6. Copyright 2015 Kodewerk Ltd. All rights reserved Software is Abstract

    public class Software { public static void main( String[] args) { System.out.println(“Software is abstract”); } }
  7. Copyright 2015 Kodewerk Ltd. All rights reserved Physical Limits CPU

    capacity throughput : clock speed granularity: cache line Memory capacity : volume Bus throughput : clock speed width : 32 bits
  8. Copyright 2015 Kodewerk Ltd. All rights reserved Limits of Hardware

    disk ~1 Bbit/sec (SATA ~3Gbits/sec) granularity: disk sector (512 bytes) Network frame buffer/packet frequency (clock)
  9. Copyright 2015 Kodewerk Ltd. All rights reserved Other Limits other

    hardware devices video/sound heat battery time
  10. Copyright 2015 Kodewerk Ltd. All rights reserved public class Software

    { public static void main( String[] args) { System.out.println(“Software is abstract”); } }
  11. Copyright 2015 Kodewerk Ltd. All rights reserved Application Developers Live

    Here business logic, non-shareable soft resources
  12. Copyright 2015 Kodewerk Ltd. All rights reserved Question? Which is

    faster? a) Bubble sort b) Quick sort In Big O notation... - Bubble sort is N^2 - Quick sort of Nlog(N)
  13. Copyright 2015 Kodewerk Ltd. All rights reserved Performance Tuning The

    space can be humongous you can’t traverse it all assume something is or isn’t part of the problem
  14. Copyright 2015 Kodewerk Ltd. All rights reserved Believe it or

    not If youombine The source of the problem can be reasoned if you combine; the facts presented some understanding of how the OS/Hardware function an understanding of the JEE specification
  15. Copyright 2015 Kodewerk Ltd. All rights reserved Performance Tuning Methodology

    If youombine Prefer hypothesis free investigation be methodical step wise process to arrive at a conclusion Drive the process using a Performance Diagnostic Model
  16. Copyright 2015 Kodewerk Ltd. All rights reserved OS/Hardware JVM Application

    Applications Live Here CPU, memory, disk I/O network I/O, Locks manage memory, execution dynamics algorithmic strength
  17. Copyright 2015 Kodewerk Ltd. All rights reserved OS/Hardware JVM Application

    Actors Add Dynamics CPU, memory, disk I/O network I/O, Locks manage memory, execution Actors usage patterns algorithmic strength
  18. Copyright 2015 Kodewerk Ltd. All rights reserved OS/Hardware JVM Application

    Actors Hardware Consumption CPU, memory, disk I/O network I/O. Locks manage memory, execution usage patterns Actors drives application Application drives JVM JVM drives OS/Hardware Hardware is consumed function of how actors interact with system function of how application is coded consumption cannot exceed capacity pattern of consumption is important algorithmic strength
  19. Copyright 2015 Kodewerk Ltd. All rights reserved OS/Hardware JVM Application

    Actors Dominating Consumer CPU, memory, disk I/O network I/O. Locks manage memory, execution usage patterns algorithmic strength Activity that dominates how the CPU is utilized Determine by analyizing breakout of CPU counters garbage collection logs
  20. Copyright 2015 Kodewerk Ltd. All rights reserved Dominating Consumer Choices

    OS/Hardware Application Actors CPU, memory, disk I/O network I/O, Locks manage memory, execution algorithmic strength usage patterns Application JVM None System JVM
  21. Copyright 2015 Kodewerk Ltd. All rights reserved Dominating Consumer Conditions

    sys cpu > 10% of user cpu user CPU ~= 100% memory efficient? GC Logs Application JVM None System system profiling: netstat, mpstat, iostat, sar, strace, etc... Thread starvation Thread dump app/CPU profiling GC tuning, pool sizes, collectors, ... Memory profiling, size frequency, life span,... yes yes yes no no no
  22. Copyright 2015 Kodewerk Ltd. All rights reserved Expression of Consumption

    Application JVM None System passively dominant aggressivly dominant
  23. Copyright 2015 Kodewerk Ltd. All rights reserved r b swpd

    free buff cache si so bi bo in cs us sy id wa ! 3 9 100 24496 11096 13267036 0 0 0 5 0 1 2 1 96 1! 3 2 100 23420 11088 13268328 0 0 0 0 77330 175352 17 26 39 17! 3 9 100 20836 11088 13270628 0 0 0 68 105118 227382 14 40 21 25! 8 4 100 23356 11080 13268272 0 0 0 0 80062 164387 12 30 29 30! 7 7 100 23180 11084 13267068 0 0 0 72 98353 234851 15 43 28 15! 11 2 100 25820 11088 13263676 0 0 0 120 100749 214921 11 42 17 30! 13 1 100 22316 11088 13267176 0 0 0 0 103878 246723 16 56 19 9 ! 4 3 100 21824 11088 13269140 0 0 0 0 48625 97288 15 16 9 60! 11 2 100 20932 11080 13269808 0 0 0 0 110760 236774 14 41 24 20! 1 12 100 23624 11084 13267488 0 0 0 204 69117 148611 15 27 25 33! 7 5 100 24996 11096 13267476 0 0 0 164 24495 48552 13 10 30 48! 1 12 100 20792 11096 13271872 0 0 0 0 25659 54331 8 9 26 56! 6 8 100 21984 11080 13269920 0 0 0 20 46309 101404 16 18 51 15! 4 9 100 22764 11080 13268956 0 0 16 0 88553 229557 17 35 38 11
  24. Copyright 2015 Kodewerk Ltd. All rights reserved Actors Test harness

    Application JVM Hardware/OS Data Monitoring Things we need
  25. Copyright 2015 Kodewerk Ltd. All rights reserved Process Benchmark benchmark

    = new Benchmark() benchmark.configure(); performance = benchmark.baseline(application); user.setHappy(performance.meets(requirements)); while (( ! user.isHappy()) && (user.hasMoney())) { Profiler profiler = performance.identifyDominatingConsumer(); profilingResults = benchmark.profile(profiler); application.fixUsing( profilingResults); while ( application.failsQA()) application.debug(); performance = benchmark.baseline(application); user.setHappy(performance.meets(requirements)); }
  26. Copyright 2015 Kodewerk Ltd. All rights reserved Dominating Consumer Demo

    sys cpu > 10% of user cpu System system profiling: netstat, mpstat, iostat, sar, strace, etc... yes Question? Why the high level of kernel CPU? Observations no disk I/O, network activity or video context switching due to lock contention? Monitor threads with VisualVM
  27. Copyright 2015 Kodewerk Ltd. All rights reserved Dominating Consumer Conditions

    sys cpu > 10% of user cpu user CPU ~= 100% memory efficient? GC Logs JVM Memory profiling, size frequency, life span,... yes no no Question? Why the high memory consumption Profile object creation
  28. Copyright 2015 Kodewerk Ltd. All rights reserved What about our

    Customer? Need to gather clear requirements Develop a sound benchmarking environment get better measurements Always identify dominating consumer refocus teams on problems that matter