Upgrade to Pro — share decks privately, control downloads, hide ads and more …

ITT 2019 - Mark West - A Practical(ish) Introduction to Data Science

ITT 2019 - Mark West - A Practical(ish) Introduction to Data Science

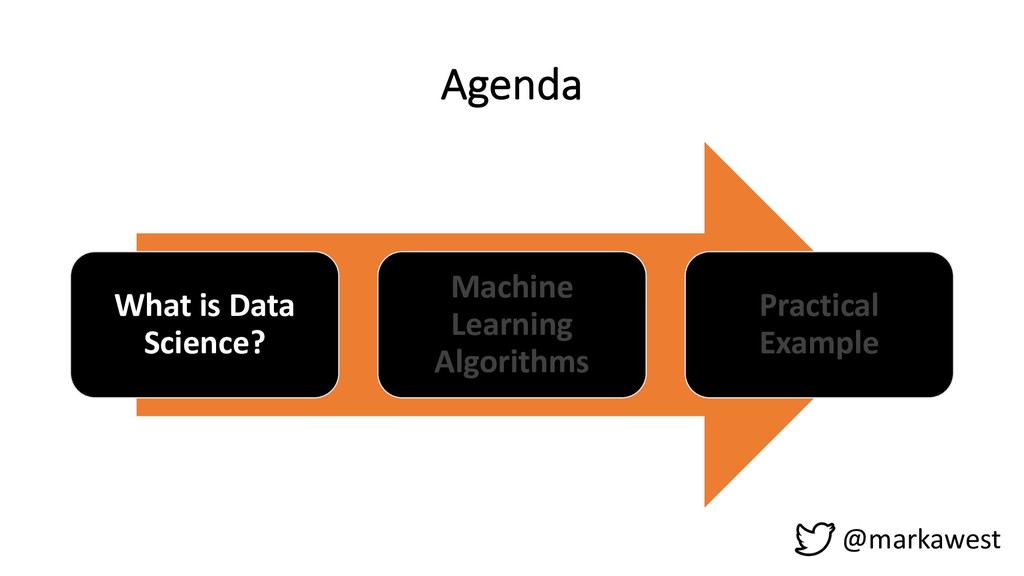
In this talk I will share insights and knowledge that I have gained from building up a Data Science department from scratch. This talk will be split into three sections:
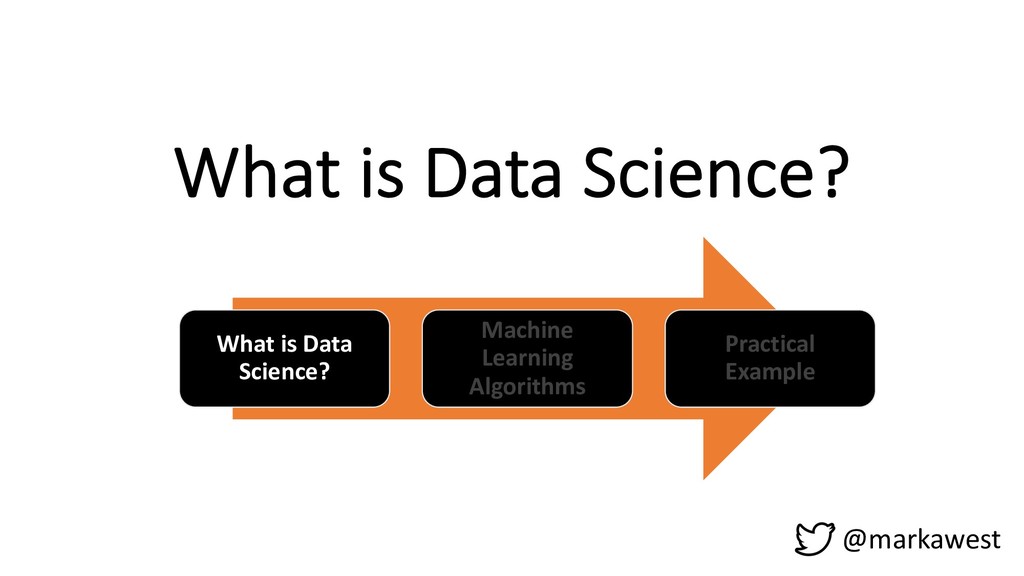
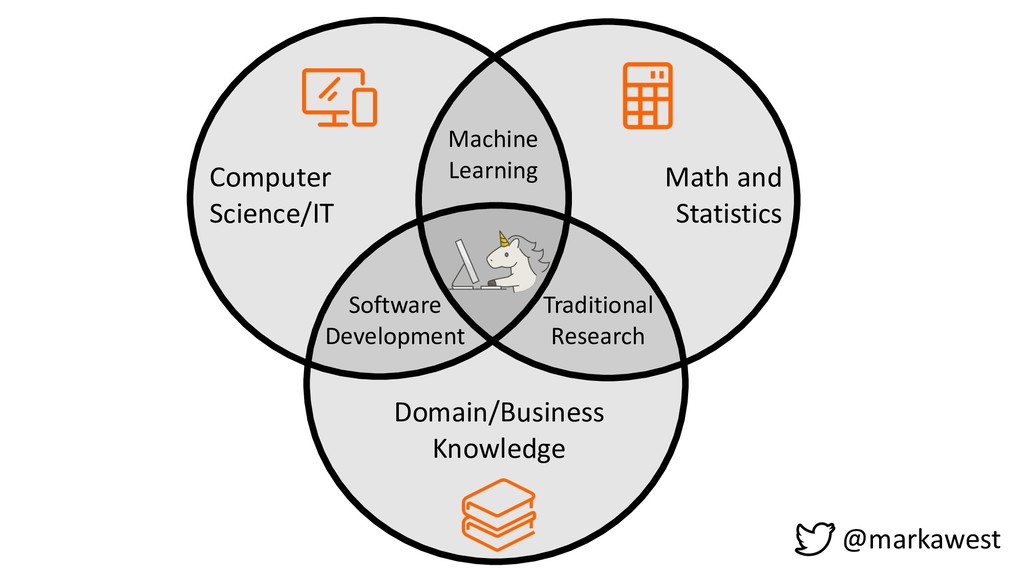
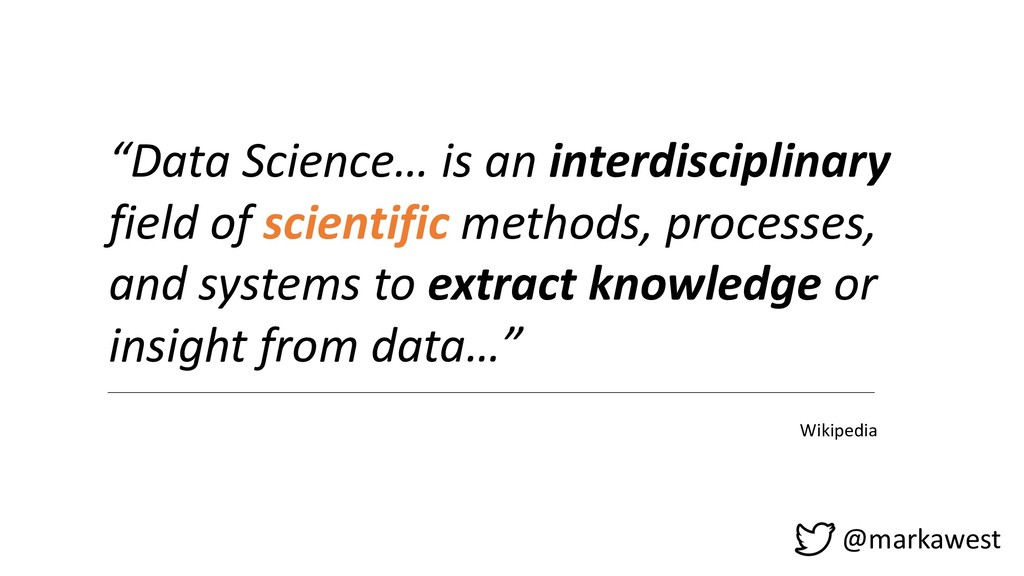
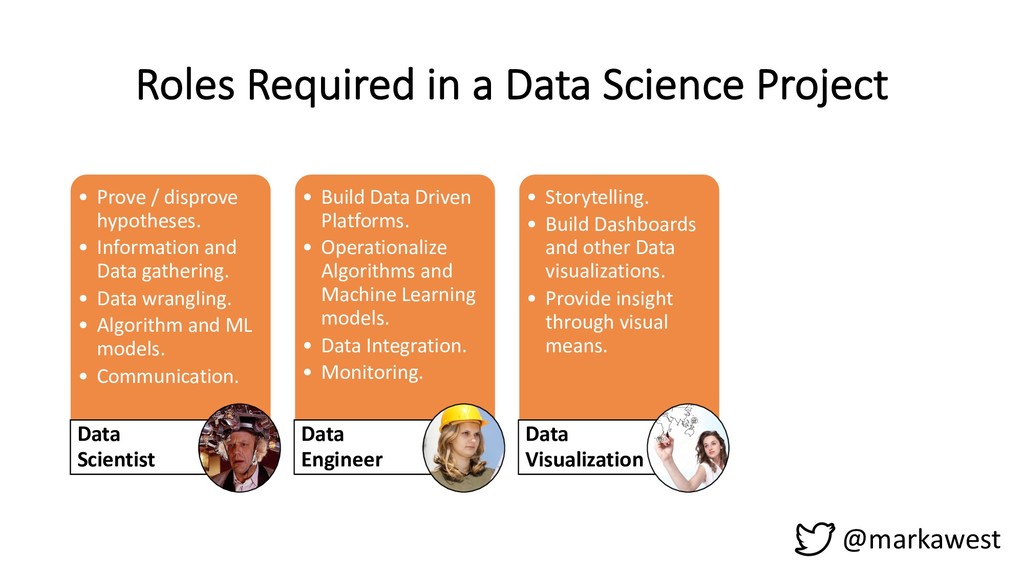
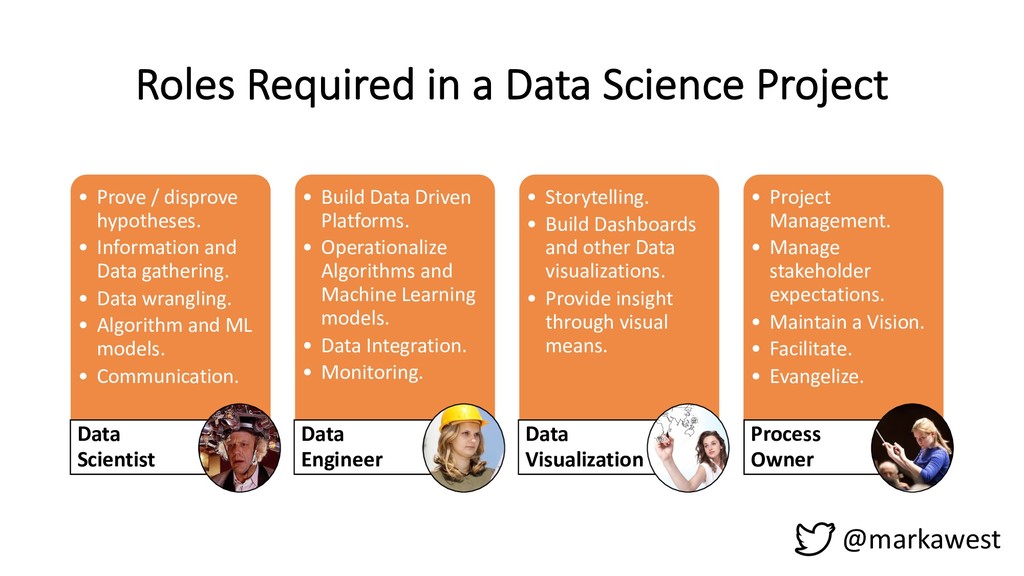
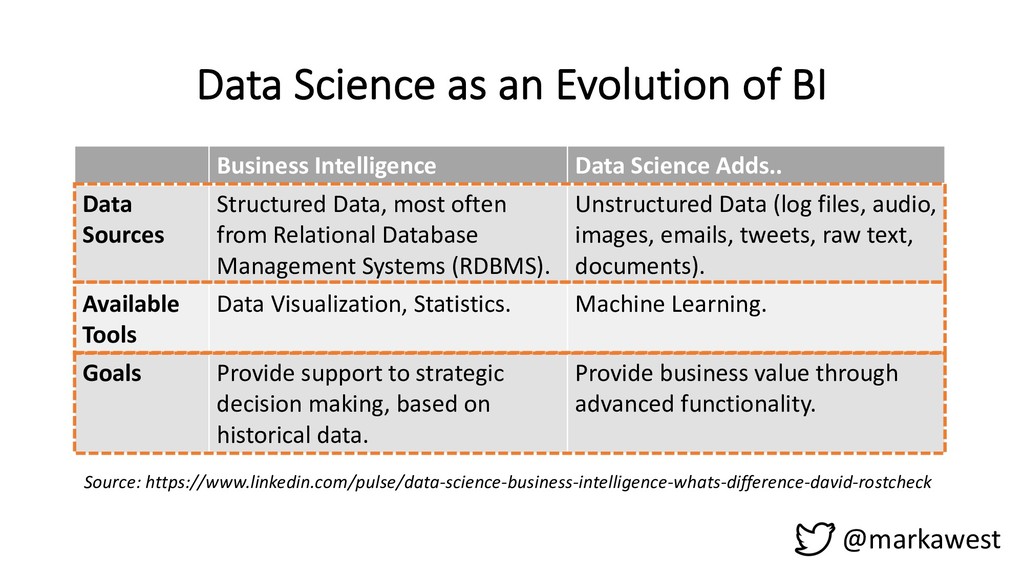
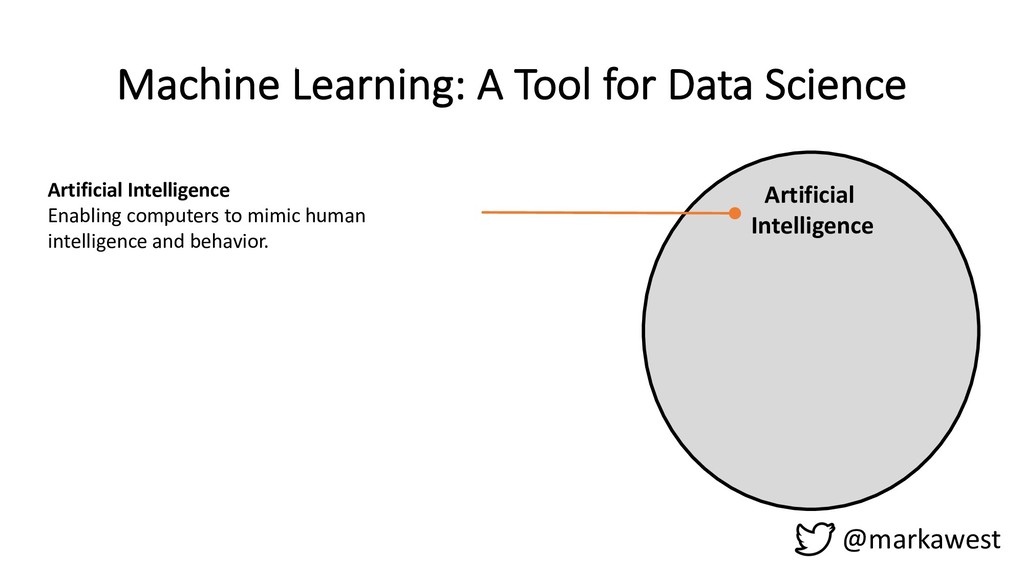
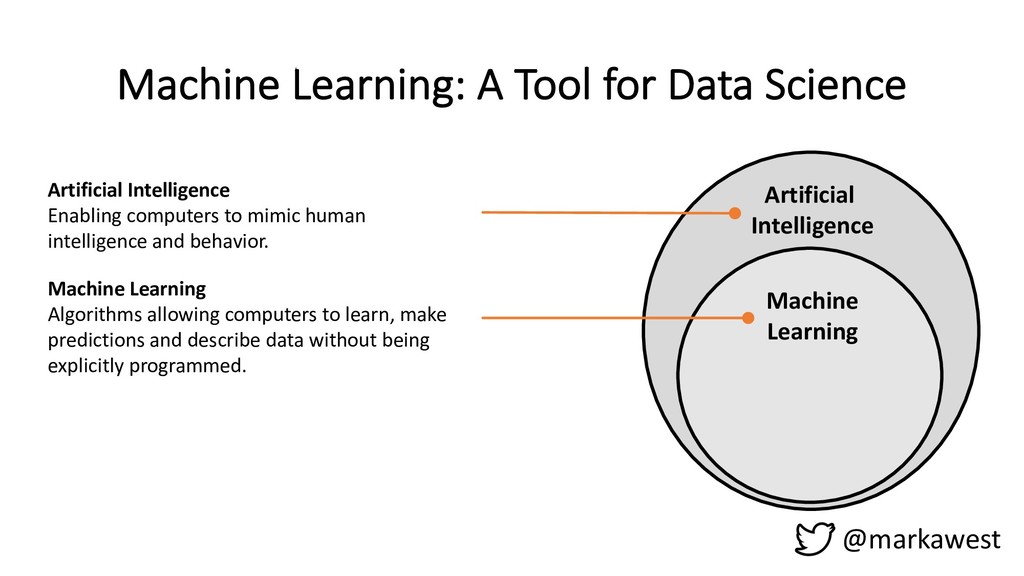
I’ll start by defining what Data Science is, how it is related to Machine Learning and share some tips for introducing Data Science to your organisation.
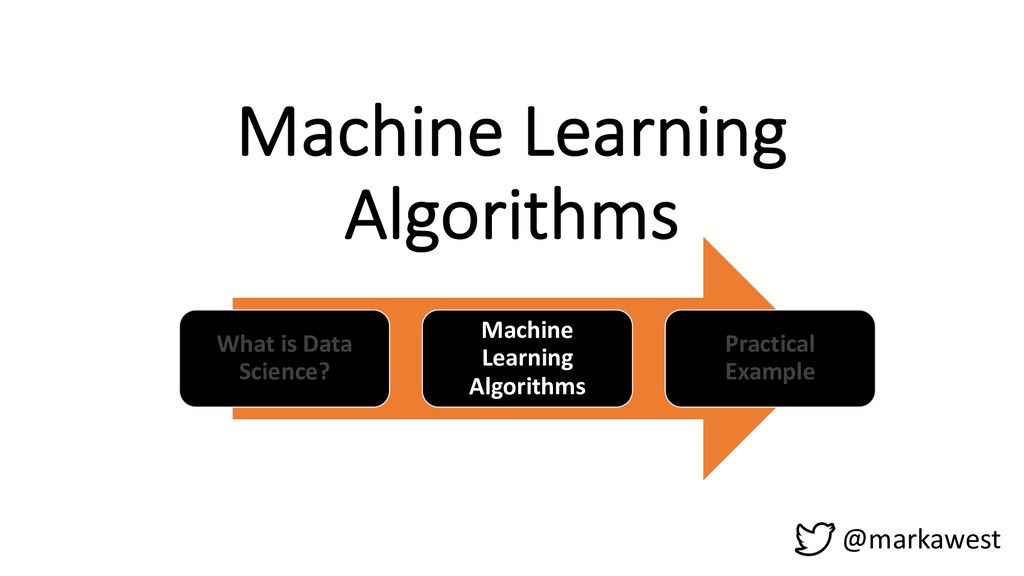
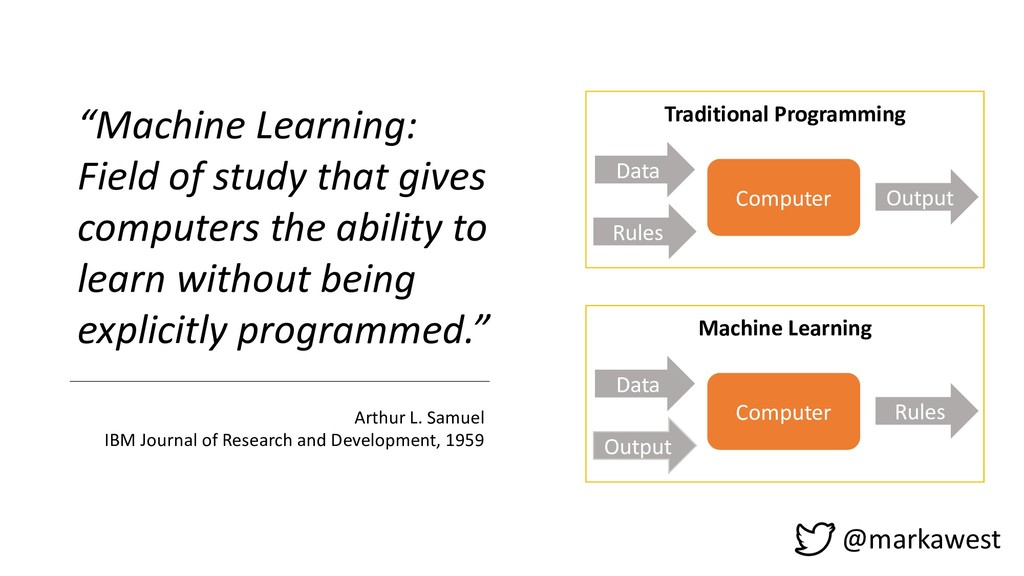
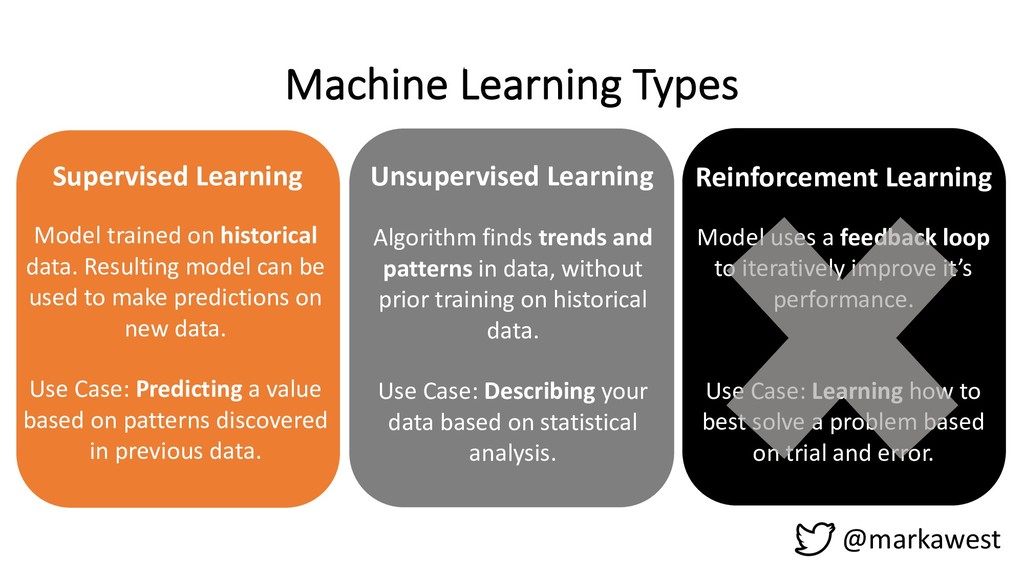
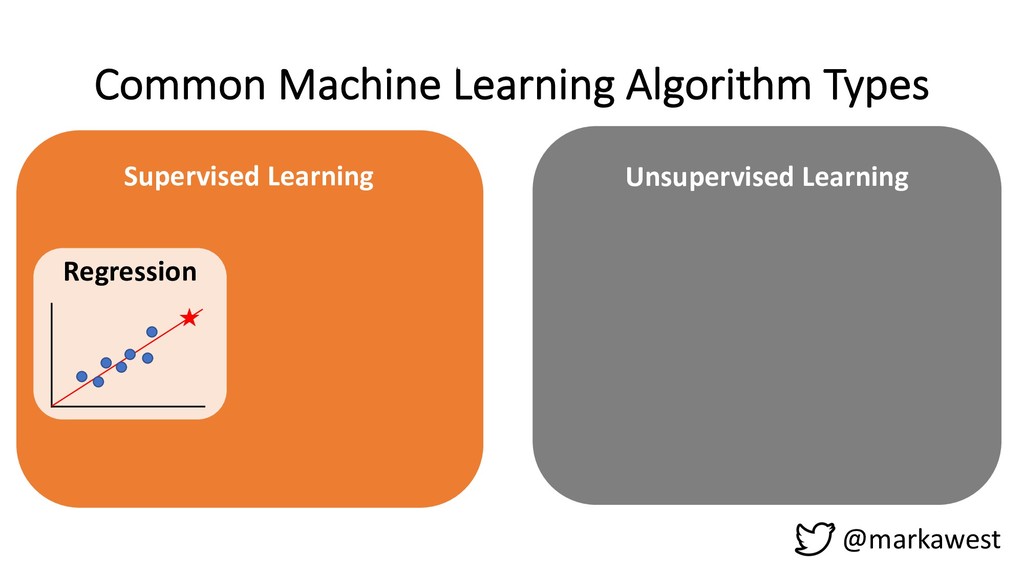
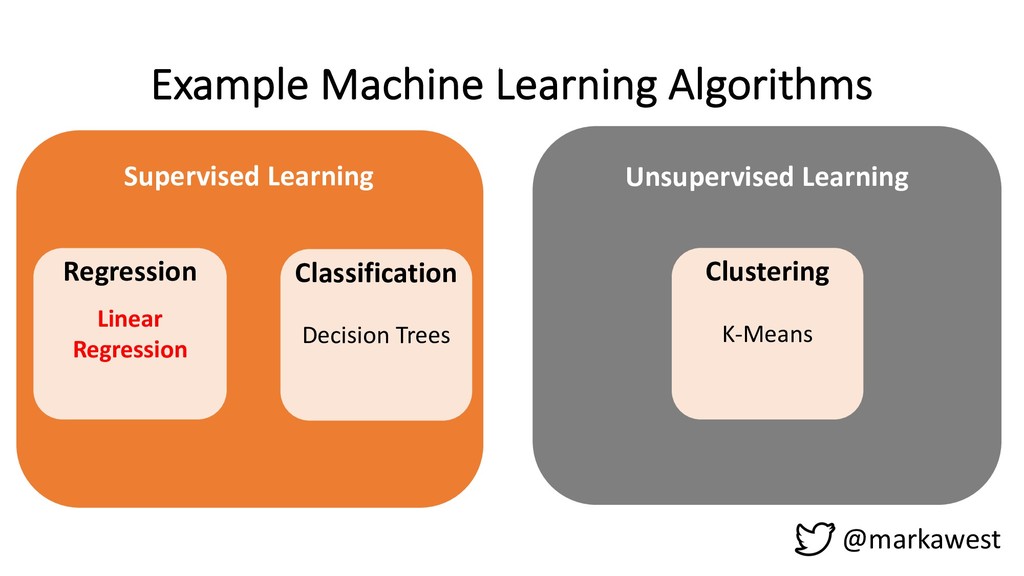
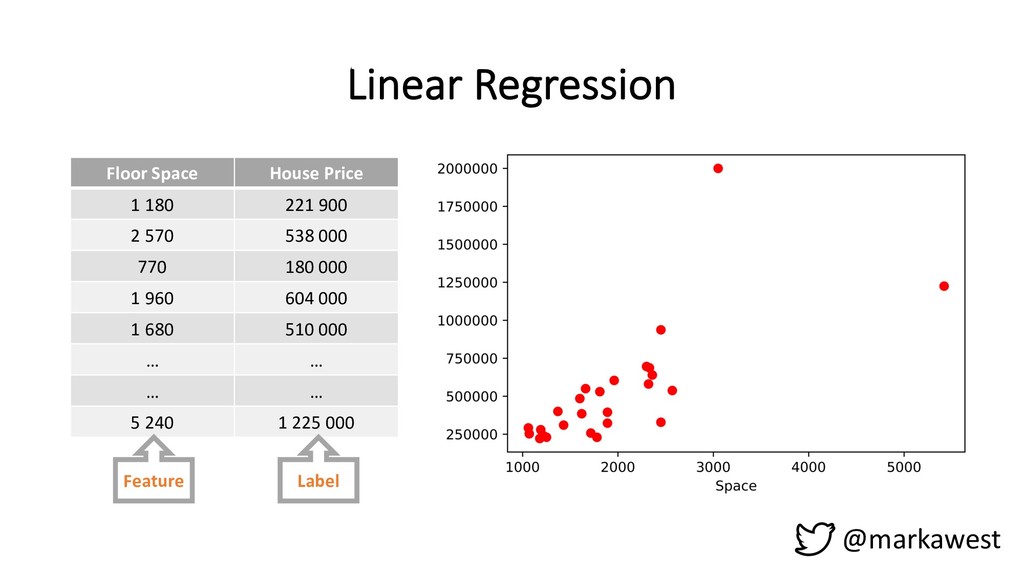
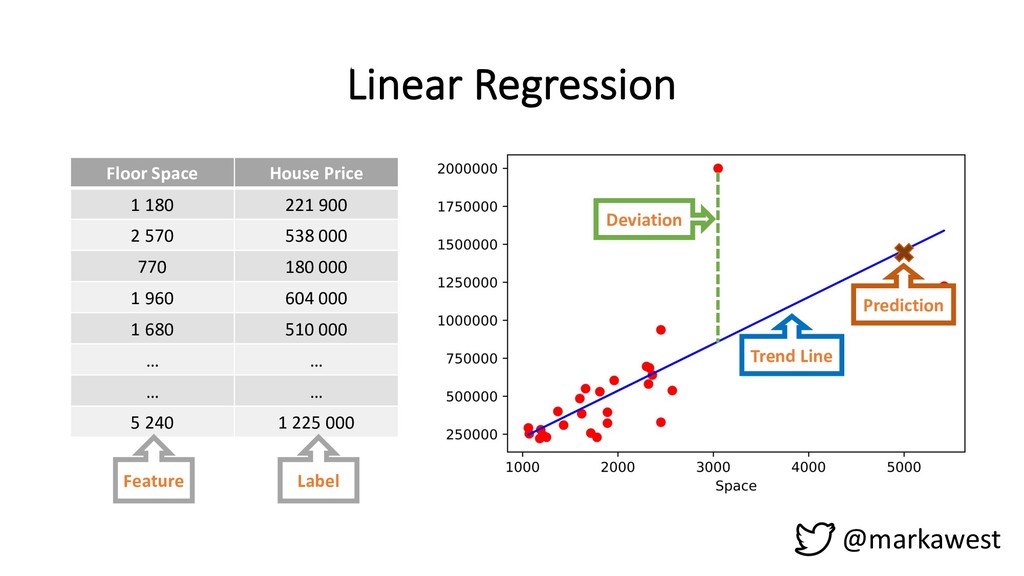
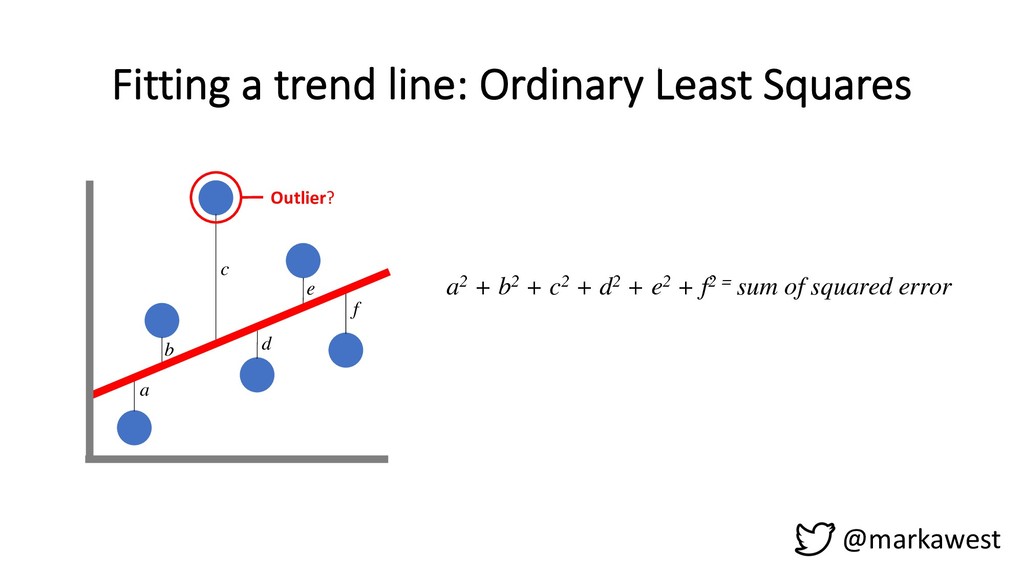
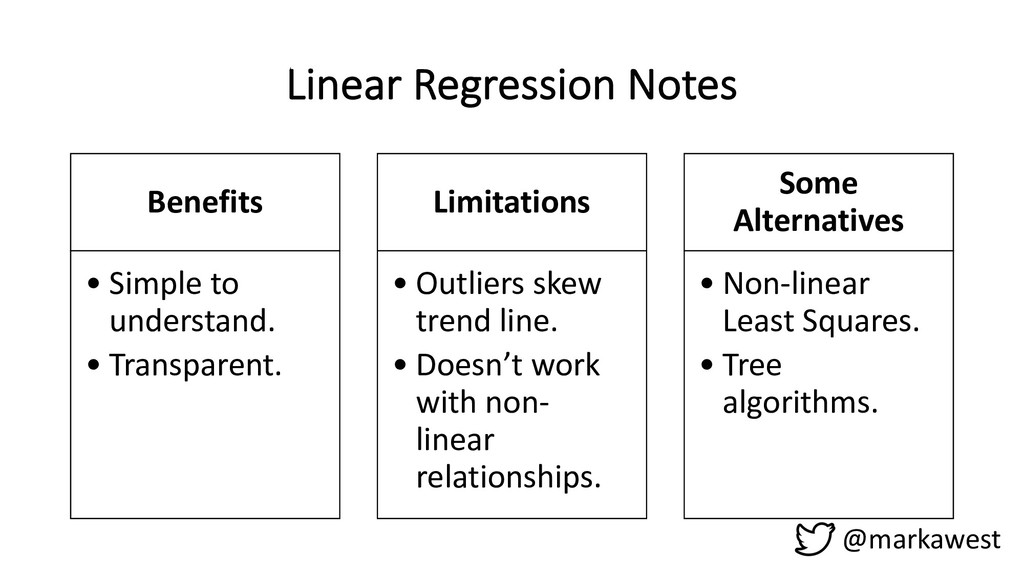
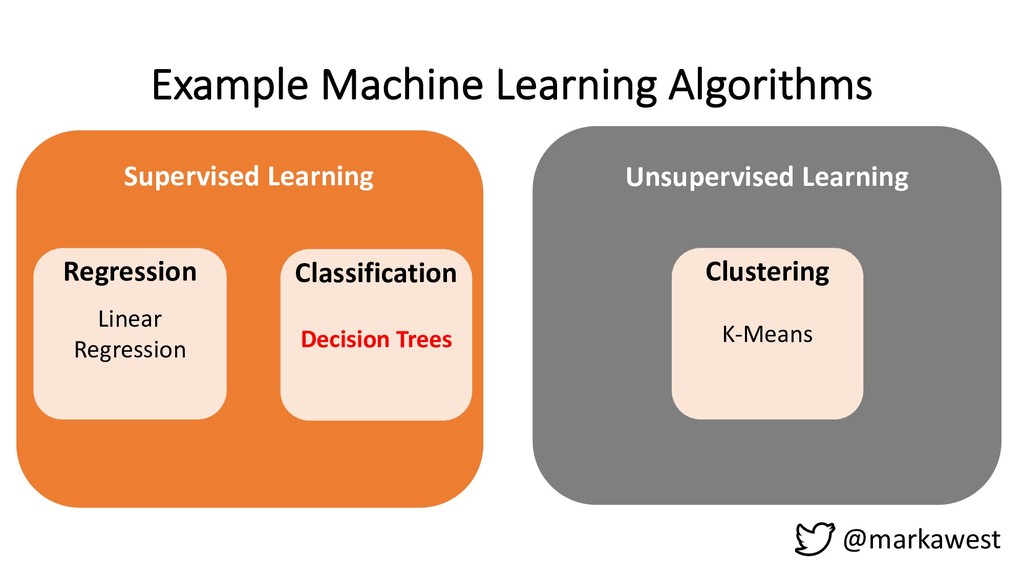
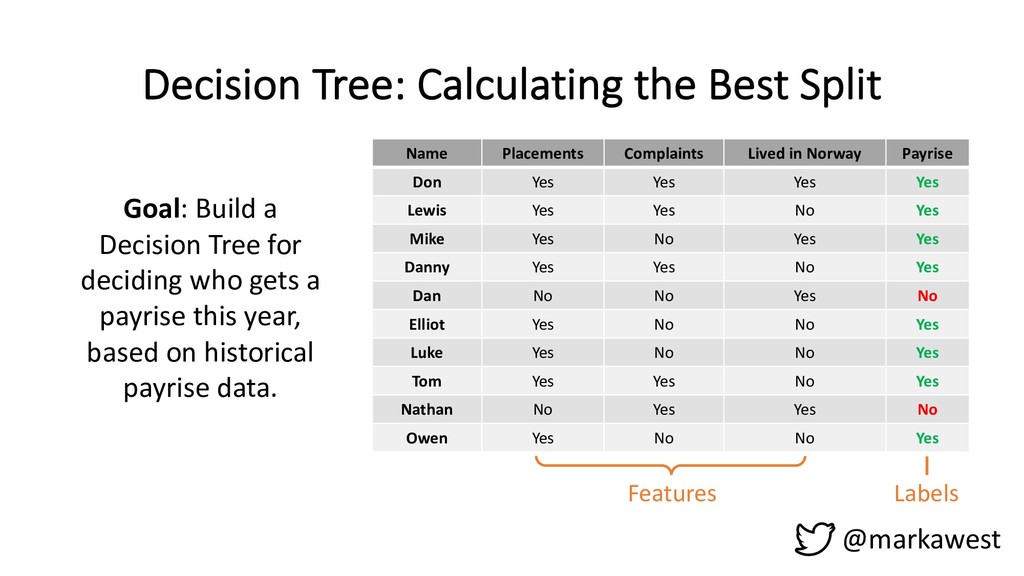
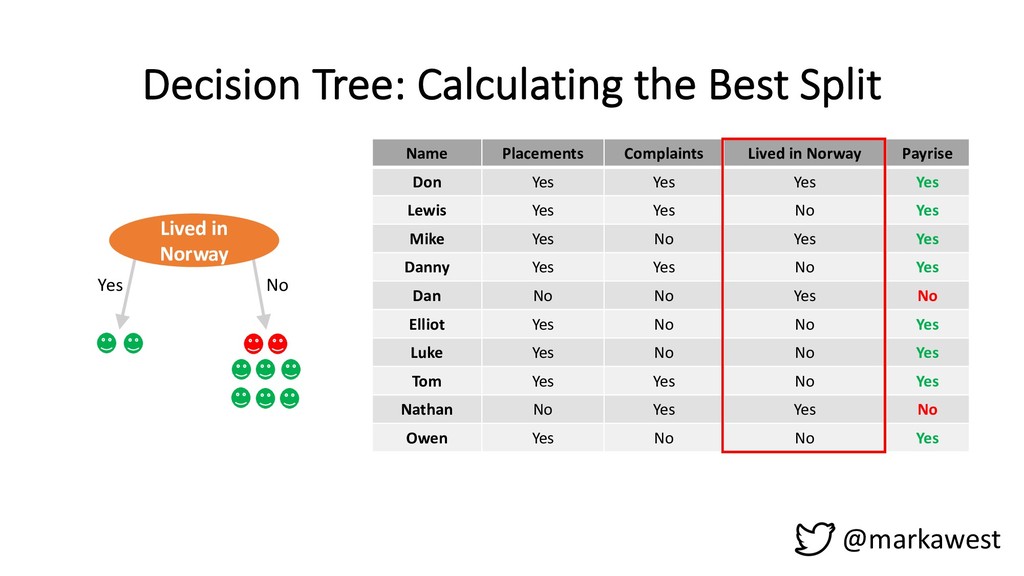
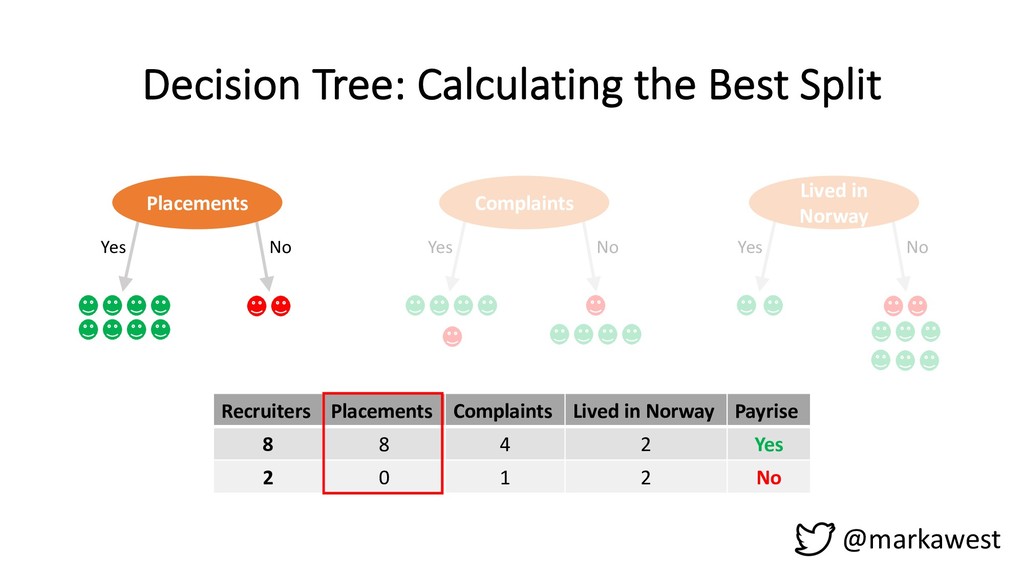
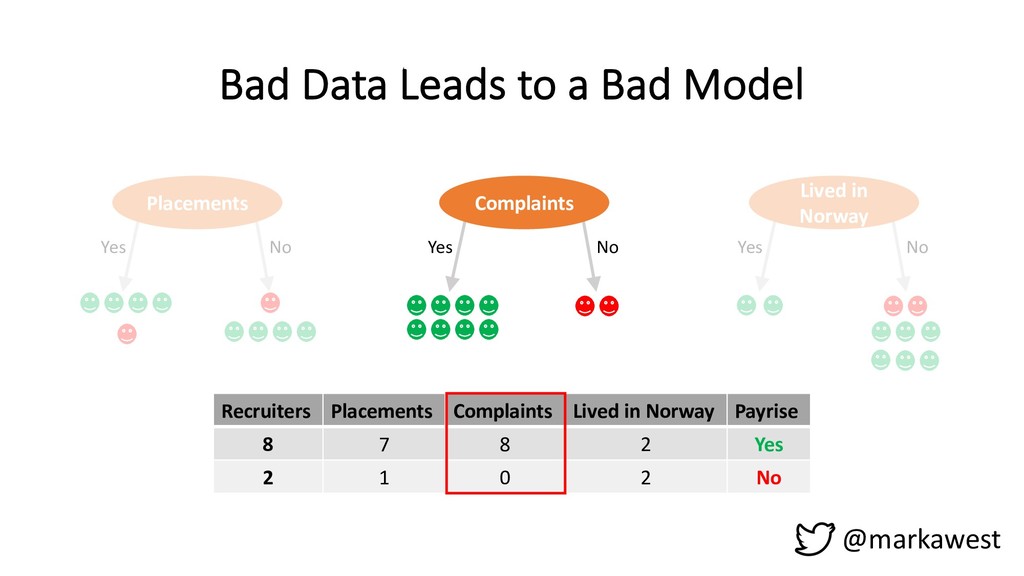
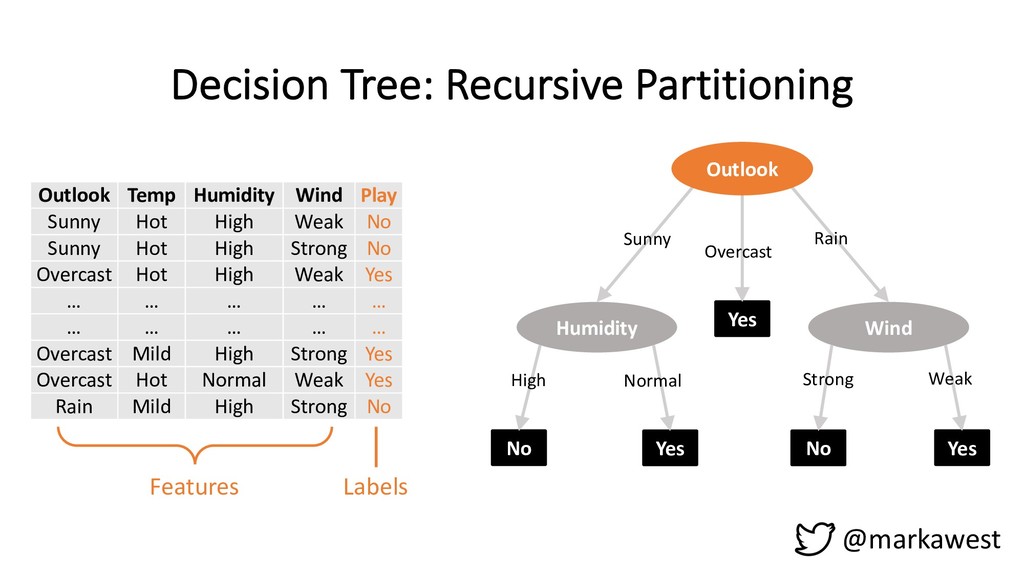
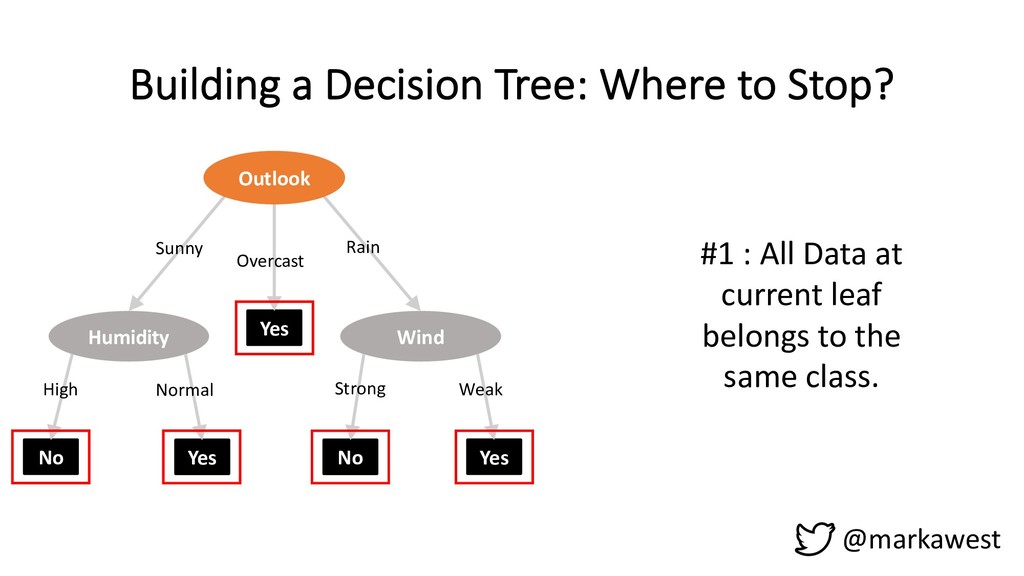
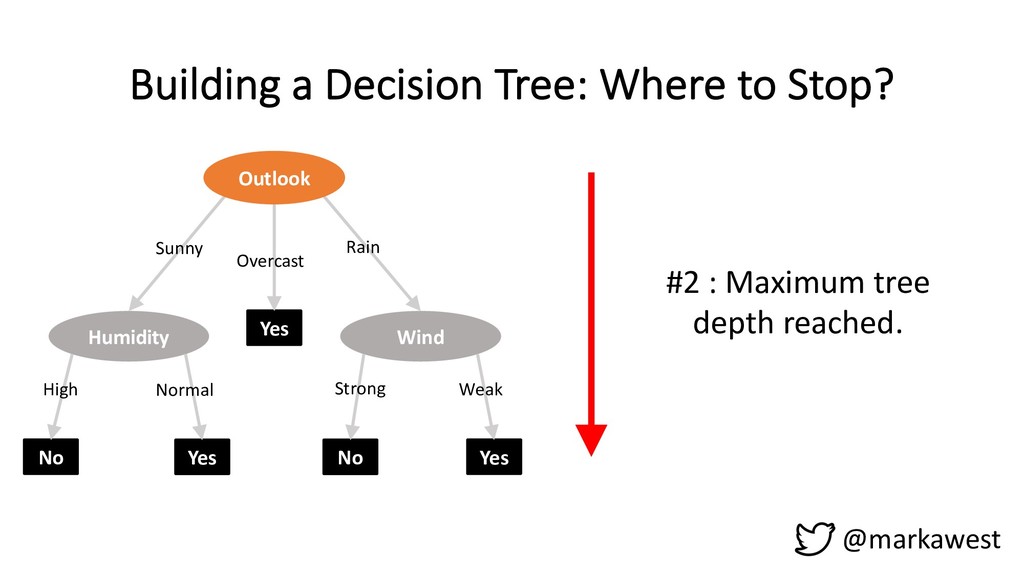
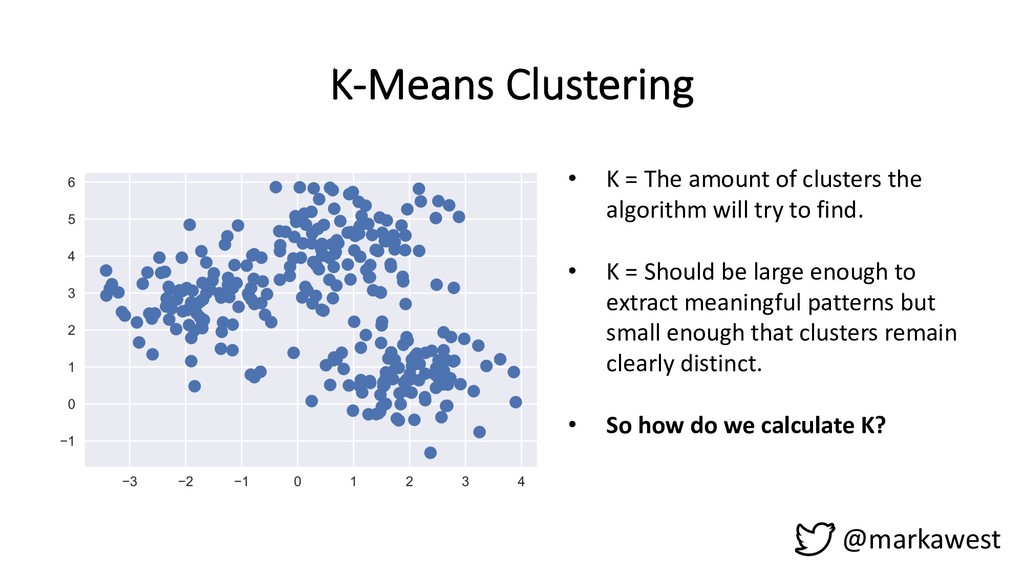
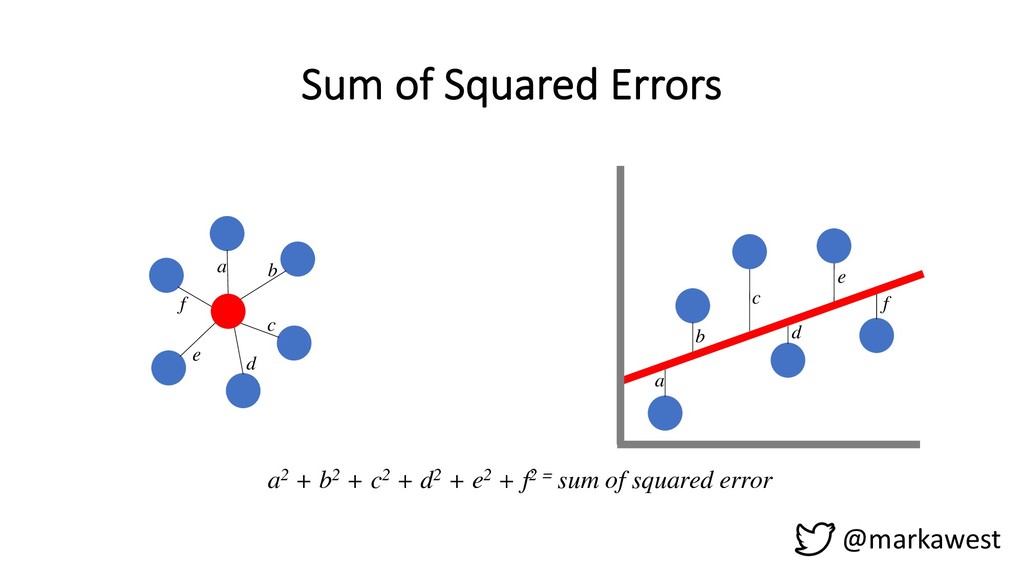
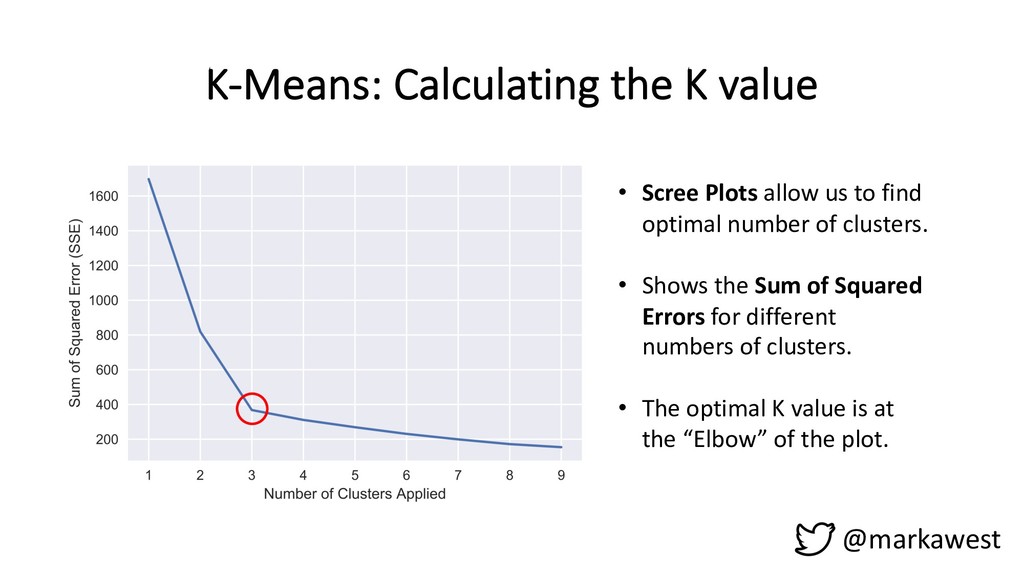
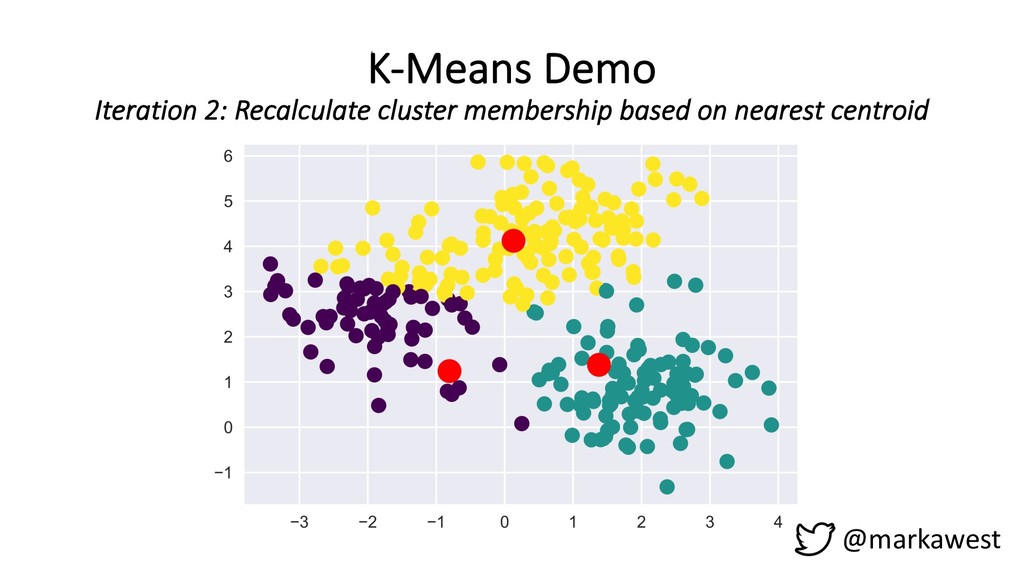
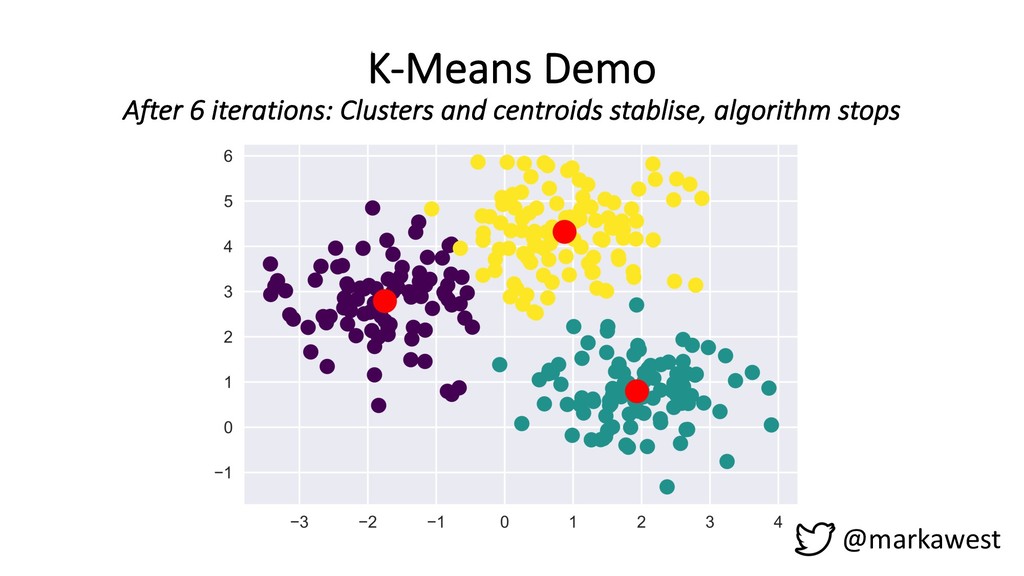
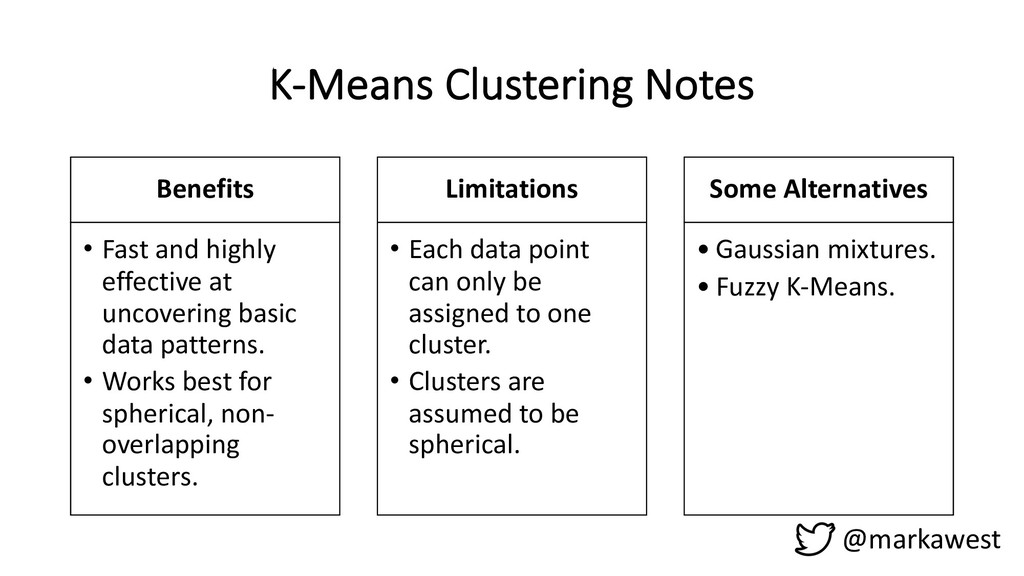
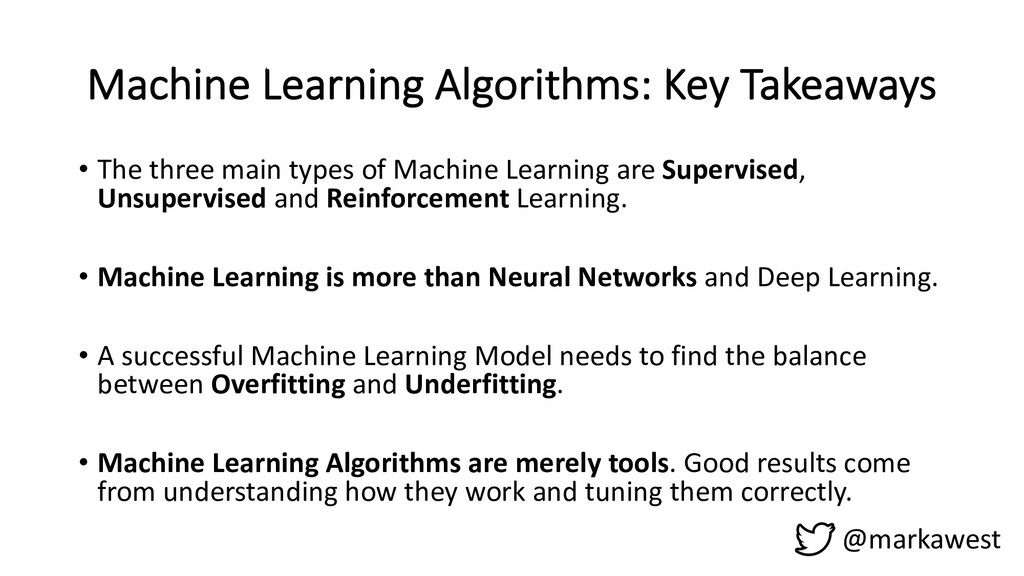
Next up we’ll run through some commonly used Machine Learning algorithms used by Data Scientists, along with examples for use cases where these algorithms can be applied.
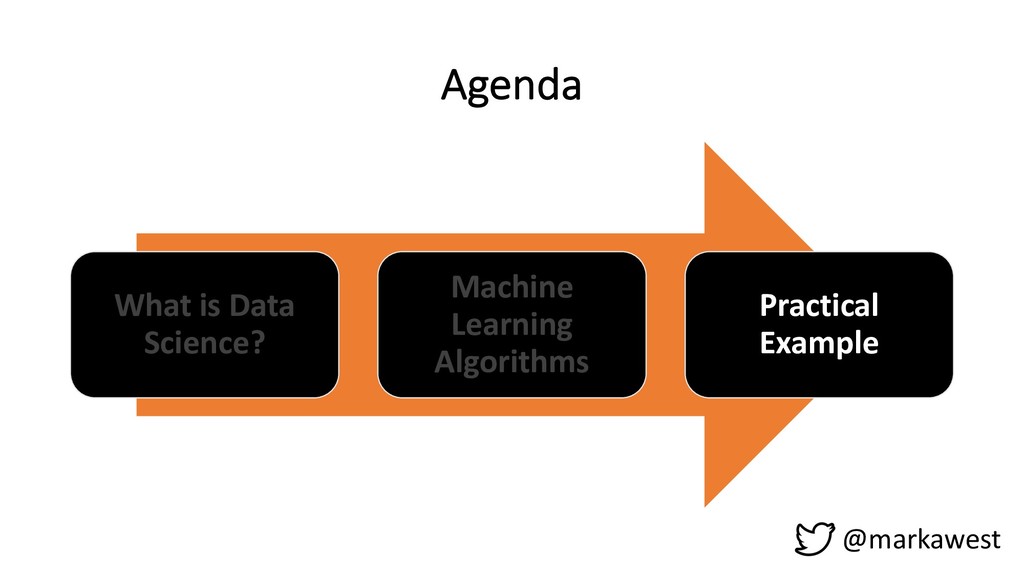
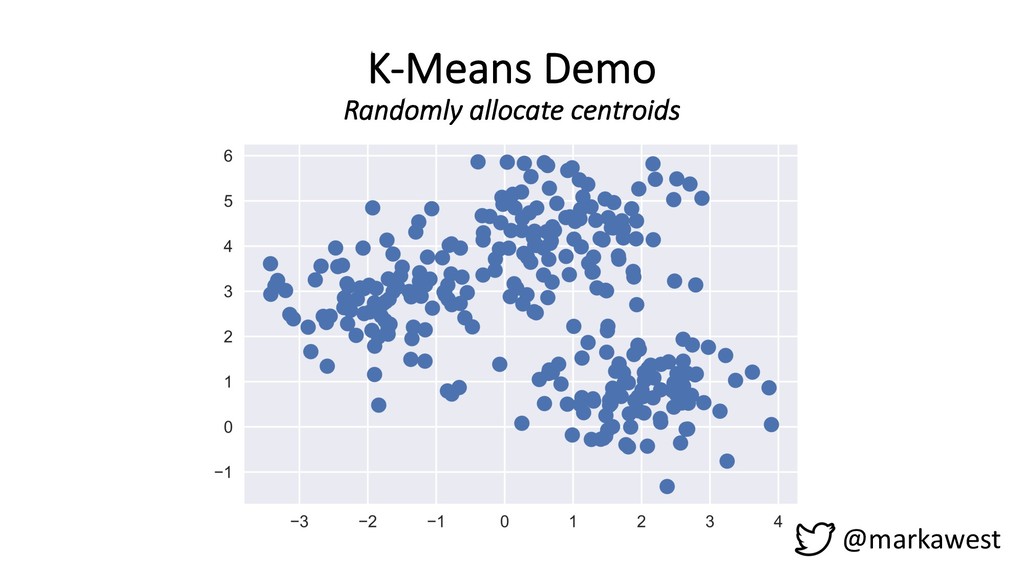
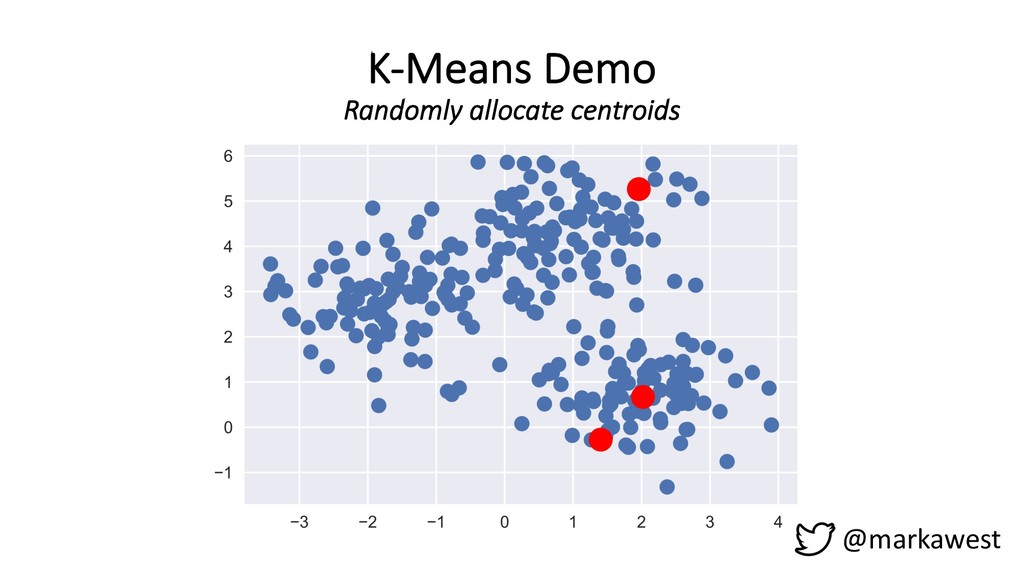
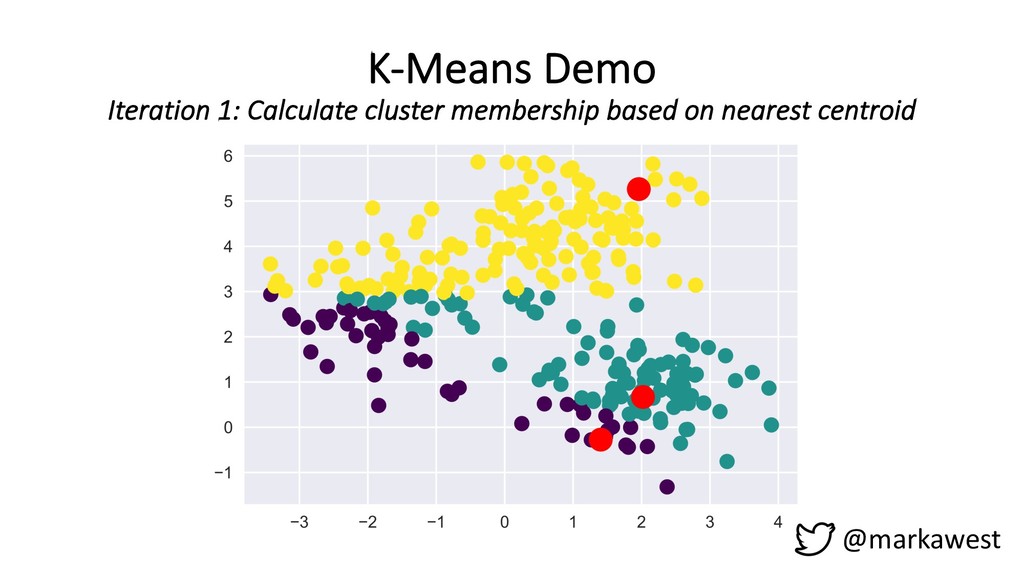
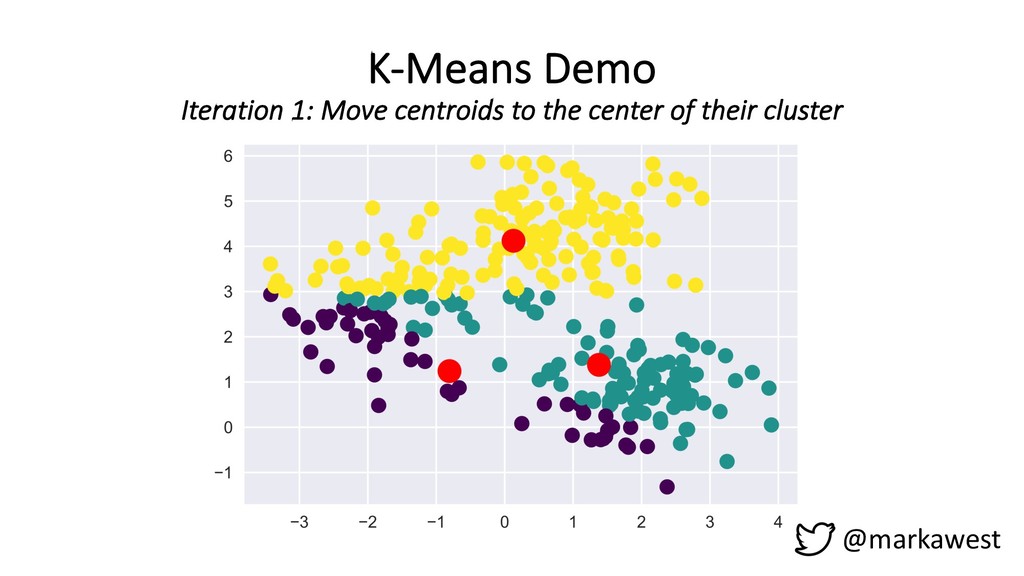
The final third of the talk will be a demonstration of how you can quickly get started with Data Science and Machine Learning using Python and the open source "scikit-learn" library.

Istanbul Tech Talks

April 02, 2019
Tweet

More Decks by Istanbul Tech Talks

Other Decks in Technology

Transcript

  1. Who Am I? • Previously Java Developer and Architect. •

    Currently building and managing a team of Data Scientists at Bouvet Oslo. @markawest
  2. Who Am I? • Previously Java Developer and Architect. •

    Currently building and managing a team of Data Scientists at Bouvet Oslo. • Leader javaBin (Norwegian Java User Group). @markawest
  3. What is Data Science? What is Data Science? Machine Learning

    Algorithms Practical Example @markawest
  4. @markawest “Data Science… is an interdisciplinary field of scientific methods,

    processes, and systems to extract knowledge or insight from data…” Wikipedia
  5. @markawest “Data Science… is an interdisciplinary field of scientific methods,

    processes, and systems to extract knowledge or insight from data…” Wikipedia
  6. @markawest “Data Science… is an interdisciplinary field of scientific methods,

    processes, and systems to extract knowledge or insight from data…” Wikipedia
  7. @markawest 1. Question 2. Data 3. Exploratory Data Analysis 4.

    Formal Modelling 5. Interperetation 6. Communication 7. Result Data Science Process : Hypothesis Driven
  8. @markawest 1. Question 2. Data 3. Exploratory Data Analysis 4.

    Formal Modelling 5. Interperetation 6. Communication 7. Result Data Science Process : Hypothesis Driven
  9. @markawest 1. Question 2. Data 3. Exploratory Data Analysis 4.

    Formal Modelling 5. Interperetation 6. Communication 7. Result Data Science Process : Hypothesis Driven
  10. @markawest 1. Question 2. Data 3. Exploratory Data Analysis 4.

    Formal Modelling 5. Interperetation 6. Communication 7. Result Data Science Process : Hypothesis Driven
  11. @markawest 1. Question 2. Data 3. Exploratory Data Analysis 4.

    Formal Modelling 5. Interpretation 6. Communication 7. Result Data Science Process : Hypothesis Driven
  12. @markawest 1. Question 2. Data 3. Exploratory Data Analysis 4.

    Formal Modelling 5. Interpretation 6. Communication 7. Result Data Science Process : Hypothesis Driven
  13. @markawest 1. Question 2. Data 3. Exploratory Data Analysis 4.

    Formal Modelling 5. Interpretation 6. Communication 7. Result Data Science Process : Hypothesis Driven
  14. @markawest Roles Required in a Data Science Project • Prove

    / disprove hypotheses. • Information and Data Gathering. • Data Wrangling. • Algorithm and ML models. • Communication. Data Scientist • Build Data Driven Platforms. • Operationalize Algorithms and Machine Learning models. • Data Integration. Data Engineer • Storytelling. • Build Dashboards and other Data visualizations. • Provide insight through visual means. Visualization Expert • Project Management. • Manage stakeholder expectations. • Maintain a Vision. • Facilitate. Process Owner
  15. @markawest Roles Required in a Data Science Project • Prove

    / disprove hypotheses. • Information and Data gathering. • Data wrangling. • Algorithm and ML models. • Communication. Data Scientist • Build Data Driven Platforms. • Operationalize Algorithms and Machine Learning models. • Data Integration. Data Engineer • Storytelling. • Build Dashboards and other Data visualizations. • Provide insight through visual means. Visualization Expert • Project Management. • Manage stakeholder expectations. • Maintain a Vision. • Facilitate. Process Owner
  16. @markawest Roles Required in a Data Science Project • Prove

    / disprove hypotheses. • Information and Data gathering. • Data wrangling. • Algorithm and ML models. • Communication. Data Scientist • Build Data Driven Platforms. • Operationalize Algorithms and Machine Learning models. • Data Integration. • Monitoring. Data Engineer • Storytelling. • Build Dashboards and other Data visualizations. • Provide insight through visual means. Visualization Expert • Project Management. • Manage stakeholder expectations. • Maintain a Vision. • Facilitate. Process Owner
  17. @markawest Roles Required in a Data Science Project • Prove

    / disprove hypotheses. • Information and Data gathering. • Data wrangling. • Algorithm and ML models. • Communication. Data Scientist • Build Data Driven Platforms. • Operationalize Algorithms and Machine Learning models. • Data Integration. • Monitoring. Data Engineer • Storytelling. • Build Dashboards and other Data visualizations. • Provide insight through visual means. Data Visualization • Project Management. • Manage stakeholder expectations. • Maintain a Vision. • Facilitate. Process Owner
  18. @markawest Roles Required in a Data Science Project • Prove

    / disprove hypotheses. • Information and Data gathering. • Data wrangling. • Algorithm and ML models. • Communication. Data Scientist • Build Data Driven Platforms. • Operationalize Algorithms and Machine Learning models. • Data Integration. • Monitoring. Data Engineer • Storytelling. • Build Dashboards and other Data visualizations. • Provide insight through visual means. Data Visualization • Project Management. • Manage stakeholder expectations. • Maintain a Vision. • Facilitate. • Evangelize. Process Owner
  19. @markawest “Data Science… is an interdisciplinary field of scientific methods,

    processes, and systems to extract knowledge or insight from data…” Wikipedia
  20. @markawest Data Science as an Evolution of BI Business Intelligence

    Data Science Adds.. Data Sources Structured Data, most often from Relational Database Management Systems (RDBMS). Unstructured Data (log files, audio, images, emails, tweets, raw text, documents). Available Tools Data Visualization, Statistics. Machine Learning. Goals Provide support to strategic decision making, based on historical data. Provide business value through advanced functionality. Source: https://www.linkedin.com/pulse/data-science-business-intelligence-whats-difference-david-rostcheck
  21. @markawest Machine Learning: A Tool for Data Science Artificial Intelligence

    Artificial Intelligence Enabling computers to mimic human intelligence and behavior.
  22. @markawest Machine Learning: A Tool for Data Science Artificial Intelligence

    Machine Learning Artificial Intelligence Enabling computers to mimic human intelligence and behavior. Machine Learning Algorithms allowing computers to learn, make predictions and describe data without being explicitly programmed.
  23. @markawest Machine Learning: A Tool for Data Science Artificial Intelligence

    Machine Learning Deep Learning Machine Learning Algorithms allowing computers to learn, make predictions and describe data without being explicitly programmed. Artificial Intelligence Enabling computers to mimic human intelligence and behavior. Deep Learning Black box learning with multi-layered Neural Networks.
  24. What is Data Science: Key Takeaways • Data Scientists require

    Math and Statistics skills in addition to traditional Software Development. • Data Science is Hypothesis Driven. • Data Science projects require a range of competencies/roles. • Data Science can be seen as an evolution of Business Intelligence, providing additional capabilities through the application of cutting edge technologies and unstructured data. @markawest
  25. @markawest “Machine Learning: Field of study that gives computers the

    ability to learn without being explicitly programmed.” Arthur L. Samuel IBM Journal of Research and Development, 1959 Computer Data Rules Output Computer Data Output Rules Traditional Programming Machine Learning
  26. Generalized Captures the correlations in your training data. May have

    an error margin. The Art of The Generalized Model @markawest
  27. Generalized Captures the correlations in your training data. May have

    an error margin. The Art of The Generalized Model @markawest Underfitted Model overlooks underlying patterns in your training data.
  28. Generalized Captures the correlations in your training data. May have

    an error margin. The Art of The Generalized Model @markawest Underfitted Overfitted Model memorizes the training data rather than finding underlying patterns. Model overlooks underlying patterns in your training data.
  29. Supervised Learning Machine Learning Types @markawest Unsupervised Learning Model trained

    on historical data. Resulting model can be used to make predictions on new data. Use Case: Predicting a value based on patterns discovered in previous data. Algorithm finds trends and patterns in data, without prior training on historical data. Use Case: Describing your data based on statistical analysis. Reinforcement Learning Model uses a feedback loop to iteratively improve it’s performance. Use Case: Learning how to best solve a problem based on trial and error.
  30. Example Machine Learning Algorithms @markawest Supervised Learning Unsupervised Learning Linear

    Regression Classification Regression K-Means Clustering Decision Trees
  31. Example Machine Learning Algorithms @markawest Supervised Learning Unsupervised Learning Linear

    Regression Classification Regression K-Means Clustering Decision Trees
  32. Floor Space House Price 1 180 221 900 2 570

    538 000 770 180 000 1 960 604 000 1 680 510 000 … … … … 5 240 1 225 000 Linear Regression Feature Label @markawest
  33. Floor Space House Price 1 180 221 900 2 570

    538 000 770 180 000 1 960 604 000 1 680 510 000 … … … … 5 240 1 225 000 Linear Regression Feature Label Trend Line Deviation Prediction @markawest
  34. Fitting a trend line: Ordinary Least Squares @markawest a b

    c d e f a2 + b2 + c2 + d2 + e2 + f2 = sum of squared error Outlier?
  35. Linear Regression Notes Benefits • Simple to understand. • Transparent.

    Limitations • Outliers skew trend line. • Doesn’t work with non- linear relationships. Some Alternatives • Non-linear Least Squares. • Tree algorithms. @markawest
  36. Example Machine Learning Algorithms @markawest Supervised Learning Unsupervised Learning Linear

    Regression Classification Regression K-Means Clustering Decision Trees
  37. Decision Tree: Calculating the Best Split @markawest Name Placements Complaints

    Lived in Norway Payrise Don Yes Yes Yes Yes Lewis Yes Yes No Yes Mike Yes No Yes Yes Danny Yes Yes No Yes Dan No No Yes No Elliot Yes No No Yes Luke Yes No No Yes Tom Yes Yes No Yes Nathan No Yes Yes No Owen Yes No No Yes Goal: Build a Decision Tree for deciding who gets a payrise this year, based on historical payrise data. Features Labels
  38. Decision Tree: Calculating the Best Split @markawest Name Placements Complaints

    Lived in Norway Payrise Don Yes Yes Yes Yes Lewis Yes Yes No Yes Mike Yes No Yes Yes Danny Yes Yes No Yes Dan No No Yes No Elliot Yes No No Yes Luke Yes No No Yes Tom Yes Yes No Yes Nathan No Yes Yes No Owen Yes No No Yes Lived in Norway Yes No
  39. Decision Tree: Calculating the Best Split @markawest Name Placements Complaints

    Lived in Norway Payrise Don Yes Yes Yes Yes Lewis Yes Yes No Yes Mike Yes No Yes Yes Danny Yes Yes No Yes Dan No No Yes No Elliot Yes No No Yes Luke Yes No No Yes Tom Yes Yes No Yes Nathan No Yes Yes No Owen Yes No No Yes Complaints Yes No
  40. Decision Tree: Calculating the Best Split @markawest Name Placements Complaints

    Lived in Norway Payrise Don Yes Yes Yes Yes Lewis Yes Yes No Yes Mike Yes No Yes Yes Danny Yes Yes No Yes Dan No No Yes No Elliot Yes No No Yes Luke Yes No No Yes Tom Yes Yes No Yes Nathan No Yes Yes No Owen Yes No No Yes Placements Yes No
  41. Decision Tree: Calculating the Best Split @markawest Placements Yes No

    Complaints Yes No Lived in Norway Yes No Recruiters Placements Complaints Lived in Norway Payrise 8 8 4 2 Yes 2 0 1 2 No
  42. Bad Data Leads to a Bad Model @markawest Placements Yes

    No Complaints Yes No Lived in Norway Yes No Recruiters Placements Complaints Lived in Norway Payrise 8 7 8 2 Yes 2 1 0 2 No
  43. Decision Tree: Recursive Partitioning @markawest Outlook Temp Humidity Wind Play

    Sunny Hot High Weak No Sunny Hot High Strong No Overcast Hot High Weak Yes … … … … … … … … … … Overcast Mild High Strong Yes Overcast Hot Normal Weak Yes Rain Mild High Strong No No Yes No Yes Yes Outlook Humidity Wind Features Labels Overcast Sunny Rain High Weak Normal Strong
  44. Building a Decision Tree: Where to Stop? @markawest #1 :

    All Data at current leaf belongs to the same class. No Yes No Yes Yes Humidity Wind Overcast Sunny Rain High Normal Strong Outlook Weak
  45. Building a Decision Tree: Where to Stop? @markawest No Yes

    No Yes Yes Humidity Wind Overcast Sunny Rain High Normal Strong Outlook #2 : Maximum tree depth reached. Weak
  46. Decision Tree Notes Benefits • White Box. • Flexible (use

    for both regression and classification). • Robust to outliers. • Handle non-linear boundaries. Limitations • Susceptible to overfitting. • Changes to where the Data is sliced can produce different results. Some Alternatives • Support Vector Machine. • Logistic Regression. • Random Forests. @markawest
  47. Example Machine Learning Algorithms @markawest Supervised Learning Unsupervised Learning Linear

    Regression Classification Regression K-Means Clustering Decision Trees
  48. K-Means Clustering @markawest • K = The amount of clusters

    the algorithm will try to find. • K = Should be large enough to extract meaningful patterns but small enough that clusters remain clearly distinct. • So how do we calculate K?
  49. Sum of Squared Errors @markawest a b c d e

    f a2 + b2 + c2 + d2 + e2 + f2 = sum of squared error a b c d e f
  50. K-Means: Calculating the K value @markawest • Scree Plots allow

    us to find optimal number of clusters. • Shows the Sum of Squared Errors for different numbers of clusters. • The optimal K value is at the “Elbow” of the plot.
  51. K-Means Clustering Notes Benefits • Fast and highly effective at

    uncovering basic data patterns. • Works best for spherical, non- overlapping clusters. Limitations • Each data point can only be assigned to one cluster. • Clusters are assumed to be spherical. Some Alternatives • Gaussian mixtures. • Fuzzy K-Means. @markawest
  52. Machine Learning Algorithms: Key Takeaways @markawest • The three main

    types of Machine Learning are Supervised, Unsupervised and Reinforcement Learning. • Machine Learning is more than Neural Networks and Deep Learning. • A successful Machine Learning Model needs to find the balance between Overfitting and Underfitting. • Machine Learning Algorithms are merely tools. Good results come from understanding how they work and tuning them correctly.
  53. Hypothesis That it is possible to predict Titanic survivability based

    on Age, Gender and Ticket Class. @markawest
  54. @markawest Variable Description PassengerId Unique Identifier Survival Survived = 1,

    Died = 0 Pclass Ticket class (1, 2 or 3) Sex Gender (‘male’ or ’female’) Age Age in years Sibsp Number siblings / spouses aboard the Titanic Parch Number parents / children aboard the Titanic Ticket Ticket number Fare Passenger fare Cabin Cabin number Embarked Port of Embarkation Name Passenger name, including honorific. Titanic Dataset
  55. Practical Example: Key Takeaways @markawest • Scikit-learn and Jupyter Notebooks

    provide a free and flexible basis for starting with Data Science. Use the Anaconda distribution to save time on installation! • Feature Engineering is a vital skill for Data Scientists. • Domain Knowledge is key to succeed! • Split your data into Test and Training sets. • Tweaking Hyperparameters may give better results (but you should be able to explain how your tweak improved model performance).
  56. Tips for Getting Started with Data Science @markawest • Become

    a Data Engineer! • Learn Python or R (SQL is also useful)! • Learn some statistical methods! • Understand the Data Science process! • Practice with Kaggle!