Upgrade to Pro — share decks privately, control downloads, hide ads and more …

Автоматическое разрешение заявок о ложных срабатываниях в антивирусе Avast, Александр Сибиряков, Scrapinghub

Автоматическое разрешение заявок о ложных срабатываниях в антивирусе Avast, Александр Сибиряков, Scrapinghub

Выступление на конференции PyCon Russia 2016

IT-People

July 25, 2016
Tweet

More Decks by IT-People

Other Decks in Programming

Transcript

  1. • Software Engineer @ Scrapinghub • Born in Yekaterinburg, RU

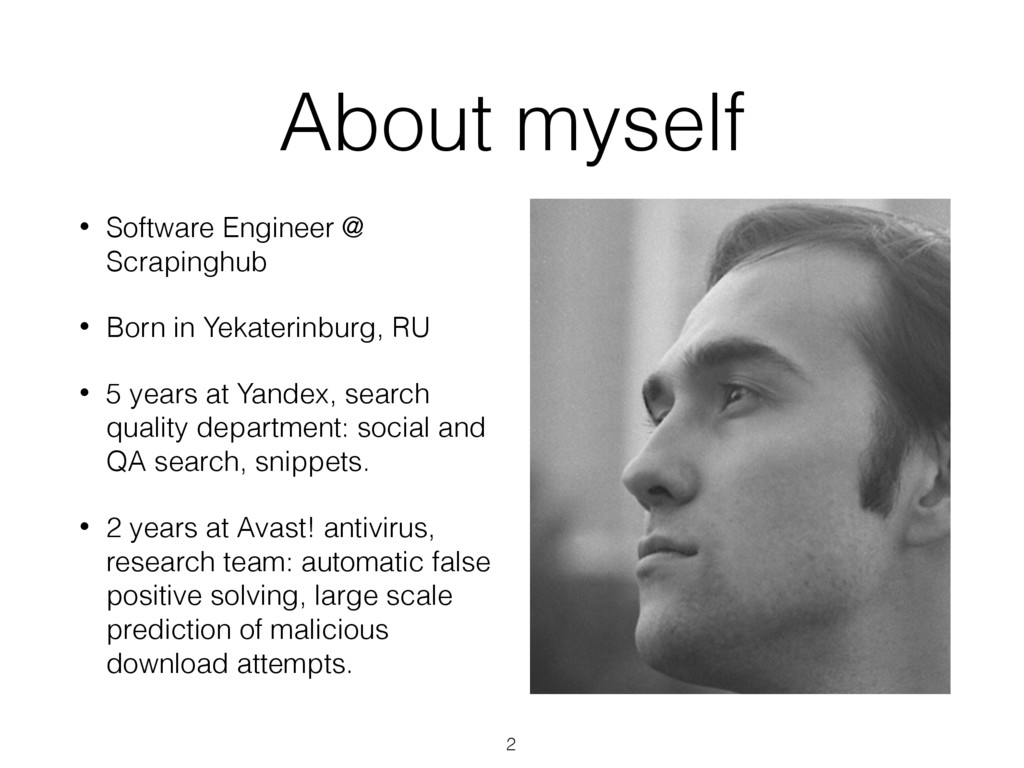
    • 5 years at Yandex, search quality department: social and QA search, snippets. • 2 years at Avast! antivirus, research team: automatic false positive solving, large scale prediction of malicious download attempts. About myself 2
  2. Scrapinghub • Main sponsor of the talk • New data

    science dept. • Crawlera (proxy service), • Scrapy Cloud. • Data sets off-the-shelf Professionals join us if you are too … or at least want to be!
  3. Task • False positive report → Virus Lab, • Classify

    the report and take actions: • True FP → mark as clean, disable detection, • False FP → do nothing. • Log everything. • 5 errors in 100 cases MAX.
  4. Backends • File ownership DB (FileRep) • Nearest neighbors in

    PE header space (MDE), • File Virus Lab metadata (Scavenger) • File content similarity with trigrams (Athena).
  5. PE header similarity (MDE) • In-house built DB for similarity

    search • Hand-made similarity function • 3 spaces: • Clean (VLAB, Softonic, CNET, MS products,…), • Malware (detected by Avast!), • Unknown
  6. ML

  7. Model learning process 1. votes from analytics console, 2. dump

    FP snapshots → data set, 3. train/test → learn → quality metrics, 4. analyze errors → classes, 5. think, 6. new signals (signals strength analysis), 7. repeat from 3. until desired quality.
  8. Errors and their types True False Pos TP: malicious sample,

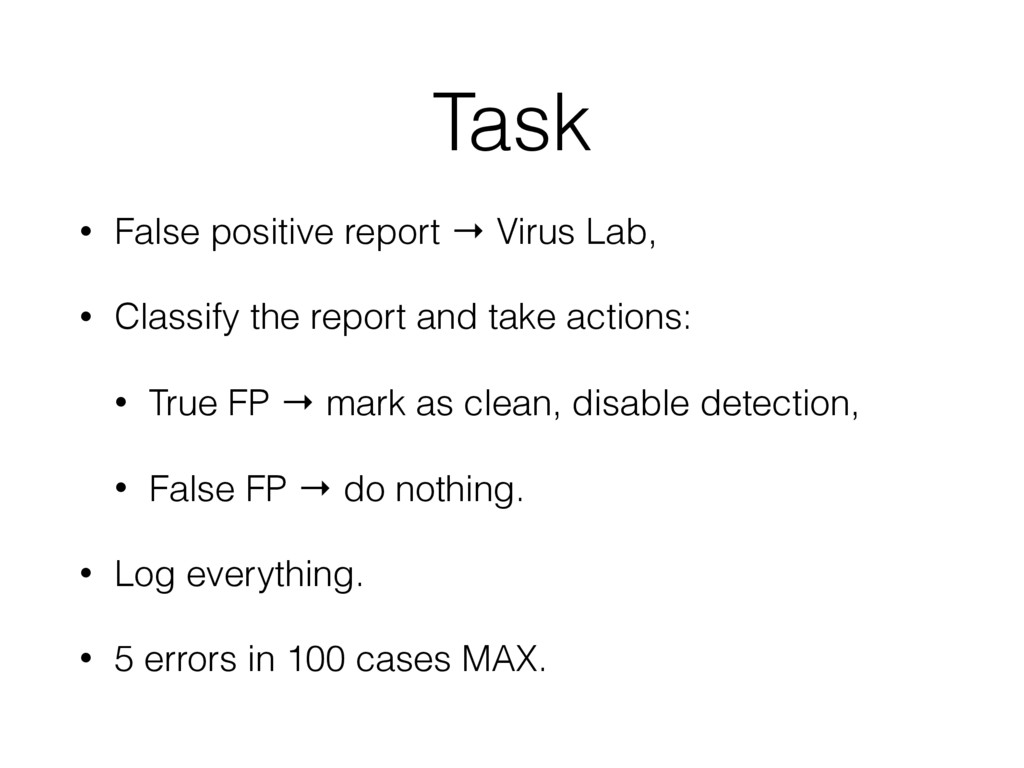
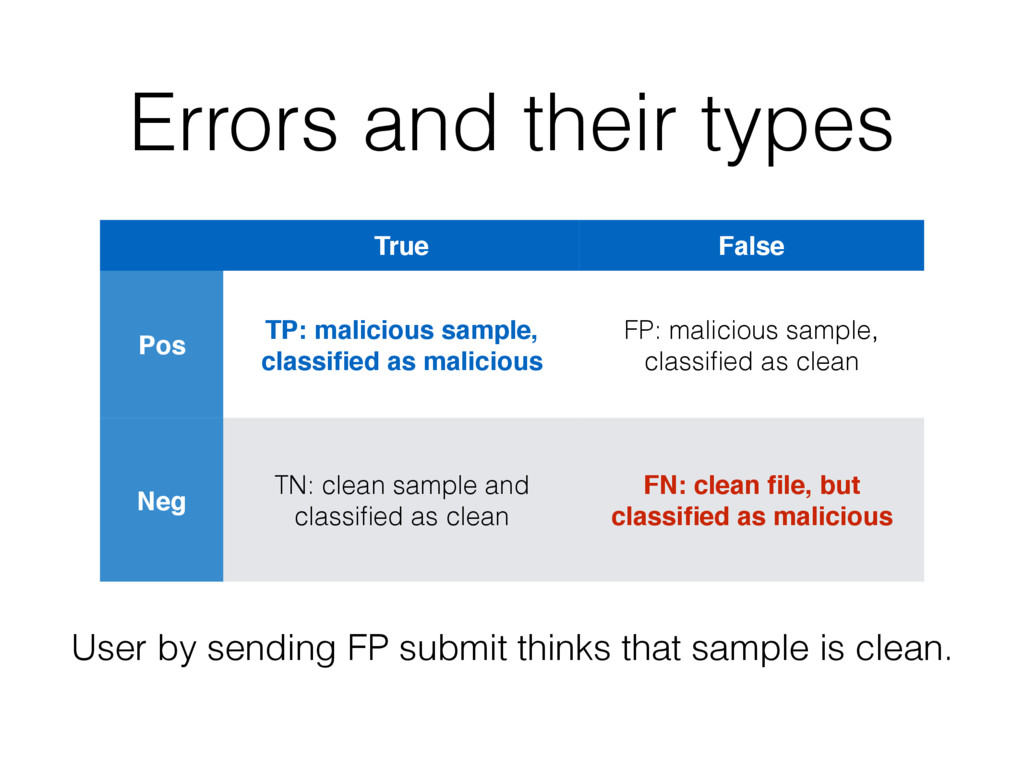
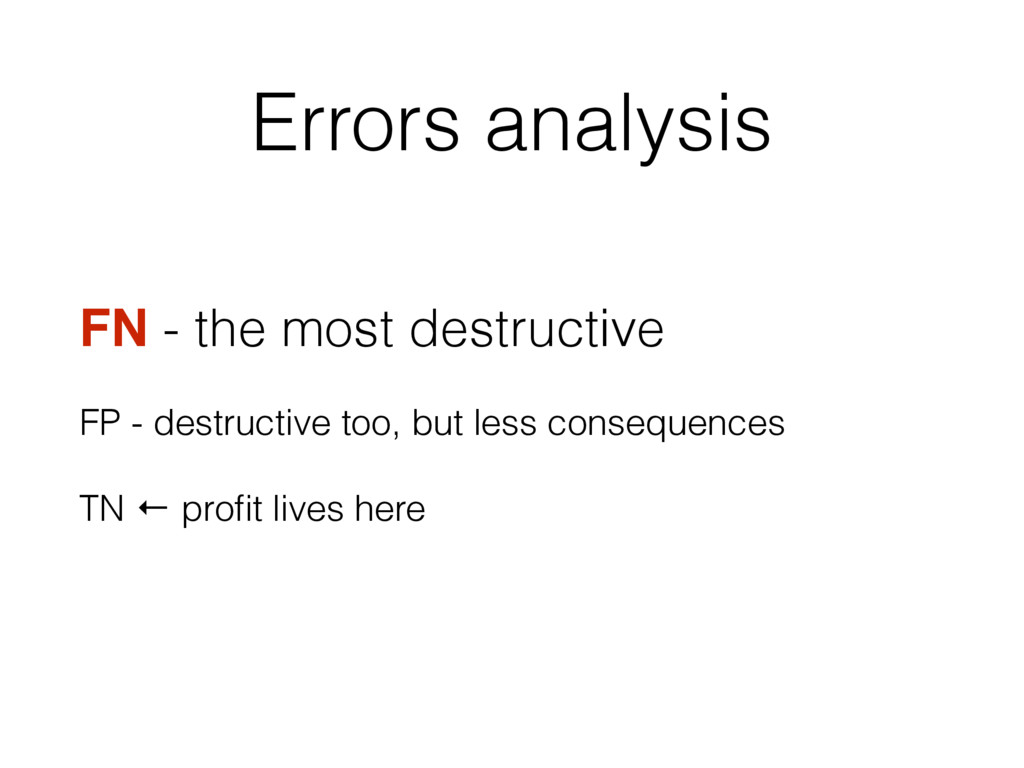
    classified as malicious FP: malicious sample, classified as clean Neg TN: clean sample and classified as clean FN: clean file, but classified as malicious User by sending FP submit thinks that sample is clean.
  9. Errors analysis FN - the most destructive FP - destructive

    too, but less consequences TN ← profit lives here
  10. What metrics to calculate? 1: fp=22 (0.0921), fn=4(0.0167), tp=117, tn=96,

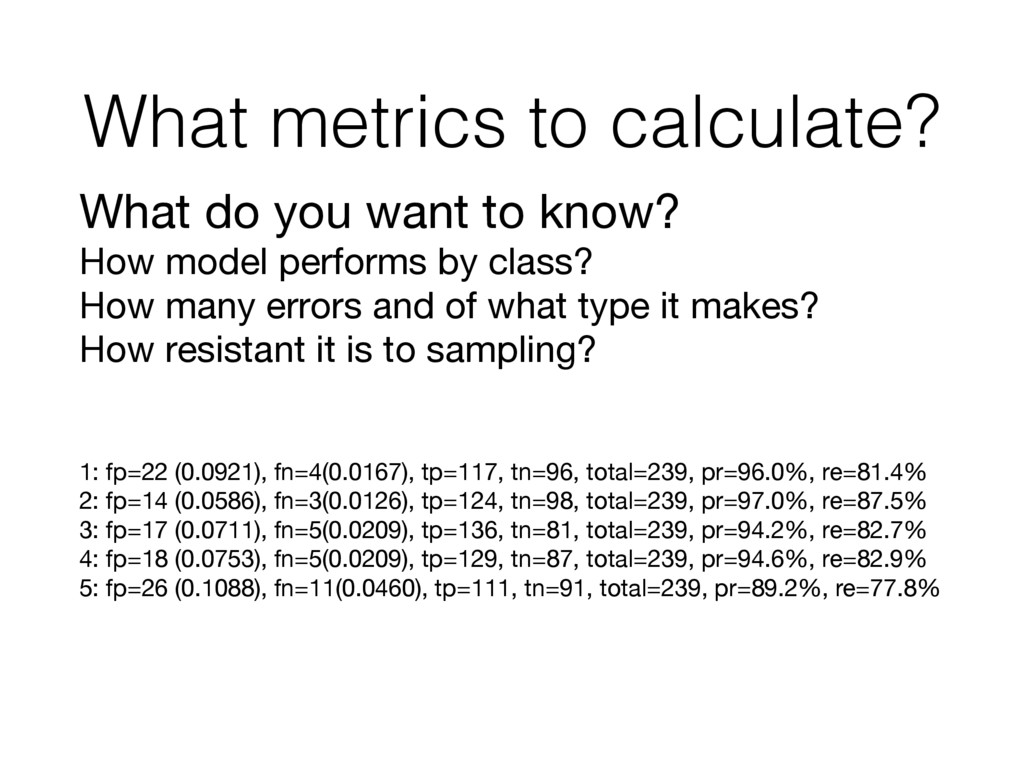
    total=239, pr=96.0%, re=81.4% 2: fp=14 (0.0586), fn=3(0.0126), tp=124, tn=98, total=239, pr=97.0%, re=87.5% 3: fp=17 (0.0711), fn=5(0.0209), tp=136, tn=81, total=239, pr=94.2%, re=82.7% 4: fp=18 (0.0753), fn=5(0.0209), tp=129, tn=87, total=239, pr=94.6%, re=82.9% 5: fp=26 (0.1088), fn=11(0.0460), tp=111, tn=91, total=239, pr=89.2%, re=77.8% What do you want to know? How model performs by class? How many errors and of what type it makes? How resistant it is to sampling?
  11. Technologies SVM (with LibSVM) → GBT OpenCV Google protocol buffers

    Python 2.7+: features (NumPy), plots, 2 test.
  12. Unstable learning process • Data from backends → data set,

    • changes: new files, votes, scans, • different values always :( • Snapshots • 1y period
  13. Fighting for quality: training set size • Everything, but not

    less. • Start with small, but reasonable size. • New data source? New signals ideas? If not - increase the training set. • We finished at 10K samples and 155 signals.
  14. Long learning times with SVM • hours (!) needed to

    learn SVM • + estimating optimal C, , • adding new features/ tuning model params. • Gradient Boosting Decision Trees
  15. Good on test, but so-so on input • First we

    took 2 weeks period, • good results on test • evaluation with next 2 weeks • each N-th within a 6 mo period
  16. Fighting for quality: measuring features strength • «feature selection»: variance

    of signals value, mutual information, frequency … We used: • 2 test, • usage in generated model (ensemble of trees)
  17. Fighting for quality: edge cases • Run on samples from

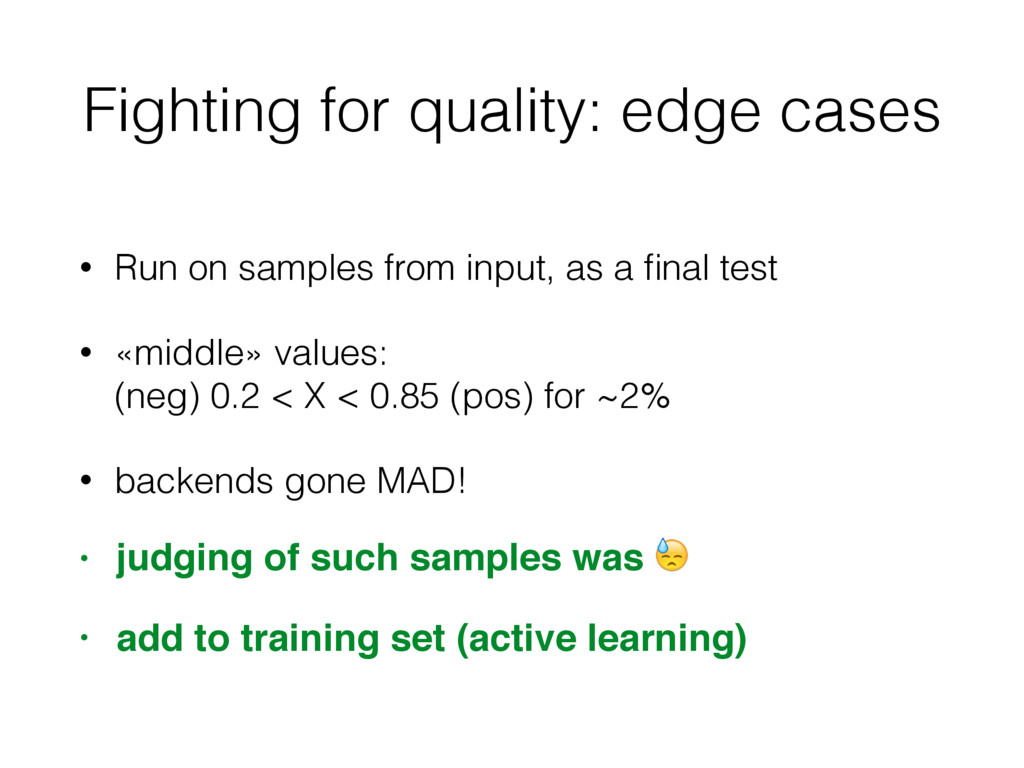
    input, as a final test • «middle» values:
 (neg) 0.2 < X < 0.85 (pos) for ~2% • backends gone MAD! • judging of such samples was • add to training set (active learning)
  18. It’s learned. What’s next? • Take data from input •

    100 random samples, review by engineer → 
 good impression. • If all is fine → production, • but this isn’t the end!
  19. Adoption process • Nobody believed it works • Making analysts

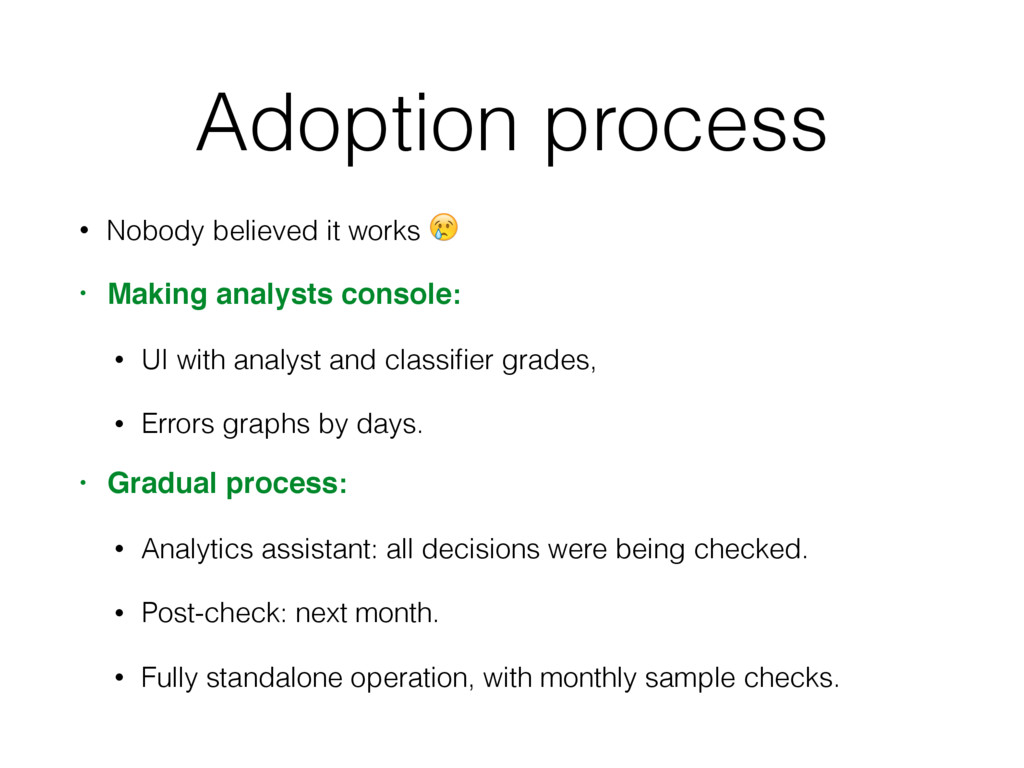
    console: • UI with analyst and classifier grades, • Errors graphs by days. • Gradual process: • Analytics assistant: all decisions were being checked. • Post-check: next month. • Fully standalone operation, with monthly sample checks.
  20. Recovery process 1. Errors graphs, choosing period. 2. Getting FP

    snapshots for selected period. 3. Looking at the errors, grouping, 4. New signals, if needed. 5. Judging problematic cases. 6. Learning & adoption.
  21. Major points • Understand errors. • Data snapshots not data

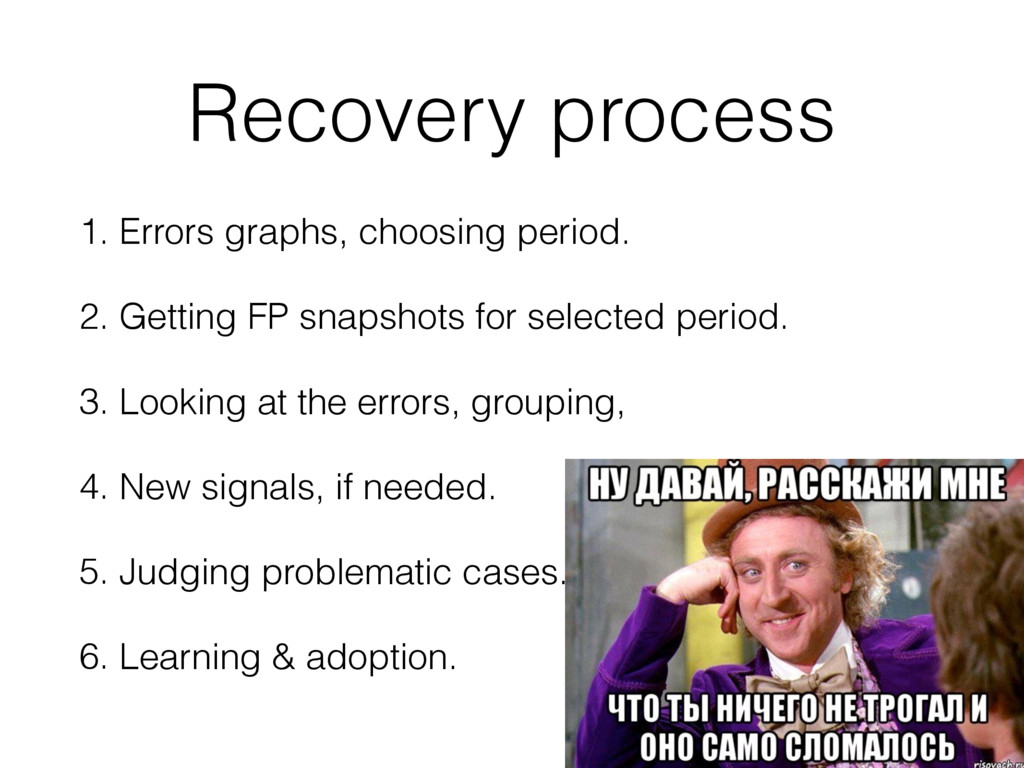
    sets. • Continuous process, not a single-time model. • Infrastructure and periodical performance monitoring. • Using input stream for evaluation instead of test set. • Recovery process.