Upgrade to Pro — share decks privately, control downloads, hide ads and more …

How Community Feedback Shapes Online Behavior

How Community Feedback Shapes Online Behavior

Presented at ICWSM 2014.

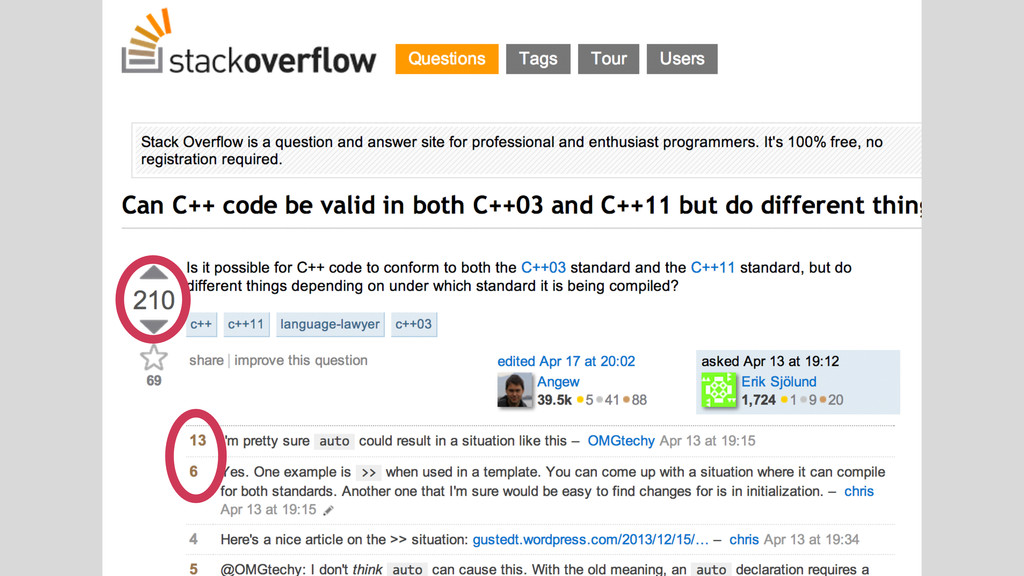
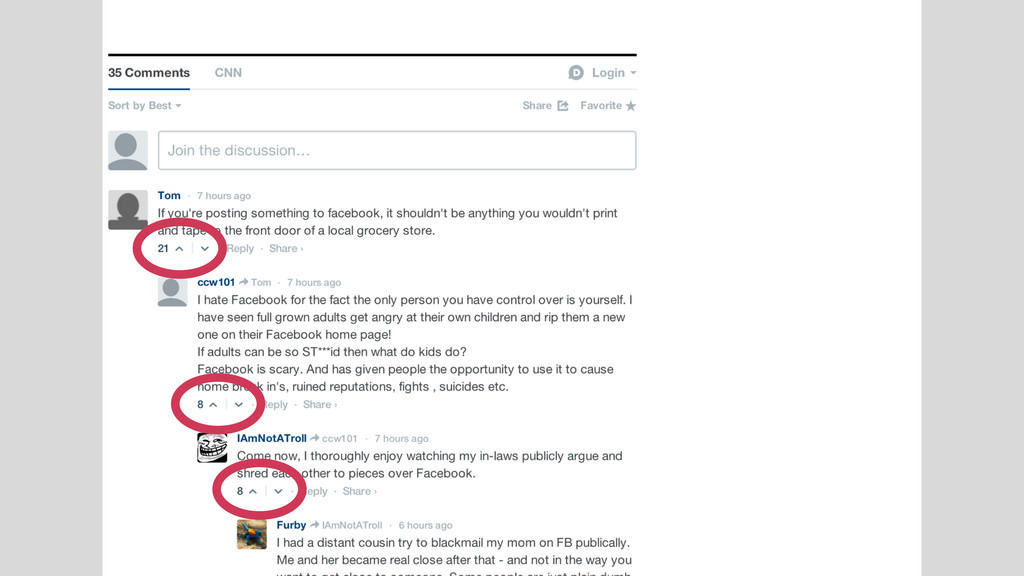
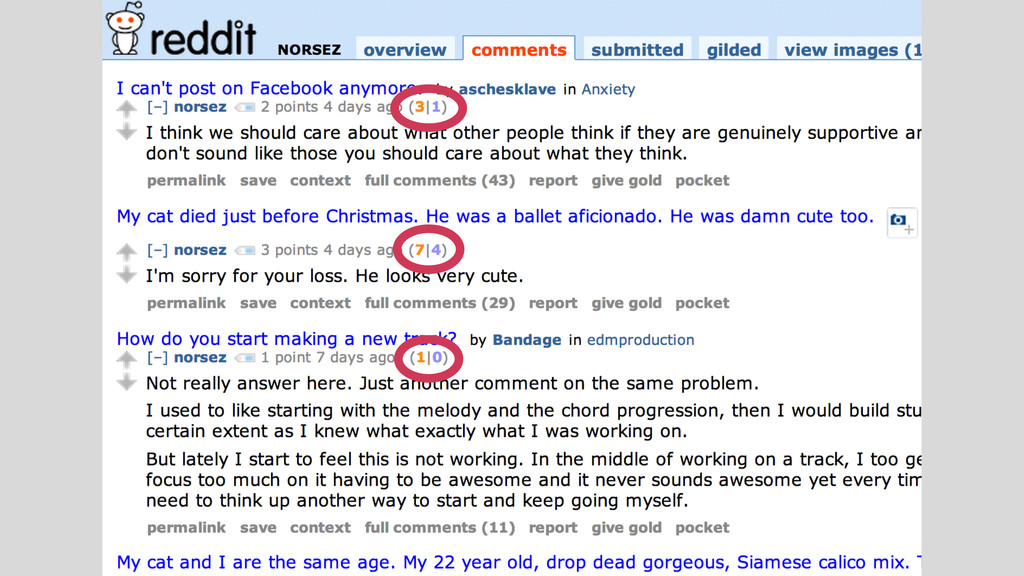
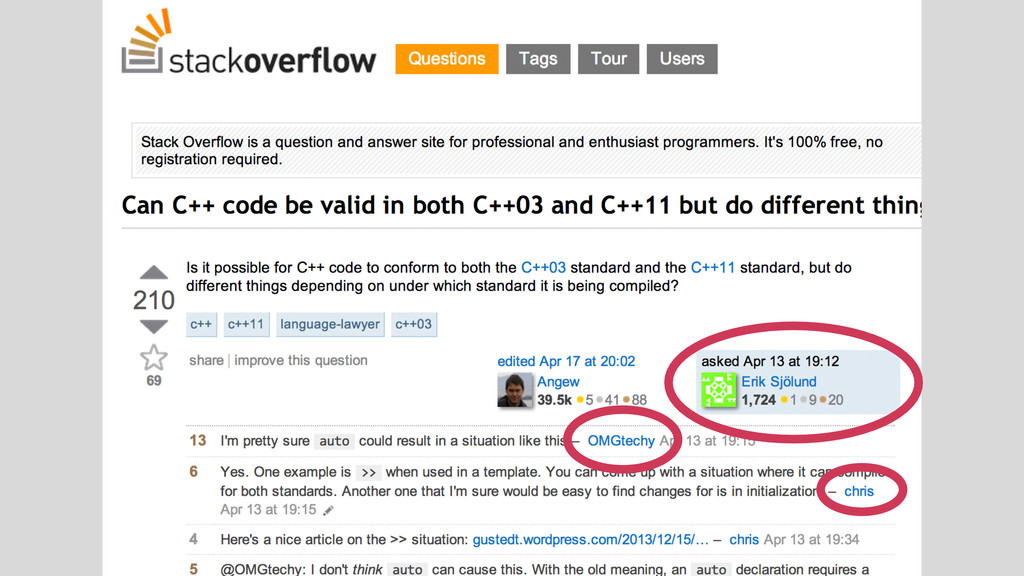
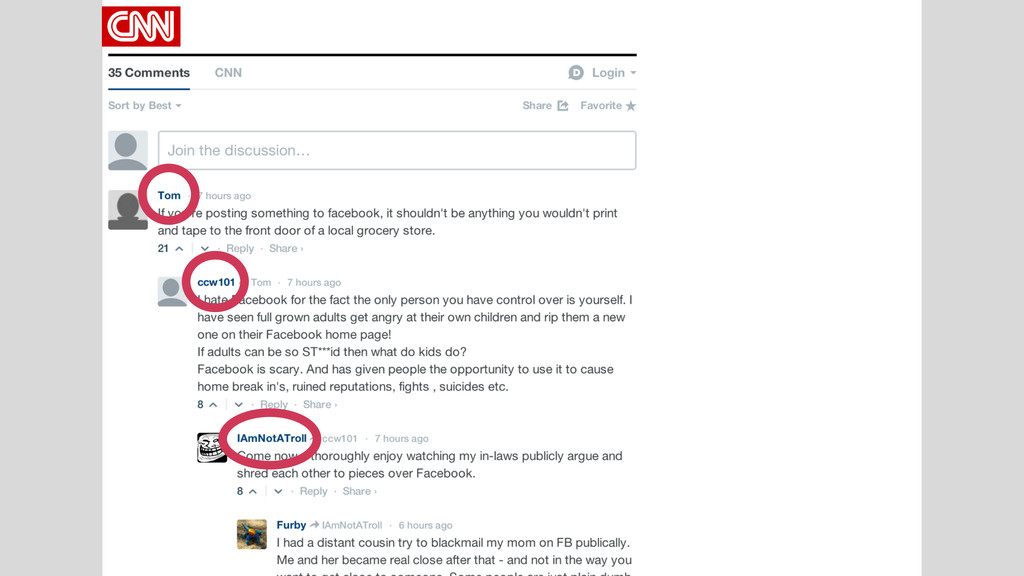
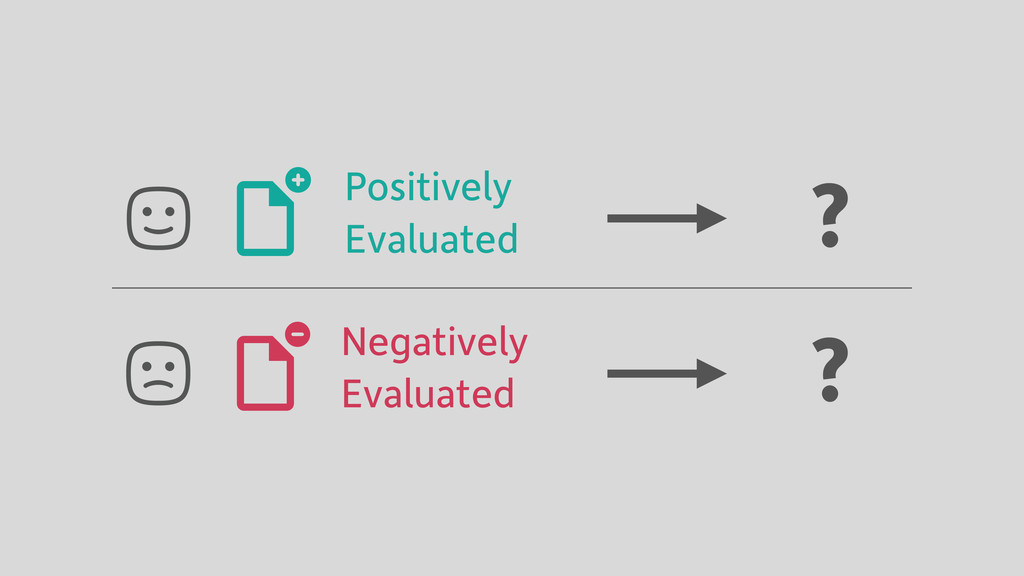
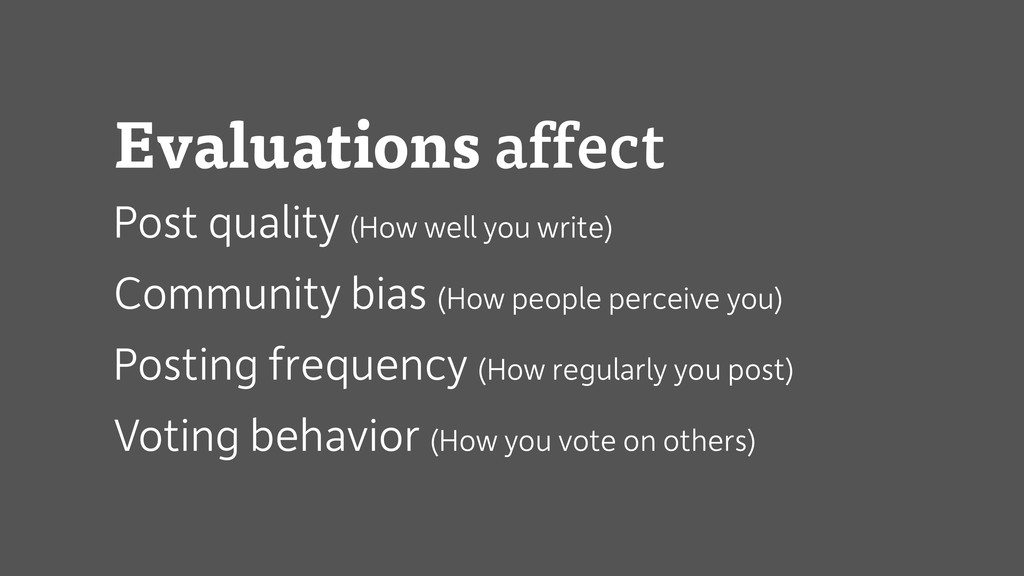
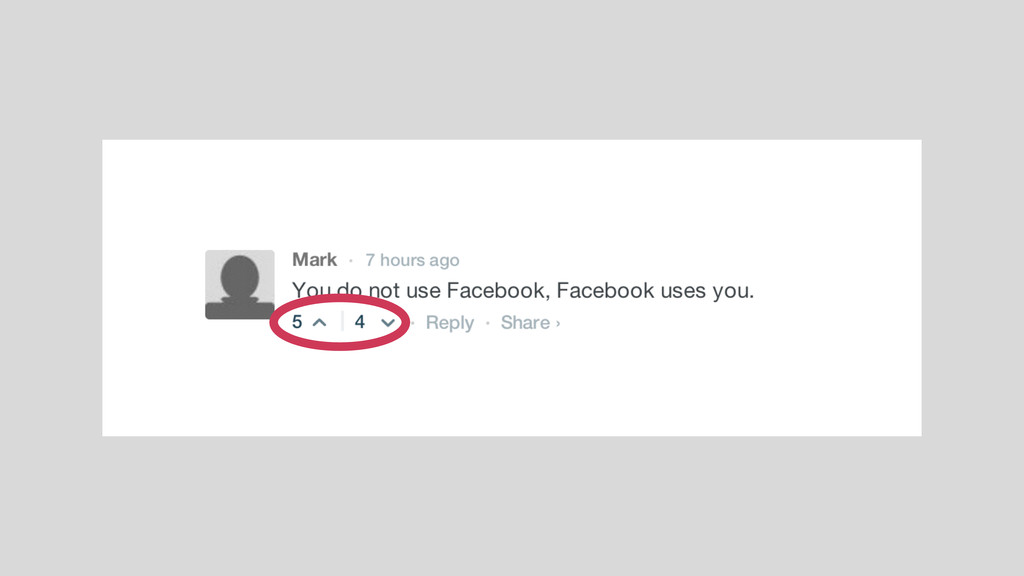
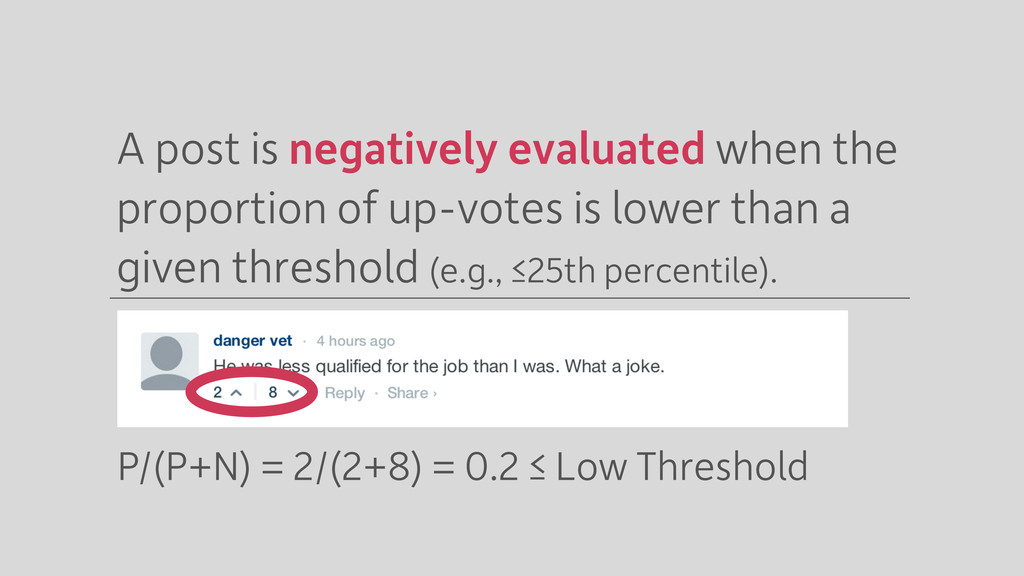
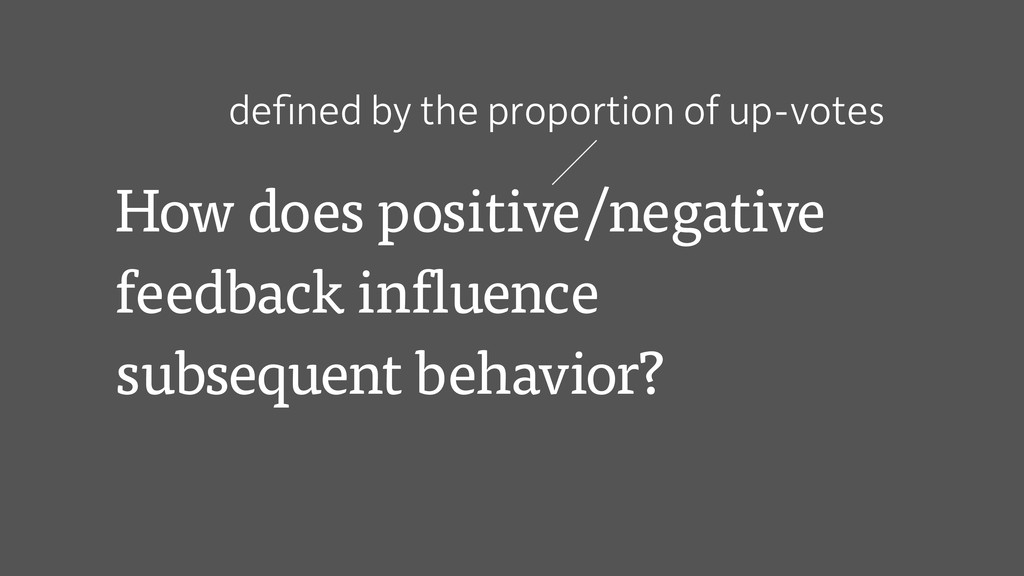
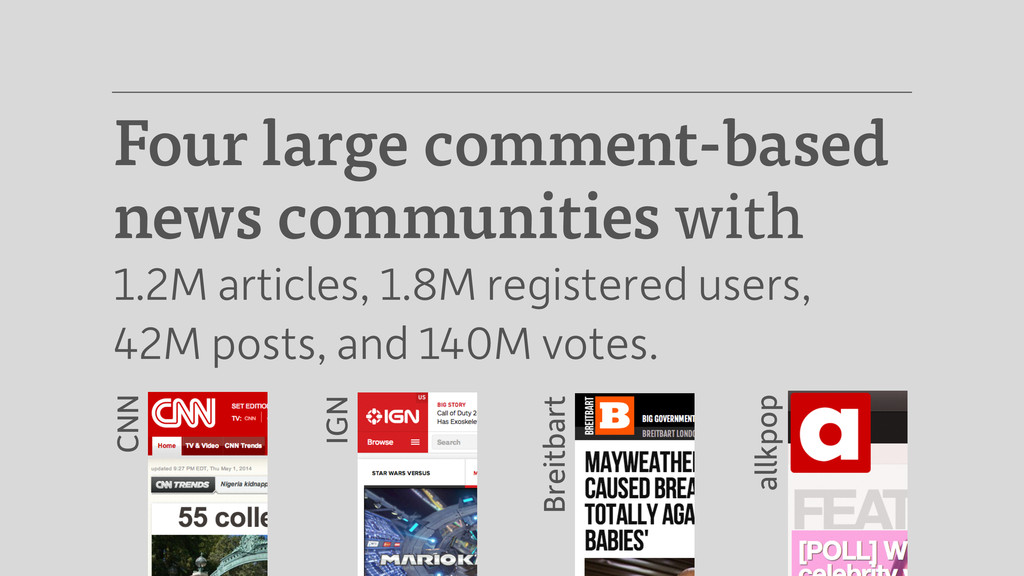
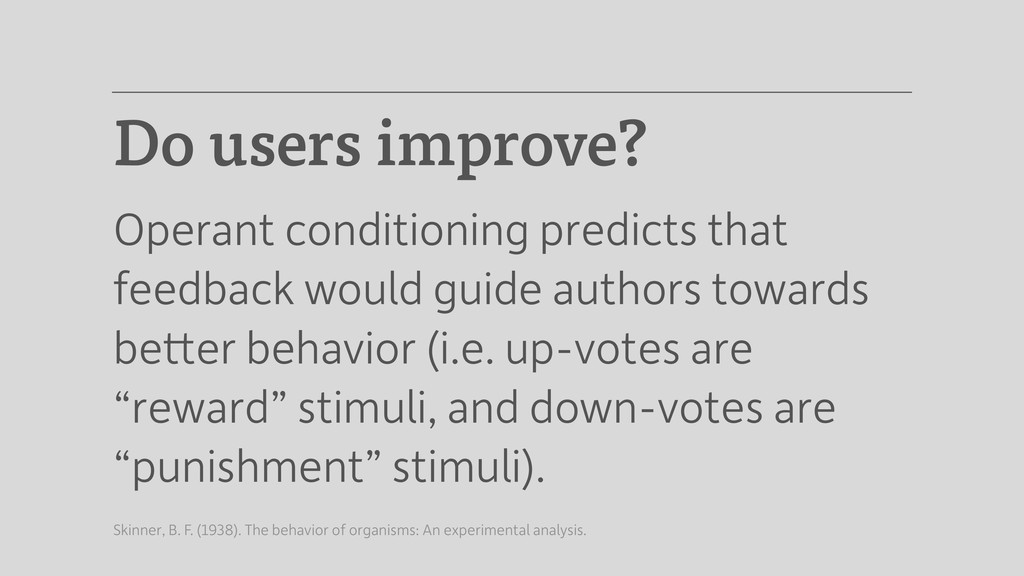
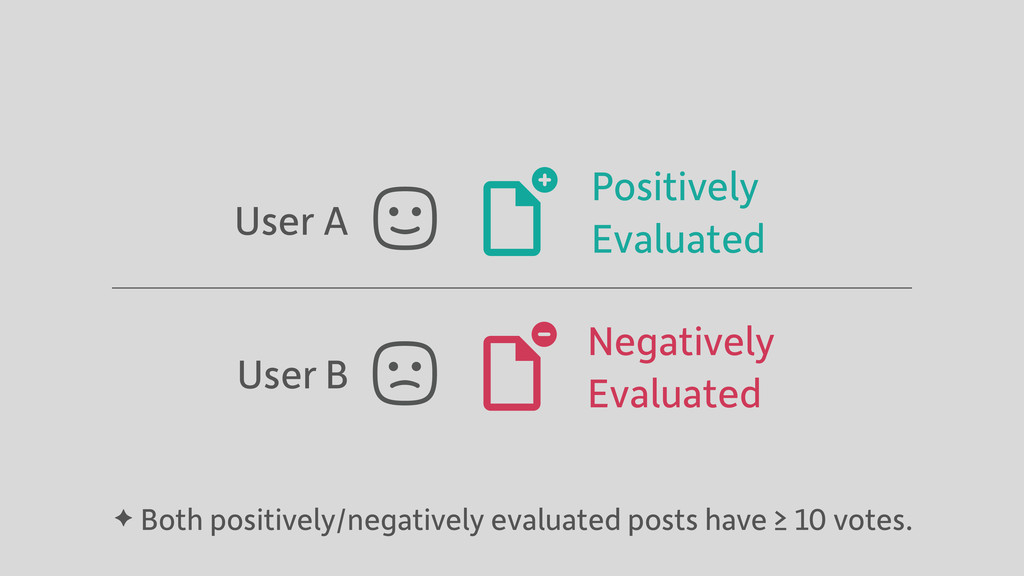
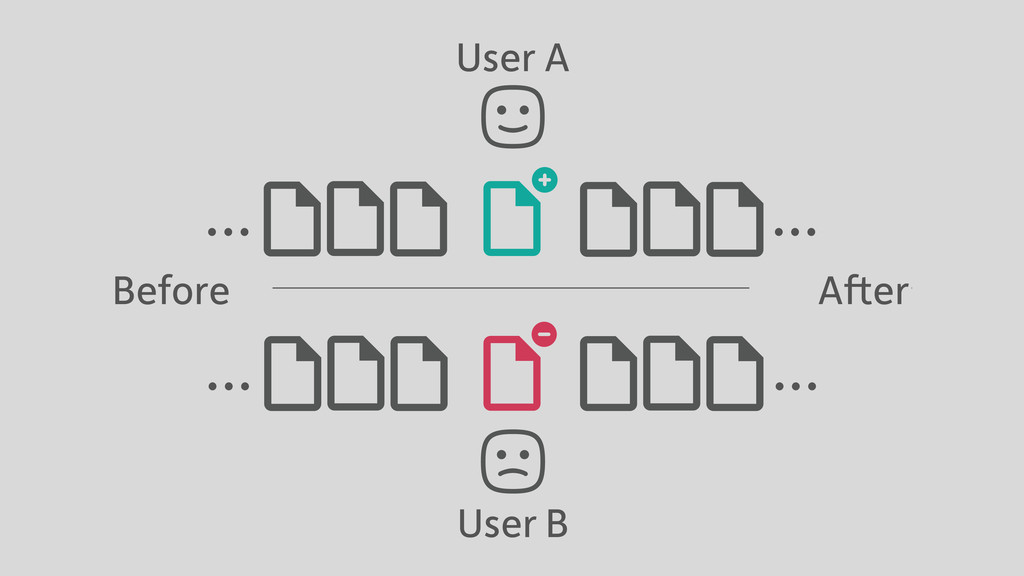
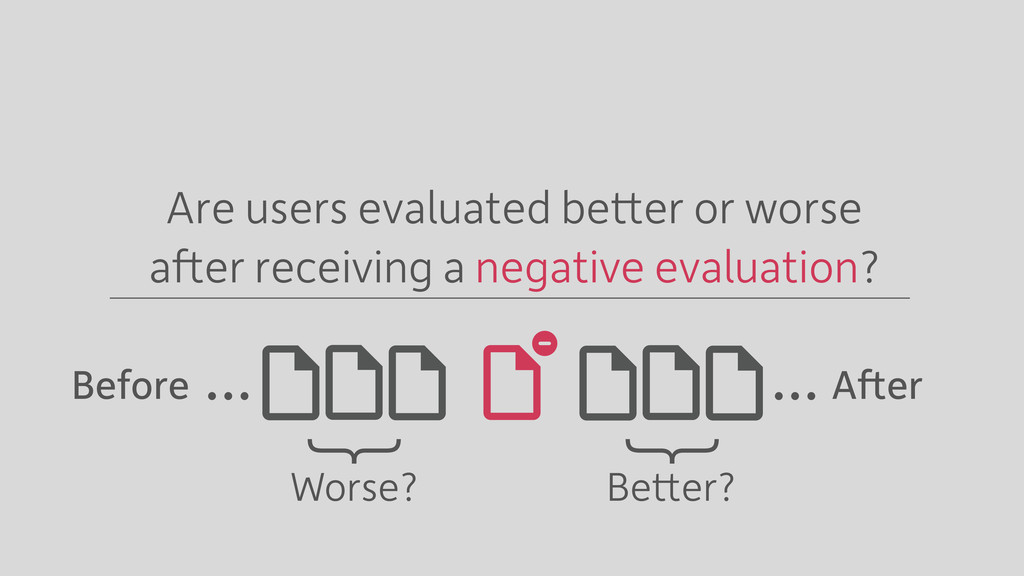
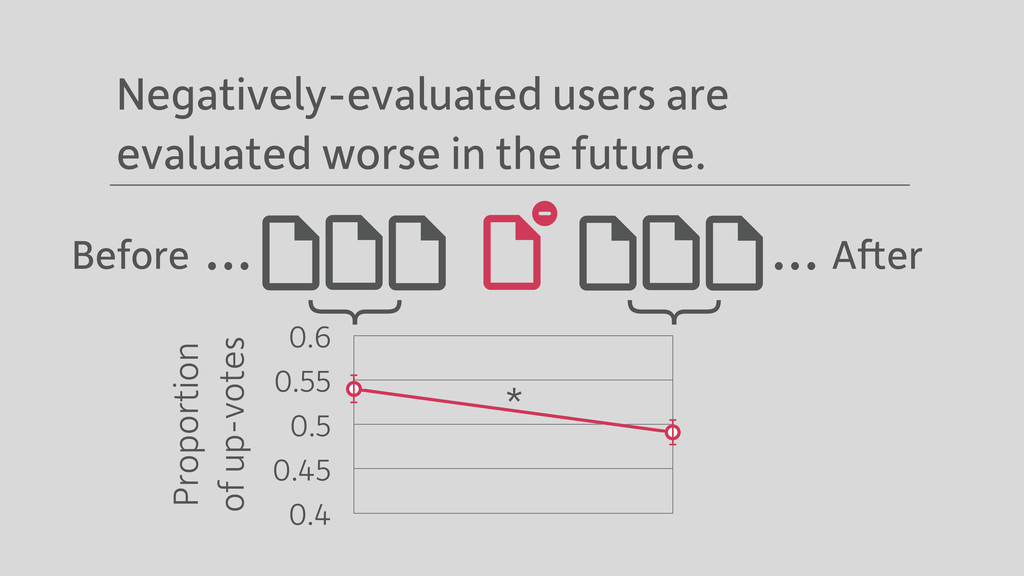
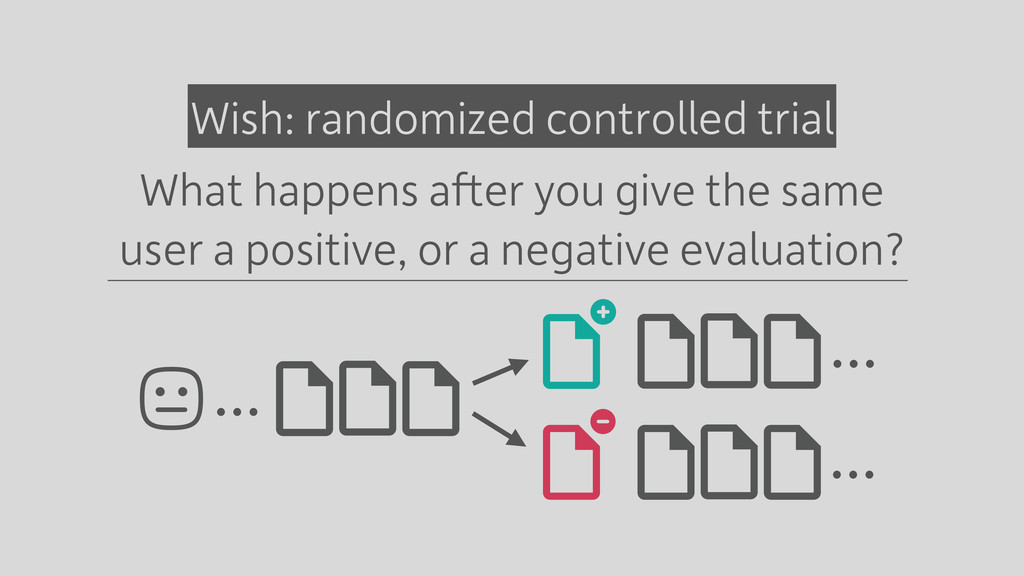
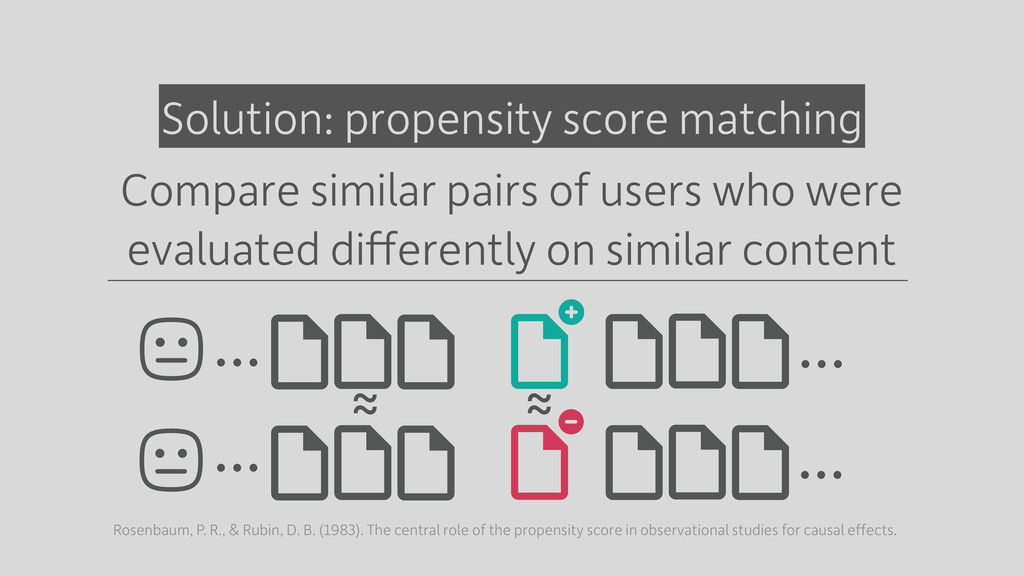
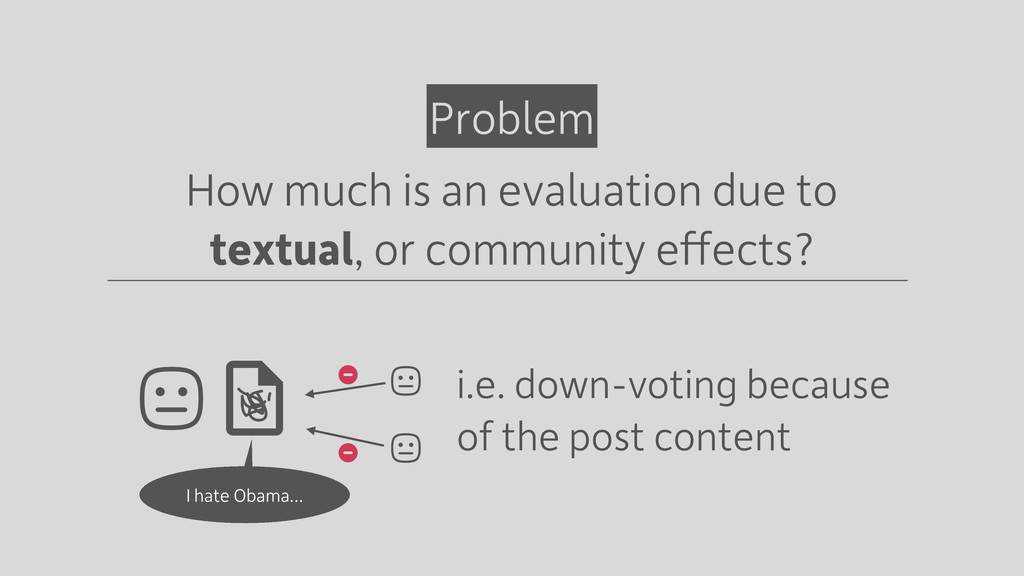
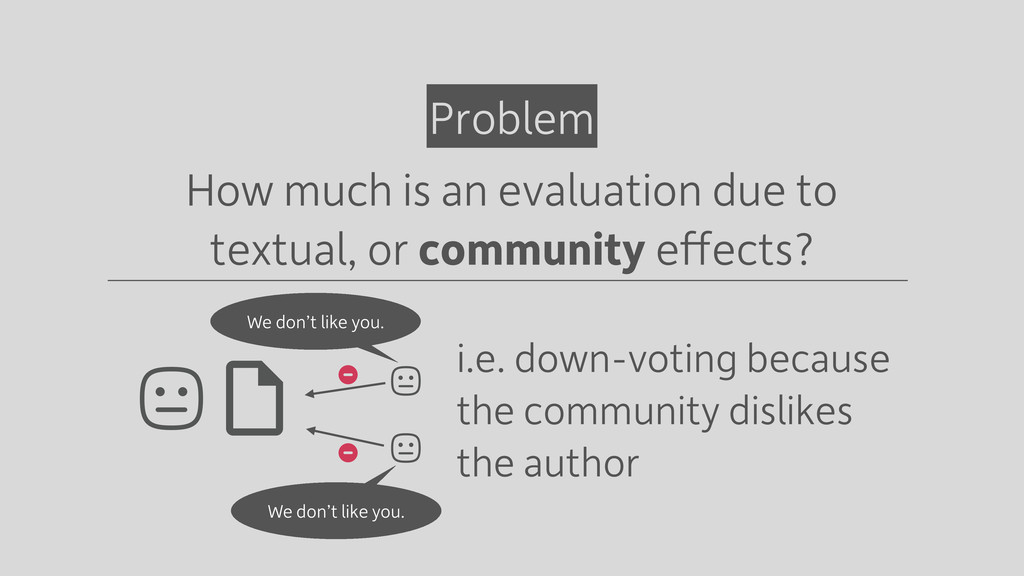
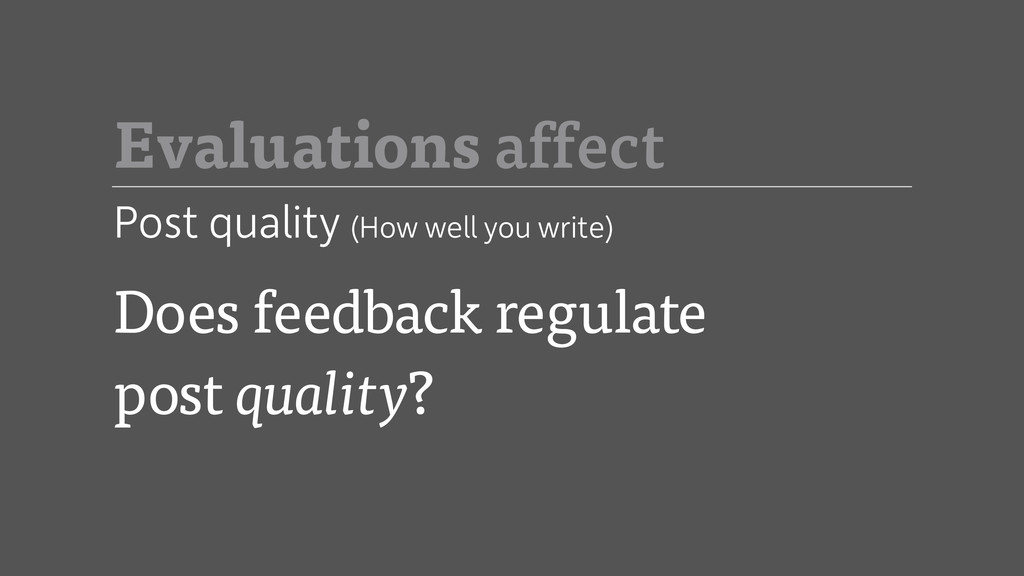
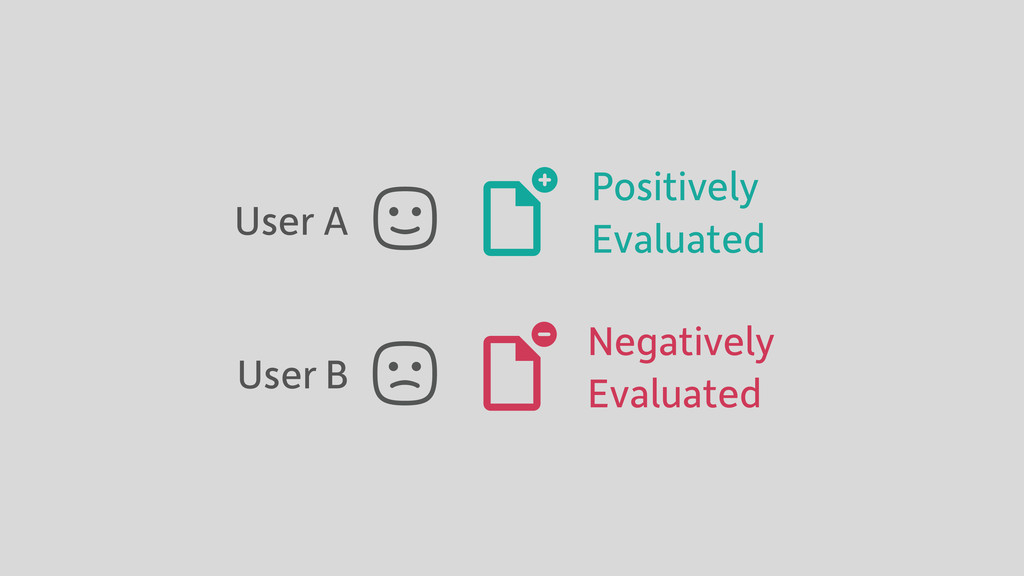
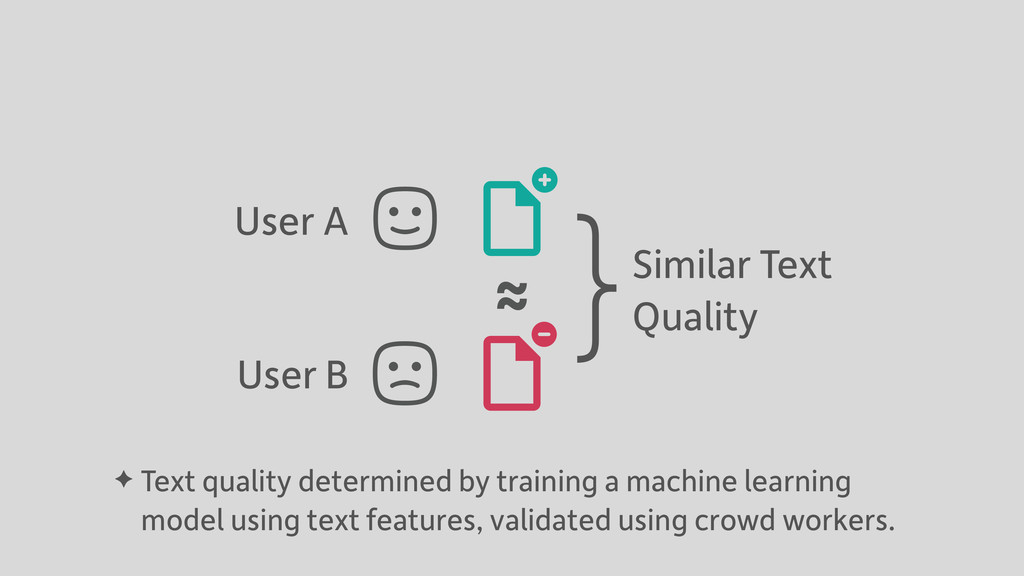
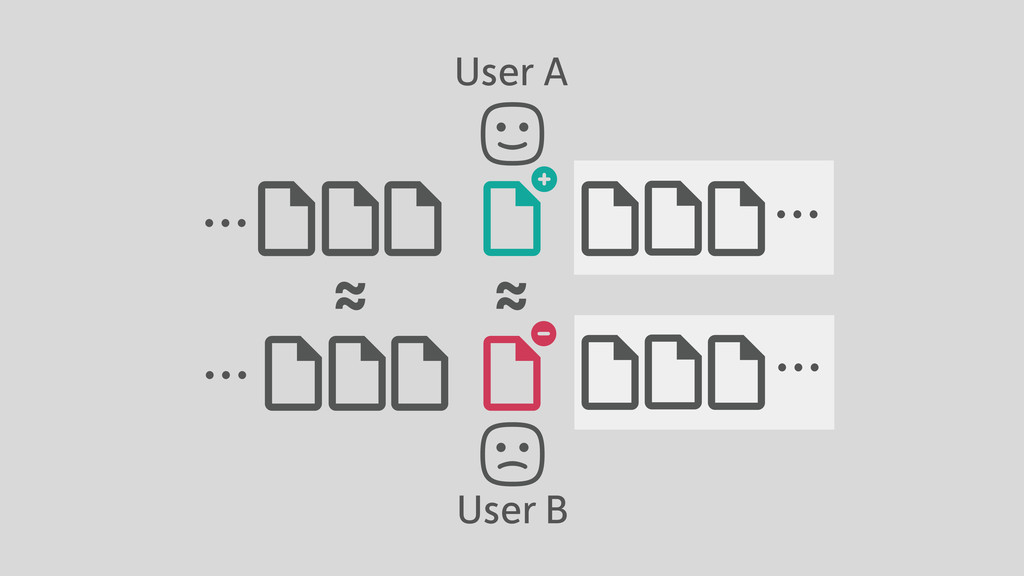
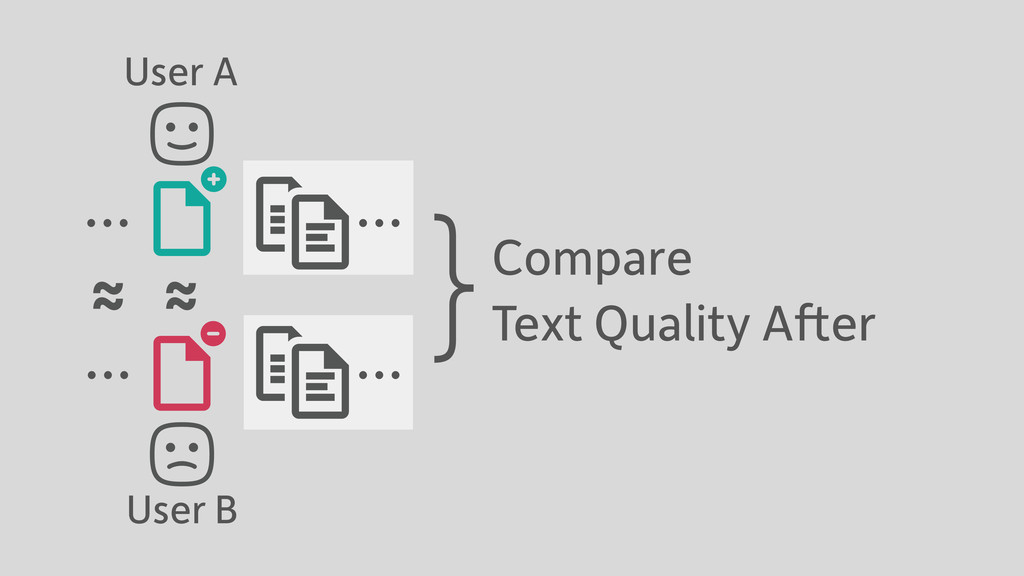
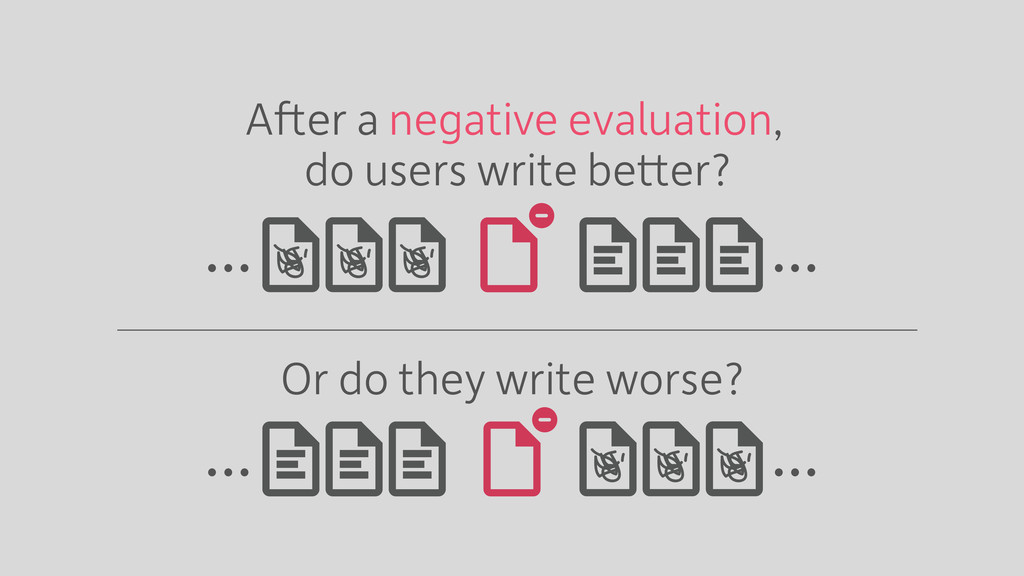
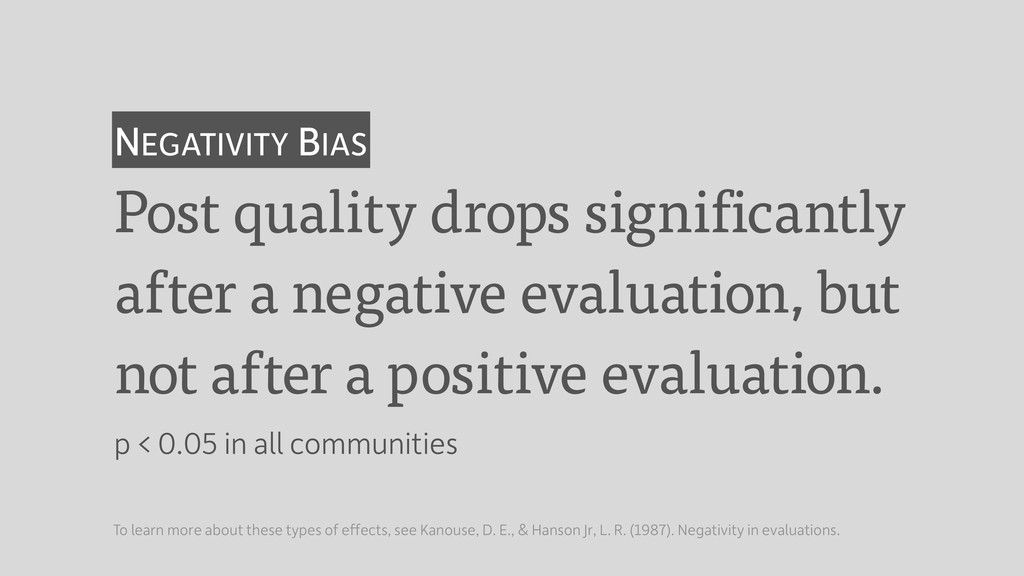
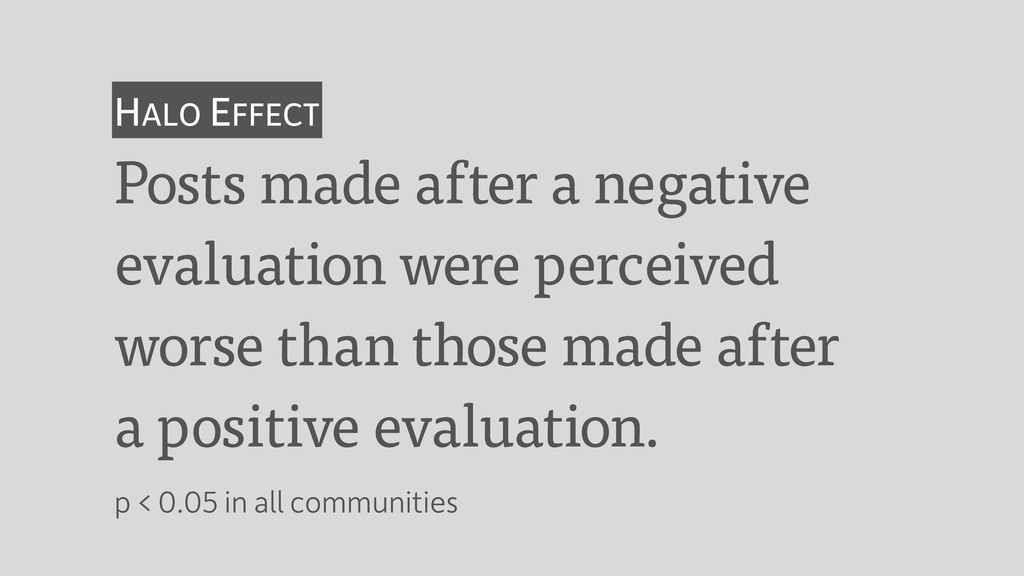
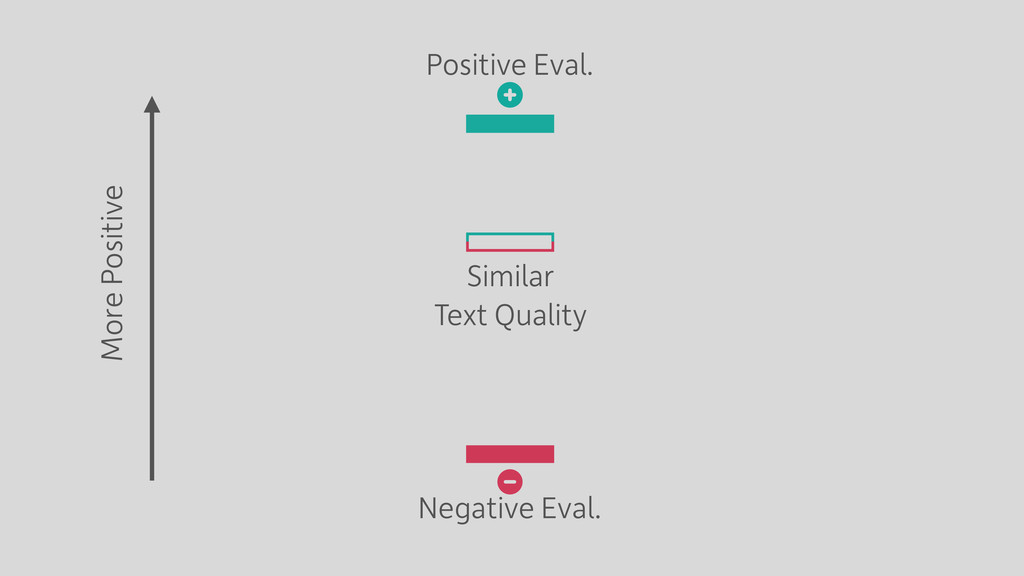
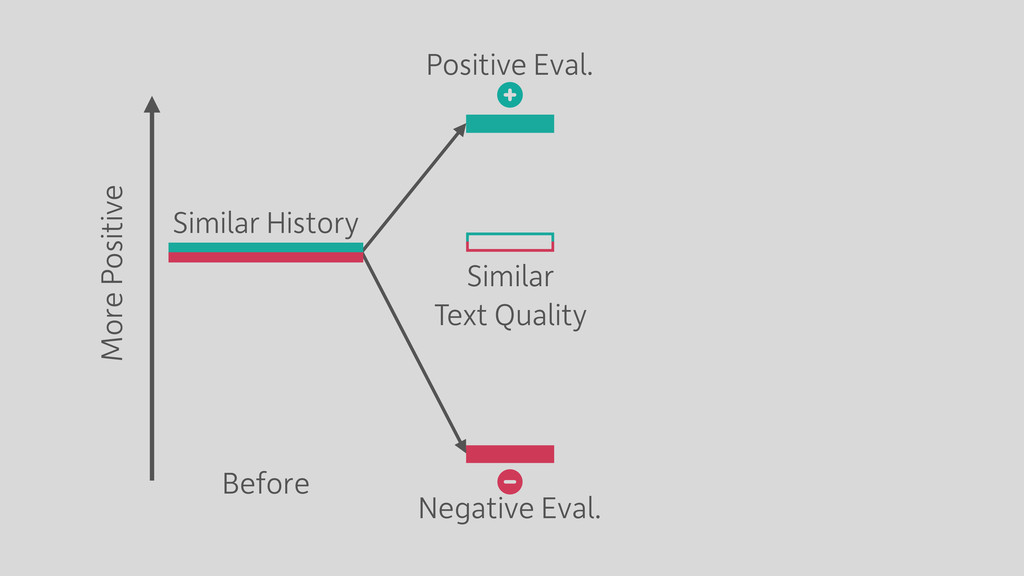
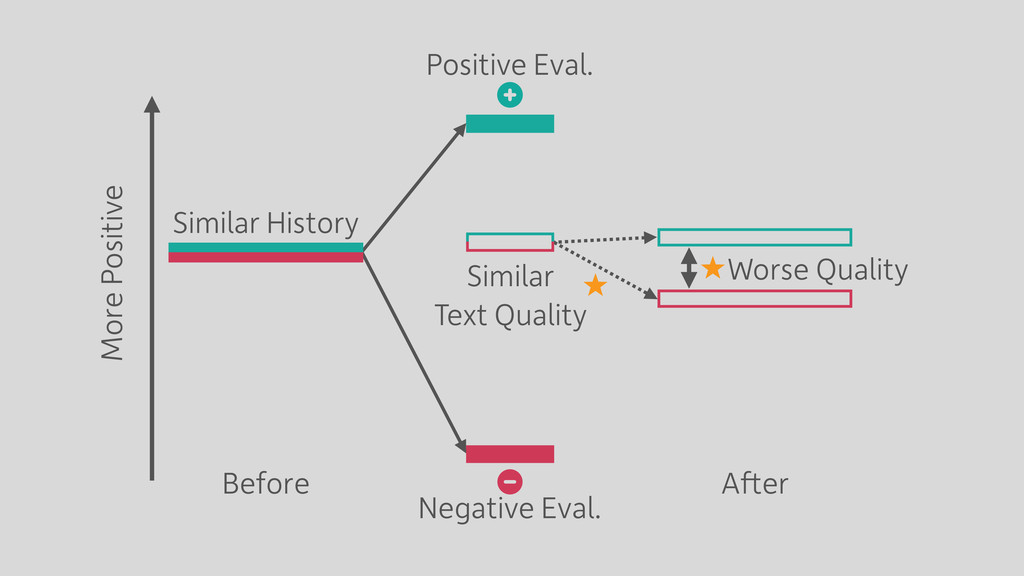
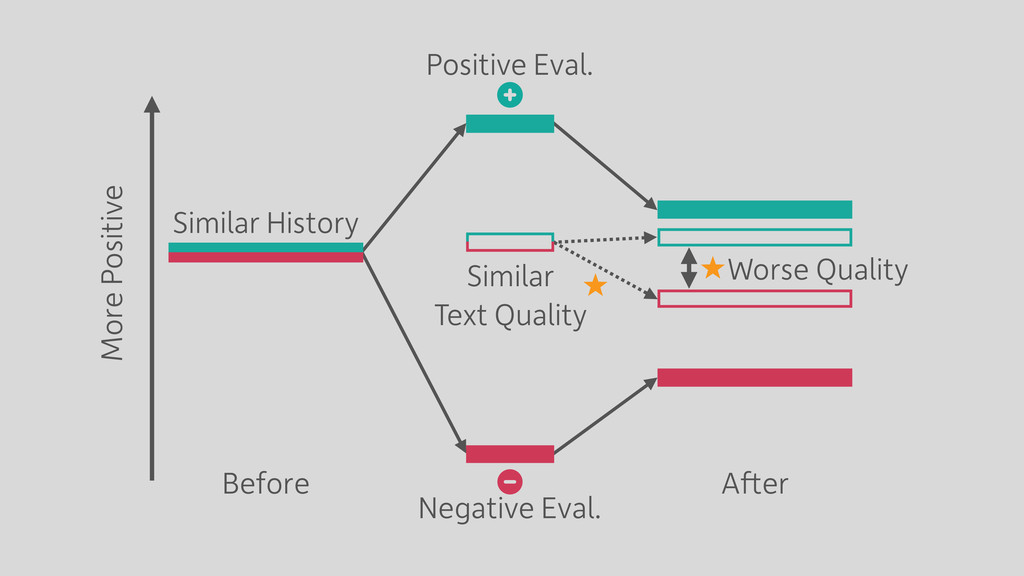
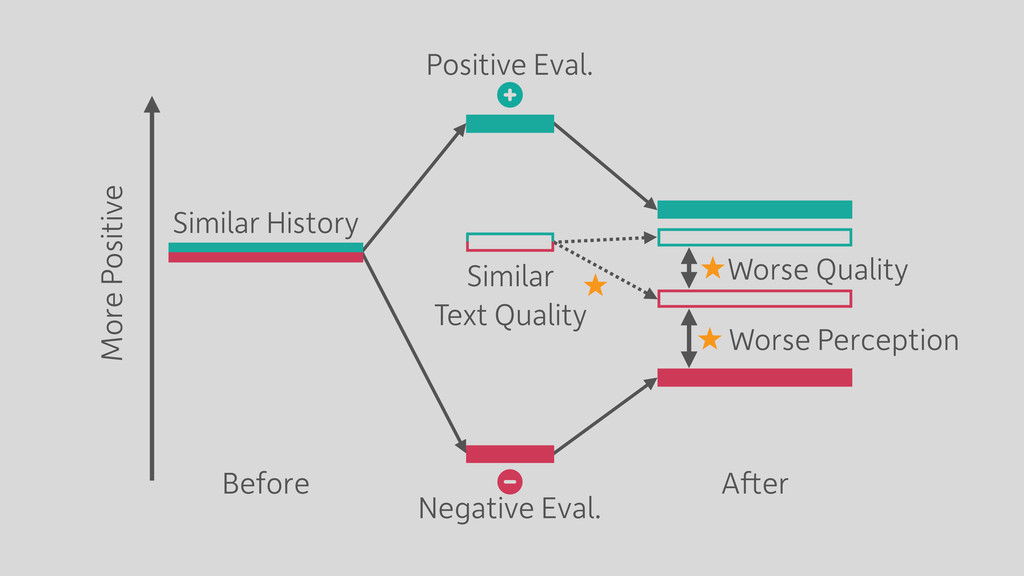
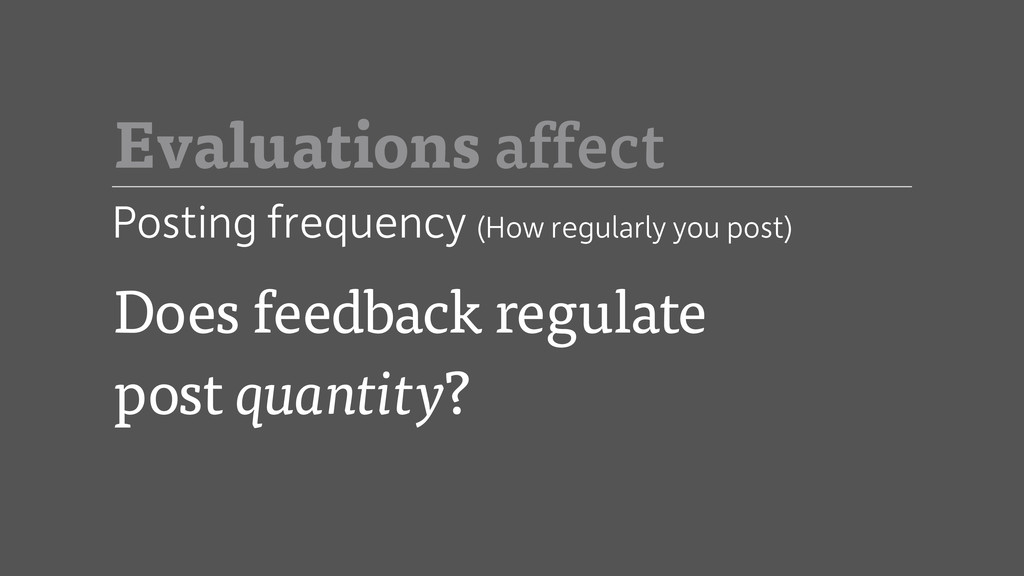
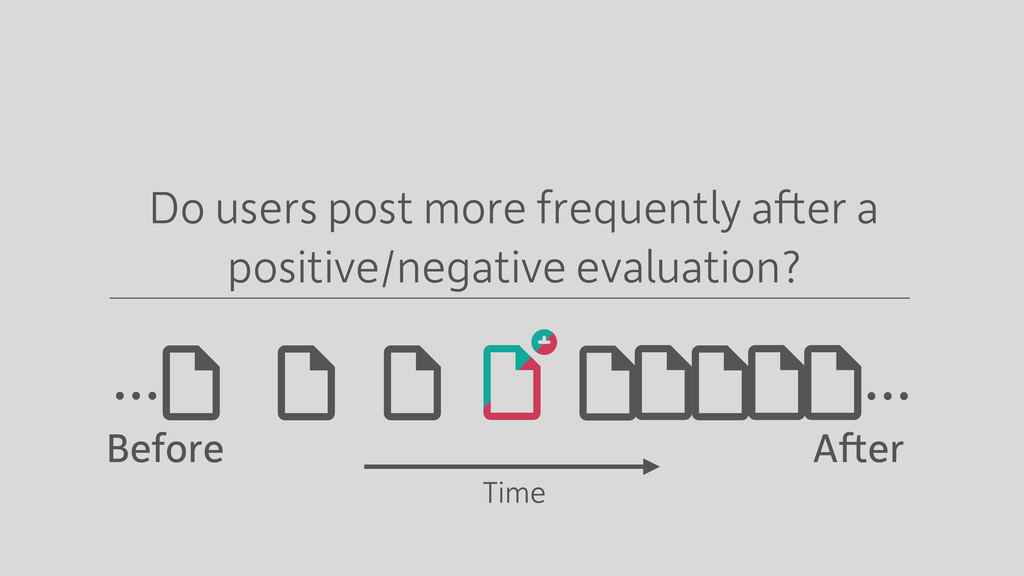
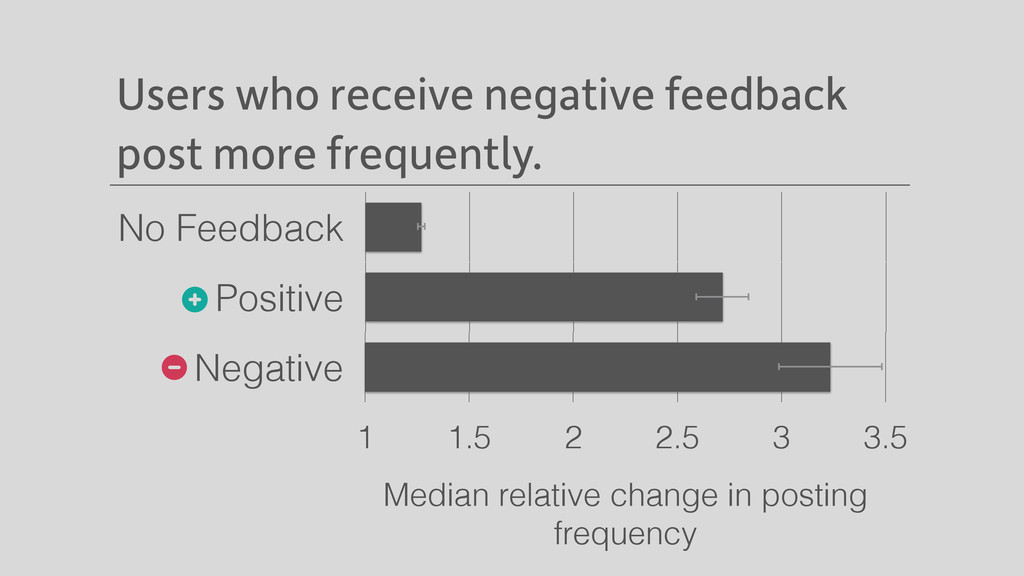
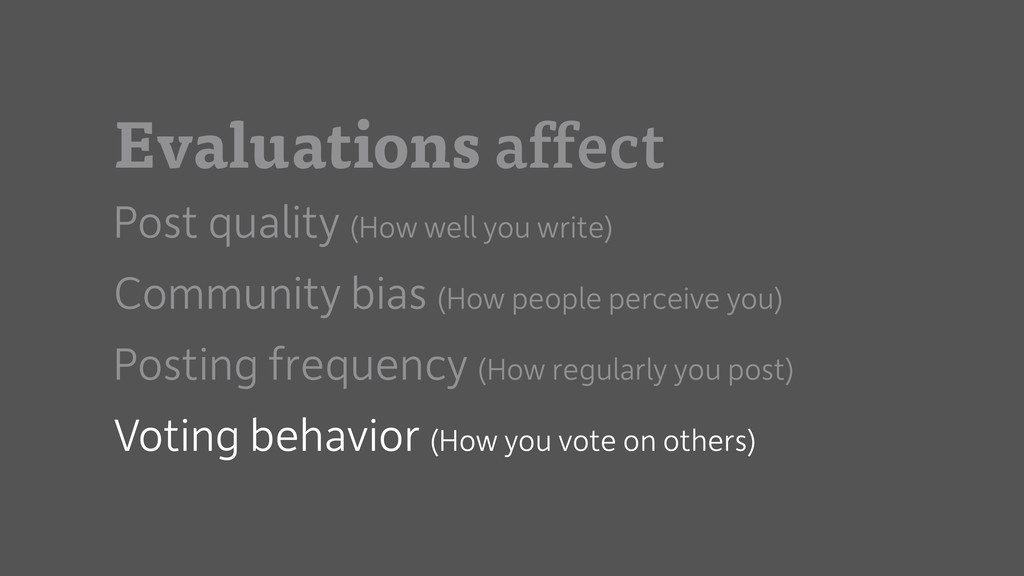
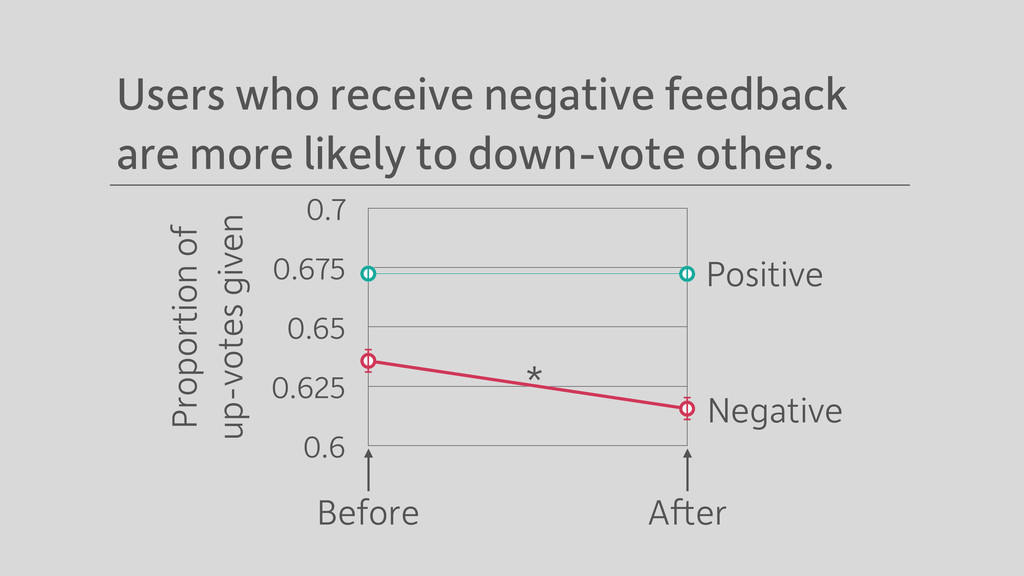
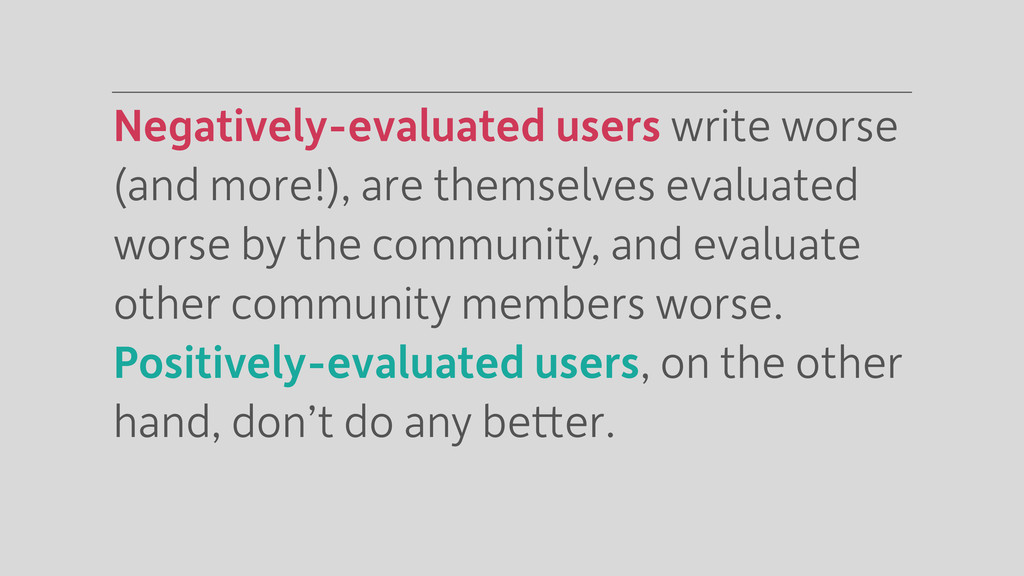
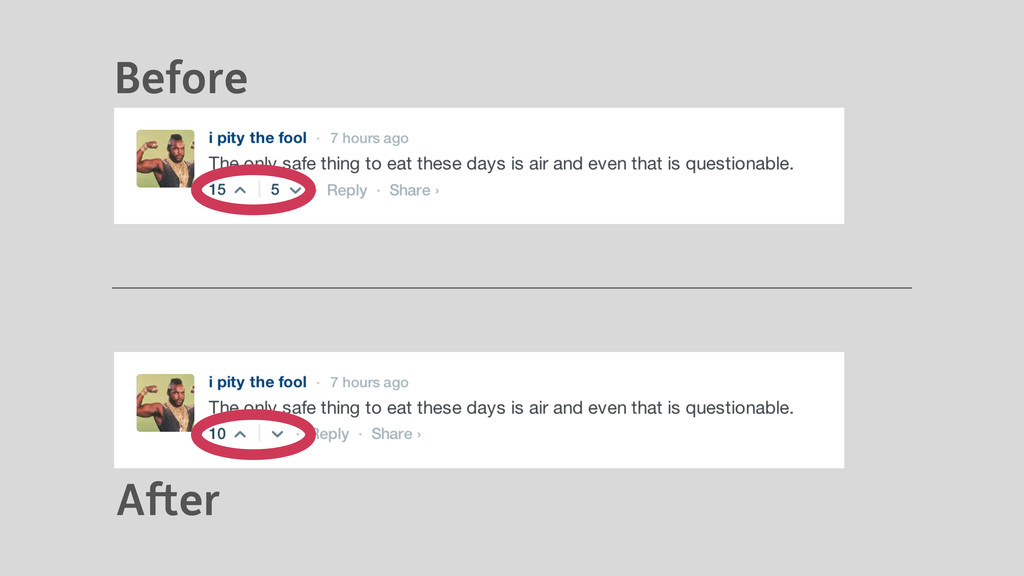
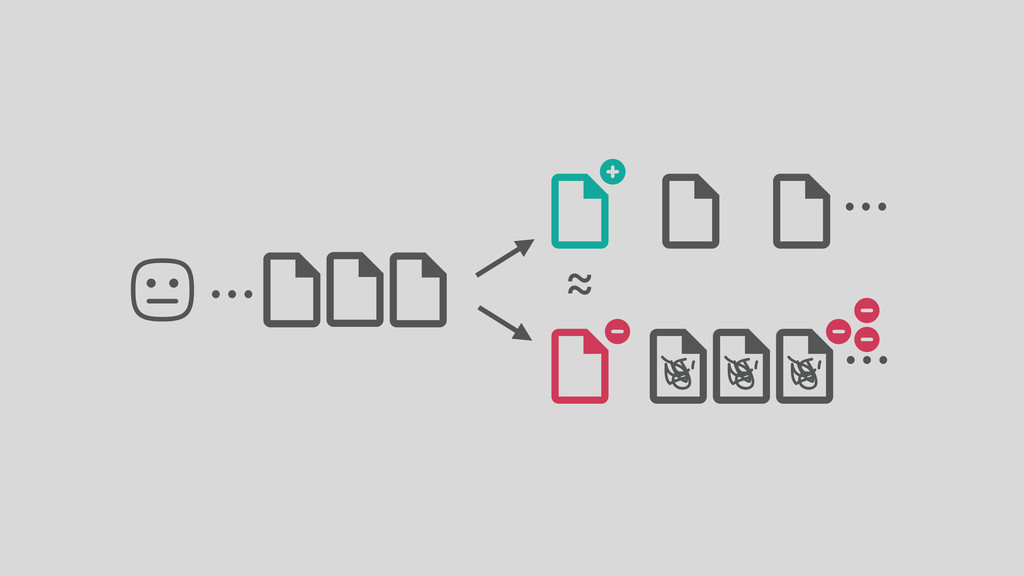
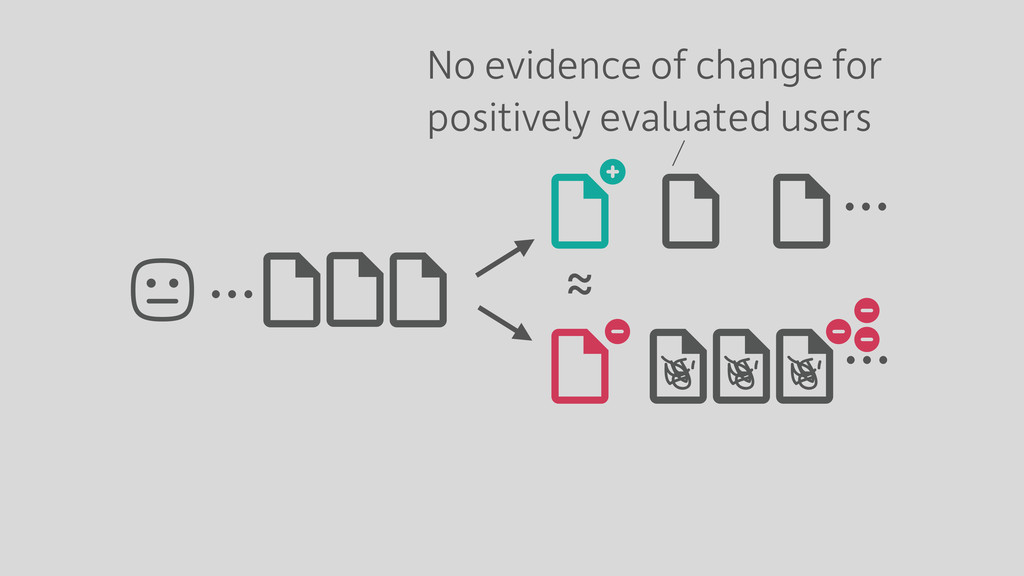
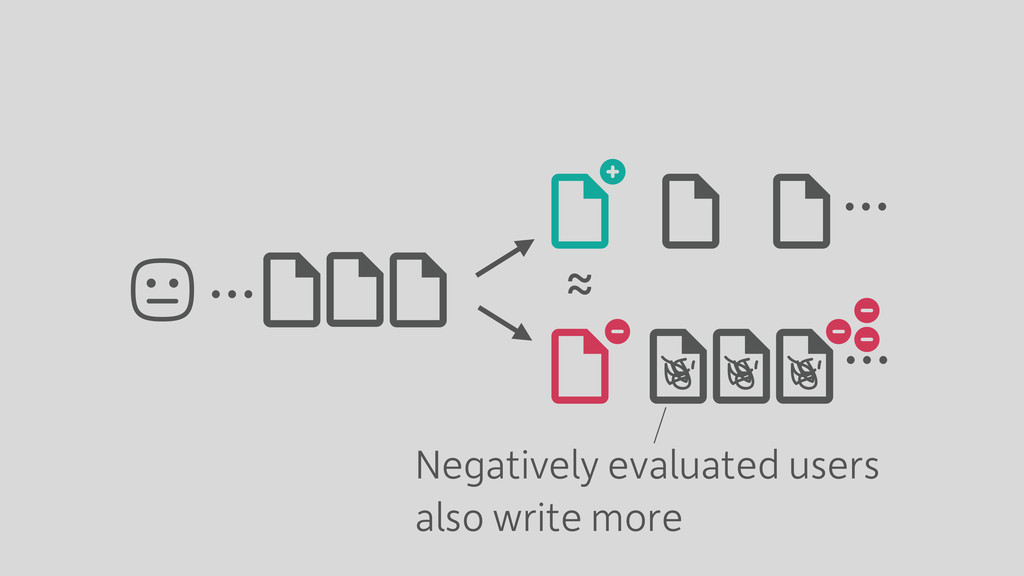
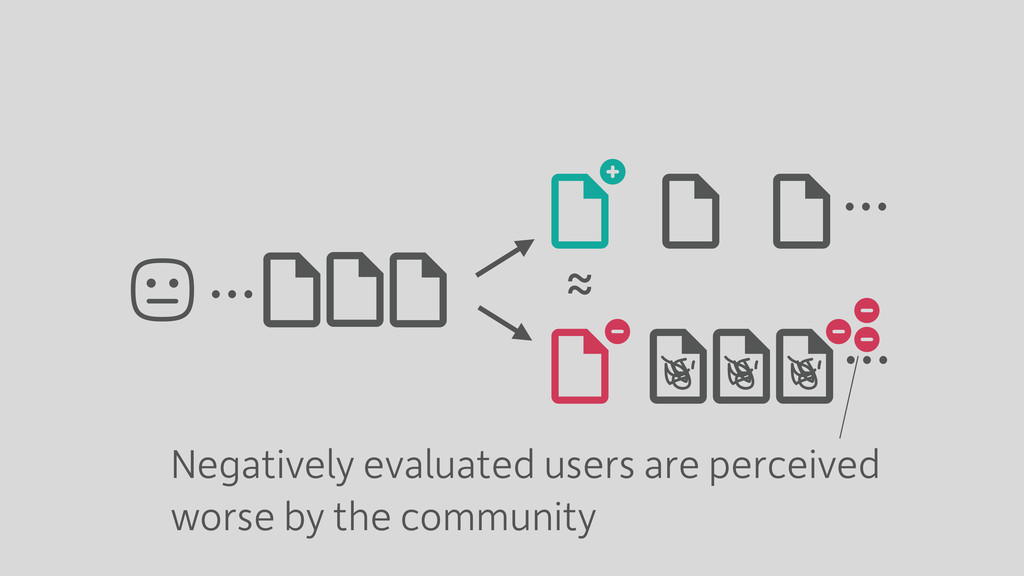
Social media systems rely on user feedback and rating mechanisms for personalization, ranking, and content filtering. However, when users evaluate content contributed by fellow users (e.g., by liking a post or voting on a comment), these evaluations create complex social feedback effects. We investigate how ratings on a piece of content affect its author’s future behavior. By studying four large comment-based news communities, we find that negative feedback leads to significant behavioral changes that are detrimental to the community. Not only do authors of negatively-evaluated content contribute more, but also their future posts are of lower quality, and are perceived by the community as such. Moreover, these authors are more likely to subsequently evaluate their fellow users negatively, percolating these effects through the community. In contrast, positive feedback does not carry similar effects, and neither encourages rewarded authors to write more, nor improves the quality of their posts. Interestingly, the authors that receive no feedback are most likely to leave a community. Furthermore, a structural analysis of the voter network reveals that evaluations polarize the community the most when positive and negative votes are equally split.

Justin Cheng

June 02, 2014
Tweet

More Decks by Justin Cheng

Other Decks in Research

Transcript

  1. How Community Feedback
    Shapes User Behavior
    Justin Cheng
    STANFORD
    Cristian Danescu-Niculescu-Mizil
    MAX PLANCK INSTITUTE SWS
    Jure Leskovec
    STANFORD

    View Slide

  2. People evaluate content
    all the time.

    View Slide

  3. View Slide

  4. View Slide

  5. View Slide

  6. View Slide

  7. When a user evaluates
    user-generated content,
    he/she is indirectly
    evaluating other users.

    View Slide

  8. Evaluations create social
    feedback loops that affect
    user behavior.

    View Slide

  9. View Slide

  10. View Slide

  11. View Slide

  12. View Slide

  13. How do people react to
    evaluations?

    View Slide

  14. How does positive/negative
    feedback influence
    subsequent behavior?

    View Slide

  15. Positively
    Evaluated
    Negatively
    Evaluated
    ?
    ?

    View Slide

  16. Evaluations affect
    Post quality (How well you write)
    Community bias (How people perceive you)
    Voting behavior (How you vote on others)
    Posting frequency (How regularly you post)

    View Slide

  17. Related work includes
    Quantifying social influence (e.g., voting)

    Muchnik, L., Aral, S., & Taylor, S. J. (2013). Social influence bias: A randomized experiment.
    Science.
    Predicting evaluations (e.g., helpfulness)
    Ghose, A., & Ipeirotis, P. G. (2011). Estimating the helpfulness and economic impact of
    product reviews: Mining text and reviewer characteristics. KDE.
    Examining what people talk about
    Chen, Z., & Berger, J. (2013). When, why, and how controversy causes conversation. JCR.

    View Slide

  18. How do people perceive
    community feedback?
    SIDE NOTE

    View Slide

  19. View Slide

  20. A post receives P up-votes and
    N down-votes. How do we then
    define a positive or negative
    evaluation?
    SIDE NOTE

    View Slide

  21. Doesn’t account for down-votes
    15
    P
    Number of up-votes
    0 15 15
    vs

    View Slide

  22. Doesn’t account for proportion of up-votes
    5
    P-N
    Difference in up-votes and down-votes
    0 50 45
    vs

    View Slide

  23. Doesn’t account for total number of votes
    4
    P/(P+N)
    Proportion of up-votes
    1 40 10
    vs

    View Slide

  24. To measure how users
    perceived votes,
    we asked crowd workers to rate, on a 7
    point scale, if they felt more positive, or
    negative about receiving a certain
    number of up/down-votes.

    View Slide

  25. 7 = Positive
    1 = Negative
    0 20
    20
    # of up-votes
    # of down-votes
    10
    10
    User ratings were mostly independent
    of the total number of votes

    View Slide

  26. P
    Number of up-votes
    P-N
    Difference in up/down-votes
    P/(P+N)
    Proportion of up-votes
    0.410
    0.879
    0.920
    R2

    View Slide

  27. A post is positively evaluated when the
    proportion of up-votes is higher than a
    given threshold (e.g., ≥75th percentile).
    P/(P+N) = 9/(9+1) = 0.9 ≥ High Threshold

    View Slide

  28. A post is negatively evaluated when the
    proportion of up-votes is lower than a
    given threshold (e.g., ≤25th percentile).
    P/(P+N) = 2/(2+8) = 0.2 ≤ Low Threshold

    View Slide

  29. How does positive/negative
    feedback influence
    subsequent behavior?
    defined by the proportion of up-votes

    View Slide

  30. Four large comment-based
    news communities with
    1.2M articles, 1.8M registered users,
    42M posts, and 140M votes.
    CNN
    IGN
    Breitbart
    allkpop

    View Slide

  31. How do evaluations change after
    a positive/negative evaluation?

    View Slide

  32. Do users improve?
    Operant conditioning predicts that
    feedback would guide authors towards
    better behavior (i.e. up-votes are
    “reward” stimuli, and down-votes are
    “punishment” stimuli).
    Skinner, B. F. (1938). The behavior of organisms: An experimental analysis.

    View Slide

  33. Or do they get worse?
    Feedback can have negative effects.
    People given only positive feedback tend
    to become complacent. Also, bad
    impressions are quicker to form and
    more resistant to disconfirmation.
    Brinko, K. T. (1993). The practice of giving feedback to improve teaching: what is effective?
    Baumeister, R. F., Bratslavsky, E., Finkenauer, C., & Vohs, K. D. (2001). Bad is stronger than good.

    View Slide

  34. User A
    Positively
    Evaluated
    Negatively
    Evaluated
    User B
    ✦ Both positively/negatively evaluated posts have ≥ 10 votes.

    View Slide

  35. User A
    User B


    Before After

    View Slide


  36. Better?
    Worse?
    Are users evaluated better or worse
    after receiving a positive evaluation?
    Before After
    {
    {

    View Slide


  37. Better?
    Worse?
    Are users evaluated better or worse
    after receiving a negative evaluation?
    Before After
    {
    {

    View Slide

  38. Proportion
    of up-votes
    0.4
    0.45
    0.5
    0.55
    0.6
    {
    {
    *
    Negatively-evaluated users are
    evaluated worse in the future.


    Before After

    View Slide

  39. Proportion
    of up-votes
    0.7
    0.75
    0.8
    0.85
    0.9
    {
    {
    Positively-evaluated users are
    evaluated no better/worse in the future.


    Before After

    View Slide

  40. Feedback does not seem to
    improve future behavior.
    SO FAR…

    View Slide


  41. What happens after you give the same
    user a positive, or a negative evaluation?
    Wish: randomized controlled trial

    View Slide


  42. Compare similar pairs of users who were
    evaluated differently on similar content
    Solution: propensity score matching

    ≈ ≈


    Rosenbaum, P. R., & Rubin, D. B. (1983). The central role of the propensity score in observational studies for causal effects.

    View Slide

  43. How much is an evaluation due to
    textual, or community effects?
    Problem

    View Slide

  44. How much is an evaluation due to
    textual, or community effects?
    Problem
    i.e. down-voting because
    of the post content
    I hate Obama…

    View Slide

  45. How much is an evaluation due to
    textual, or community effects?
    Problem
    i.e. down-voting because
    the community dislikes
    the author
    We don’t like you.
    We don’t like you.

    View Slide

  46. Evaluations affect
    Post quality (How well you write)
    Community bias (How people perceive you)
    Voting behavior (How you vote on others)
    Posting frequency (How regularly you post)

    View Slide

  47. Does feedback regulate
    post quality?
    Evaluations affect
    Post quality (How well you write)

    View Slide

  48. User A
    Positively
    Evaluated
    Negatively
    Evaluated
    User B

    View Slide

  49. User A
    User B
    Similar Text
    Quality
    }
    ✦ Text quality determined by training a machine learning
    model using text features, validated using crowd workers.

    View Slide

  50. User A
    User B


    {
    Similar History
    Number of posts,
    overall proportion
    of up-votes, etc.

    View Slide

  51. User A
    User B


    View Slide

  52. User A
    User B


    Compare
    Text Quality After
    }

    View Slide


  53. After a positive evaluation,
    Or do they write worse?
    do users write better?


    View Slide


  54. After a negative evaluation,
    Or do they write worse?
    do users write better?


    View Slide

  55. Post quality drops significantly
    after a negative evaluation, but
    not after a positive evaluation.
    p < 0.05 in all communities
    NEGATIVITY BIAS
    To learn more about these types of effects, see Kanouse, D. E., & Hanson Jr, L. R. (1987). Negativity in evaluations.

    View Slide

  56. Evaluations affect
    Post quality (How well you write)
    Community bias (How people perceive you)
    Voting behavior (How you vote on others)
    Posting frequency (How regularly you post)

    View Slide

  57. How does community
    perception of a user change
    after an evaluation?
    Evaluations affect
    Community bias (How people perceive you)

    View Slide

  58. Community Bias
    Actual Evaluation P/(P+N)
    Text Quality
    Text Quality
    Up-votes
    Down-votes
    0.9
    0.8
    0.9-0.8
    = +0.1

    View Slide

  59. User A
    User B


    Compare
    Community Bias
    After
    }

    View Slide

  60. Does the community
    perceive a user worse
    after a negative, than a
    positive evaluation?
    User A
    User B


    View Slide

  61. Posts made after a negative
    evaluation were perceived
    worse than those made after
    a positive evaluation.
    p < 0.05 in all communities
    HALO EFFECT

    View Slide

  62. More Positive
    Positive Eval.
    Negative Eval.

    View Slide

  63. More Positive
    Similar

    Text Quality
    Positive Eval.
    Negative Eval.

    View Slide

  64. Before
    More Positive
    Similar

    Text Quality
    Similar History
    Positive Eval.
    Negative Eval.

    View Slide

  65. Before
    More Positive
    After
    Similar

    Text Quality
    Similar History
    Positive Eval.
    Negative Eval.

    View Slide

  66. Before
    More Positive
    After
    Similar

    Text Quality
    Similar History
    Positive Eval.
    Negative Eval.
    Worse Quality

    View Slide

  67. Before
    More Positive
    After
    Similar

    Text Quality
    Similar History
    Positive Eval.
    Negative Eval.
    Worse Quality

    View Slide

  68. Before
    More Positive
    After
    Similar

    Text Quality
    Similar History
    Positive Eval.
    Negative Eval.
    Worse Perception
    Worse Quality

    View Slide

  69. Evaluations affect
    Post quality (How well you write)
    Community bias (How people perceive you)
    Voting behavior (How you vote on others)
    Posting frequency (How regularly you post)

    View Slide

  70. Posting frequency (How regularly you post)
    Does feedback regulate
    post quantity?
    Evaluations affect

    View Slide

  71. Do users post more frequently after a
    positive/negative evaluation?


    Before After
    Time

    View Slide

  72. Users who receive negative feedback
    post more frequently.
    No Feedback
    Positive
    Negative
    Median relative change in posting
    frequency
    1 1.5 2 2.5 3 3.5

    View Slide

  73. Users who receive negative feedback
    post more frequently.
    No Feedback
    Positive
    Negative
    Times more frequent after vs. before
    1 1.5 2 2.5 3 3.5
    Don’t feed the trolls!

    View Slide

  74. Evaluations affect
    Post quality (How well you write)
    Community bias (How people perceive you)
    Voting behavior (How you vote on others)
    Posting frequency (How regularly you post)

    View Slide

  75. Does feedback result in
    subsequent backlash?
    Evaluations affect
    Voting behavior (How you vote on others)

    View Slide

  76. Proportion of
    up-votes given
    0.6
    0.625
    0.65
    0.675
    0.7
    Before After
    Positive
    Negative
    *
    Users who receive negative feedback
    are more likely to down-vote others.

    View Slide

  77. Is there a downward spiral in
    online communities?

    View Slide

  78. The proportion of down-votes is
    increasing over time.
    Proportion of
    down-votes
    0.17
    0.19
    0.21
    0.23
    Jan Feb Mar Apr May Jun Jul Aug
    78

    View Slide

  79. The proportion of down-votes is
    increasing over time.
    Proportion of
    down-votes
    0.17
    0.19
    0.21
    0.23
    Jan Feb Mar Apr May Jun Jul Aug
    79
    0.8m down-votes
    1.7m down-votes

    View Slide

  80. 0.18
    0.23
    Jan Mar May Jul
    80
    0.10
    0.20
    Jan Mar May Jul
    0
    0.12
    Jan Mar May Jul
    0.05
    0.11
    Nov Jan Mar May
    Breitbart allkpop
    CNN IGN

    View Slide

  81. The effects of negative feedback
    are more pronounced than
    those of positive feedback.

    View Slide

  82. Negatively-evaluated users write worse
    (and more!), are themselves evaluated
    worse by the community, and evaluate
    other community members worse.
    Positively-evaluated users, on the other
    hand, don’t do any better.

    View Slide

  83. After
    Before

    View Slide

  84. Future work could look at
    1. communities that support only
    positive feedback (e.g., likes),
    2. the effects of user reputation,
    3. deeper linguistic analysis, and
    4. experiments to establish causality.

    View Slide

  85. Also in the paper are
    1. details of the matching experiment,
    2. differences within a single thread
    and across multiple threads, and
    3. the organization of voting networks

    View Slide


  86. View Slide


  87. Negatively evaluated users
    write worse

    View Slide


  88. No evidence of change for
    positively evaluated users

    View Slide


  89. Negatively evaluated users
    also write more

    View Slide


  90. Negatively evaluated users are perceived
    worse by the community

    View Slide

  91. How Community Feedback
    Shapes User Behavior
    Justin Cheng
    STANFORD
    Cristian Danescu-Niculescu-Mizil
    MAX PLANCK INSTITUTE SWS
    Jure Leskovec
    STANFORD

    View Slide