Upgrade to Pro — share decks privately, control downloads, hide ads and more …

Antisocial Computing

Antisocial Computing

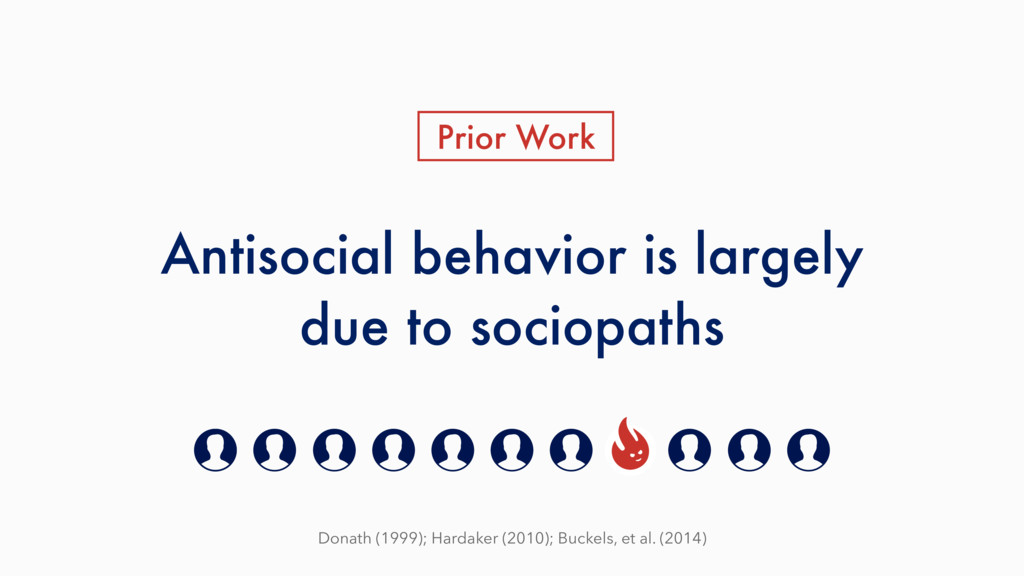
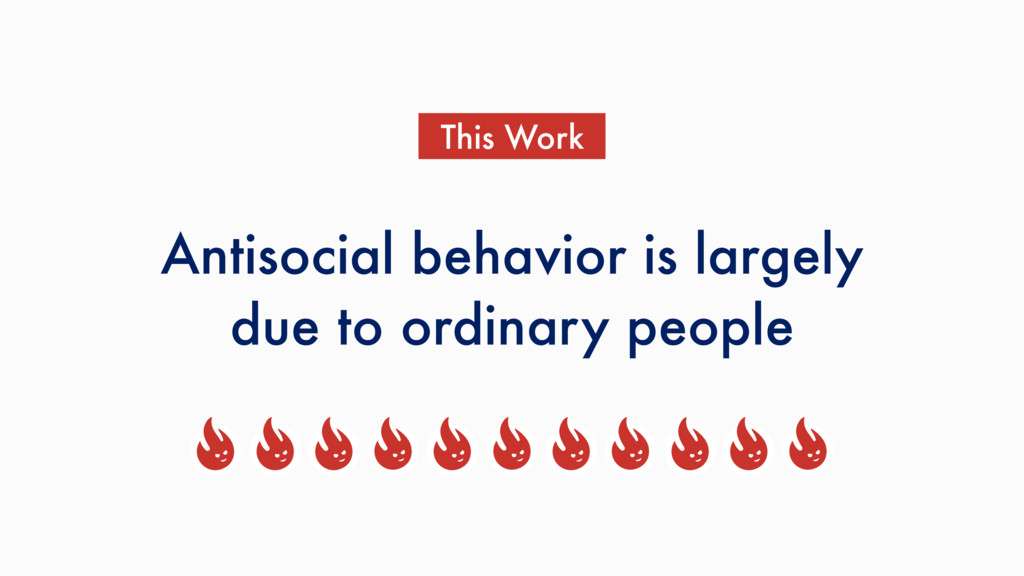
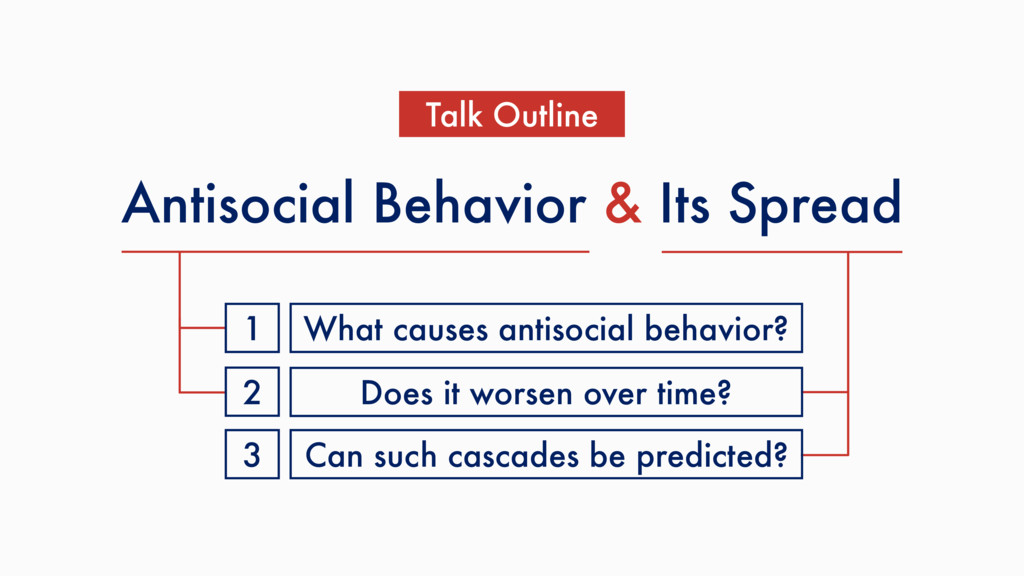
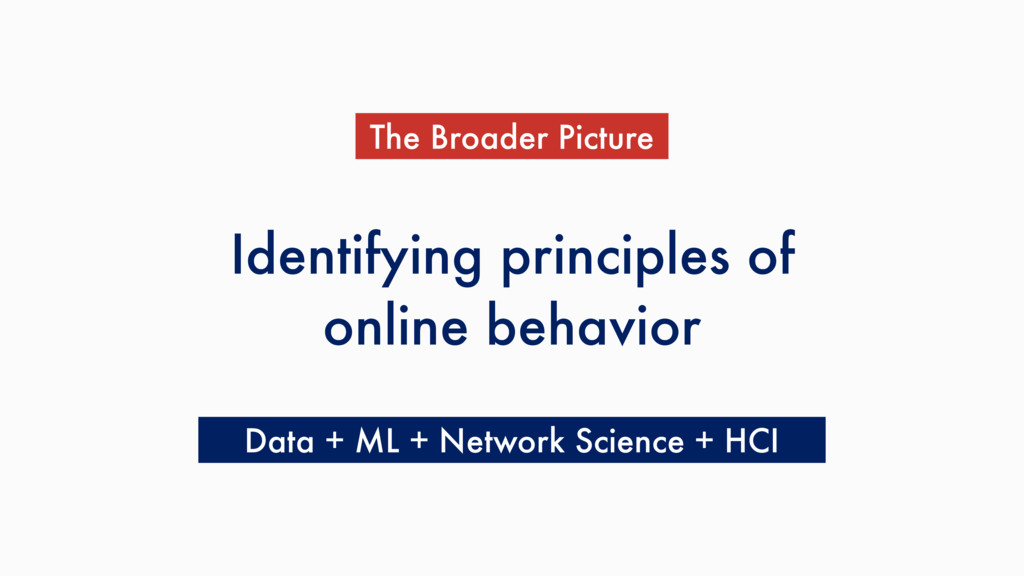
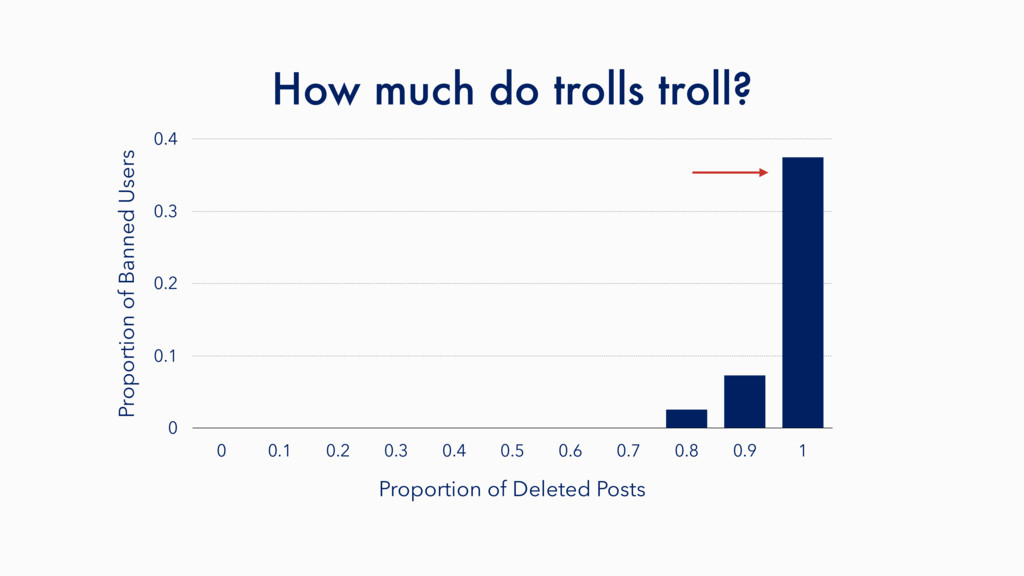
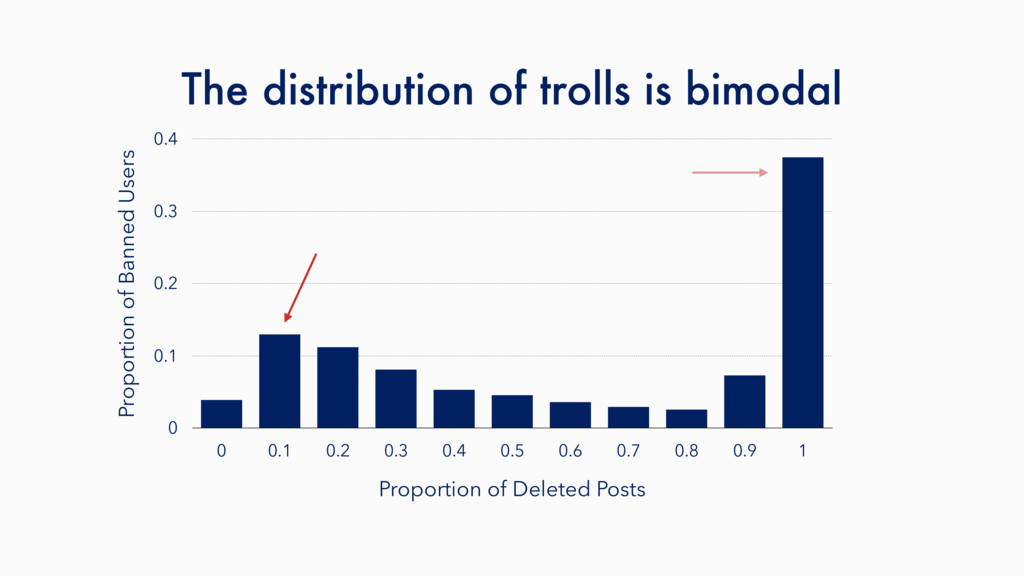
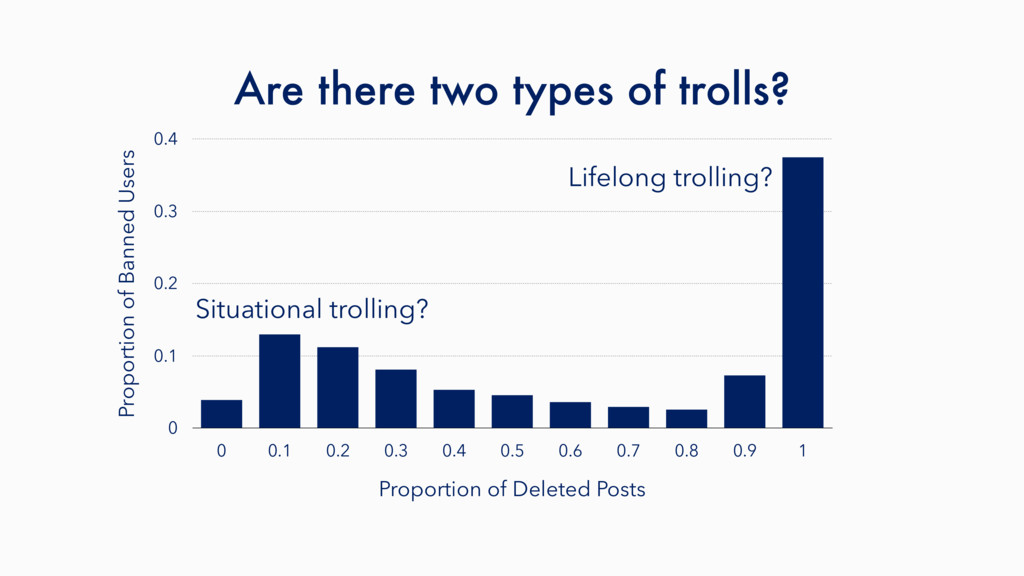
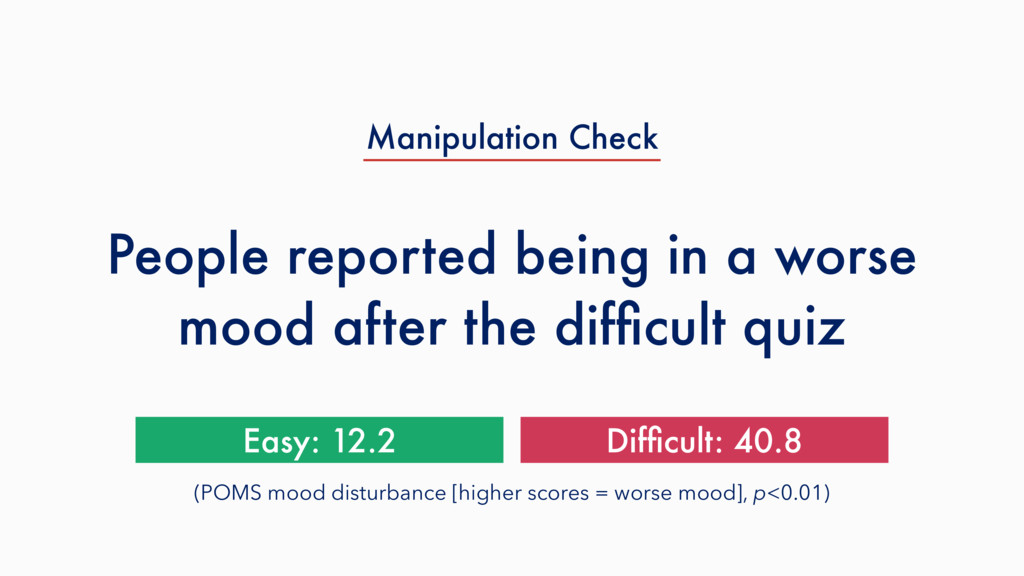
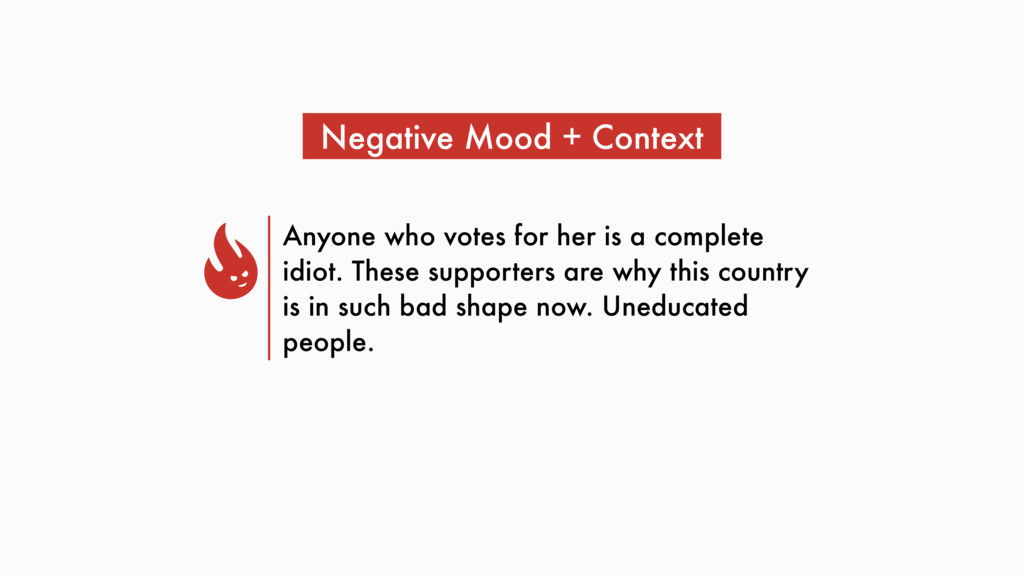
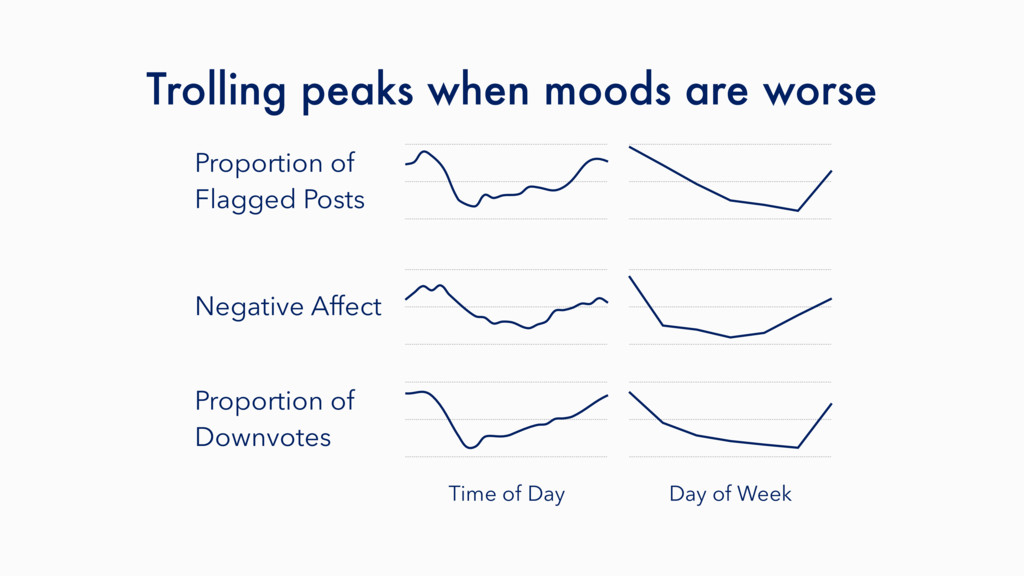
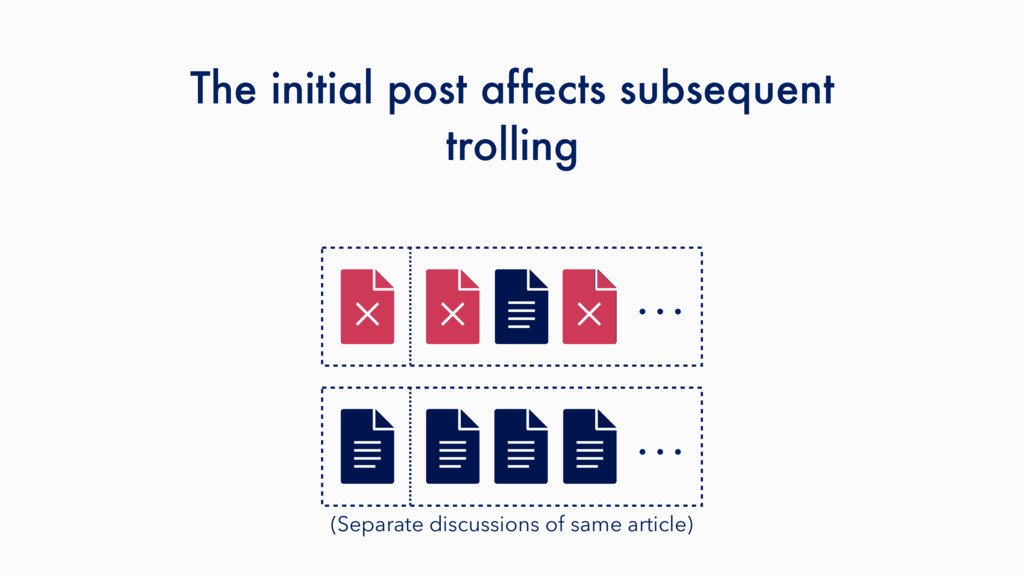
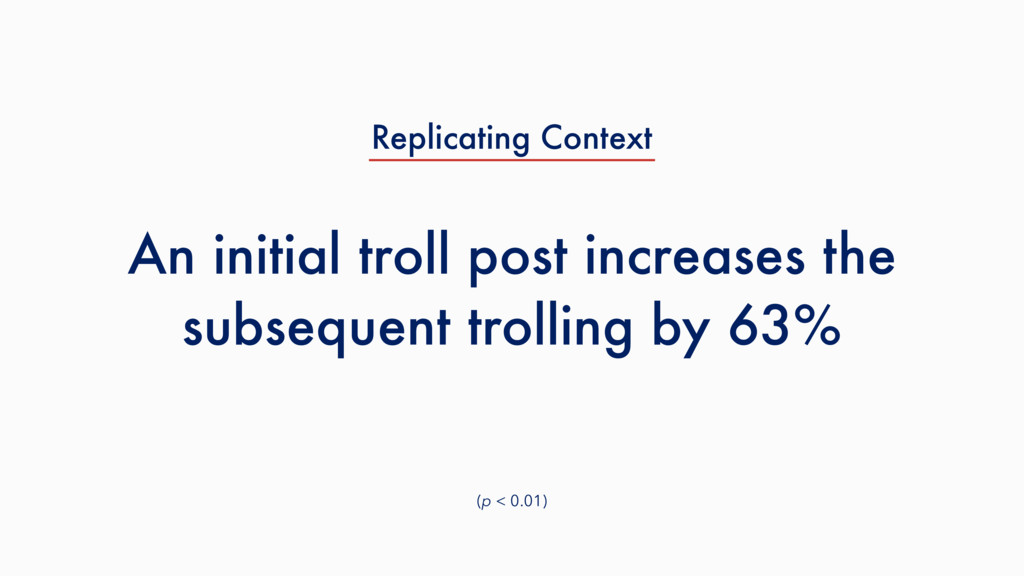
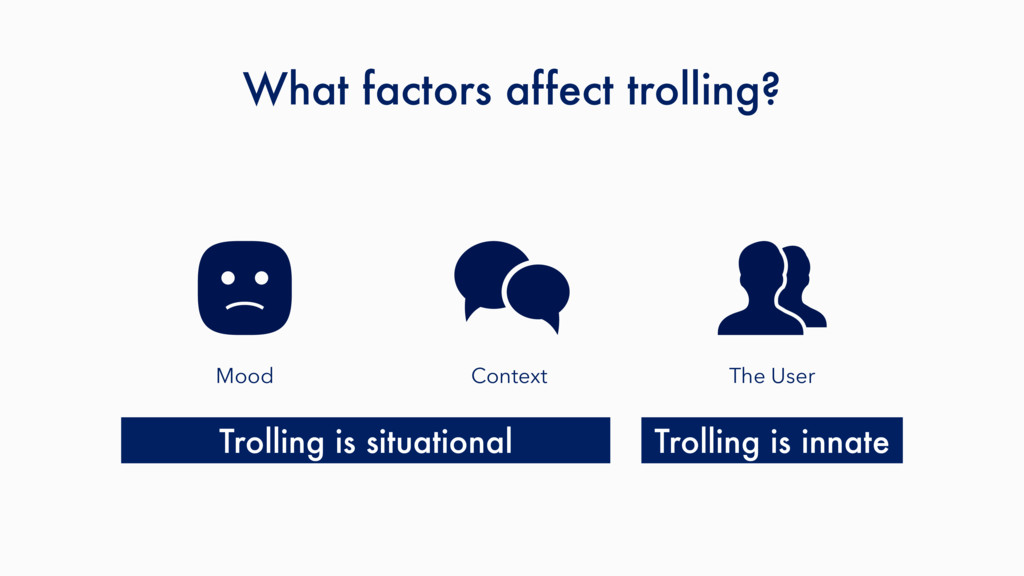
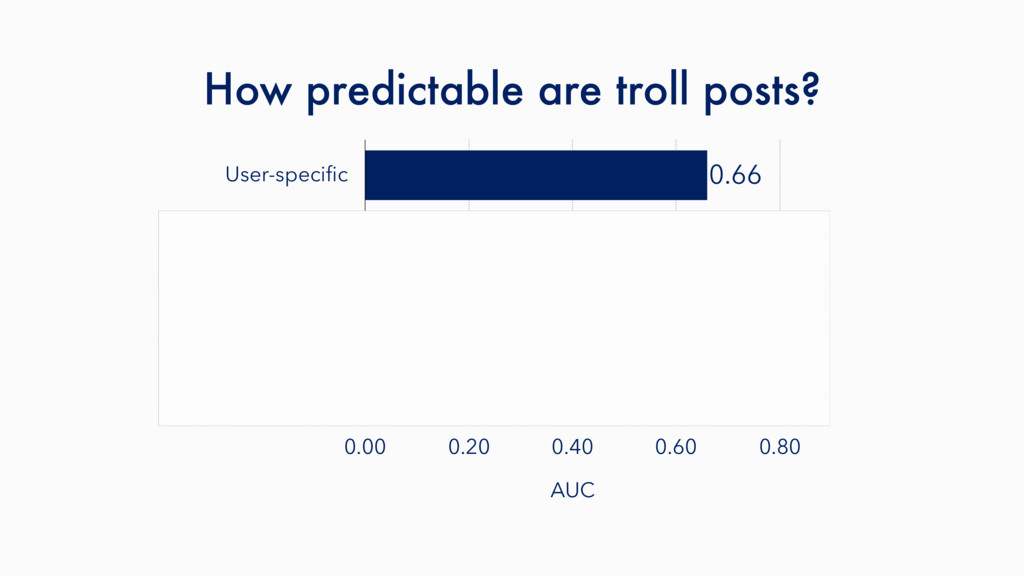
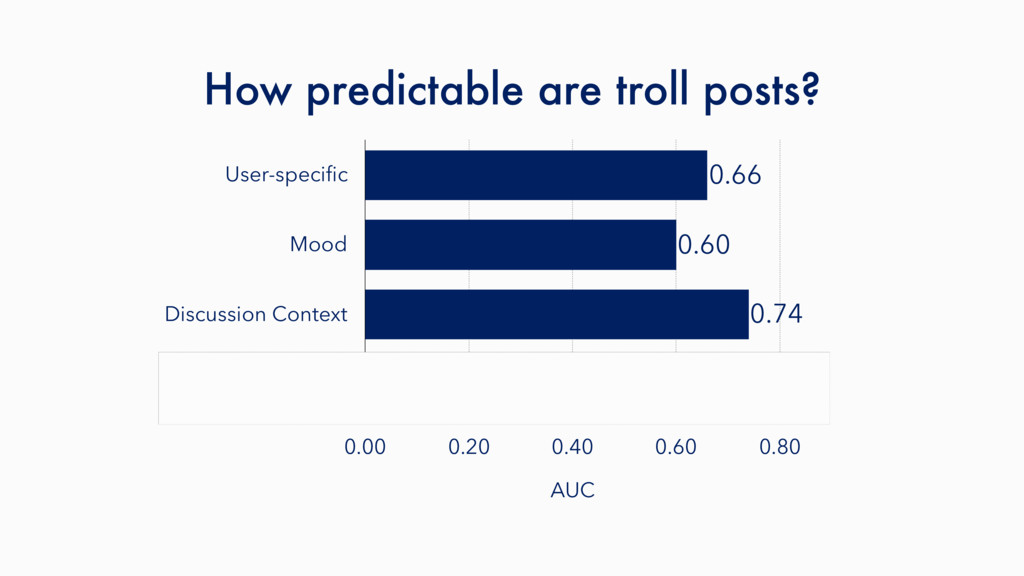
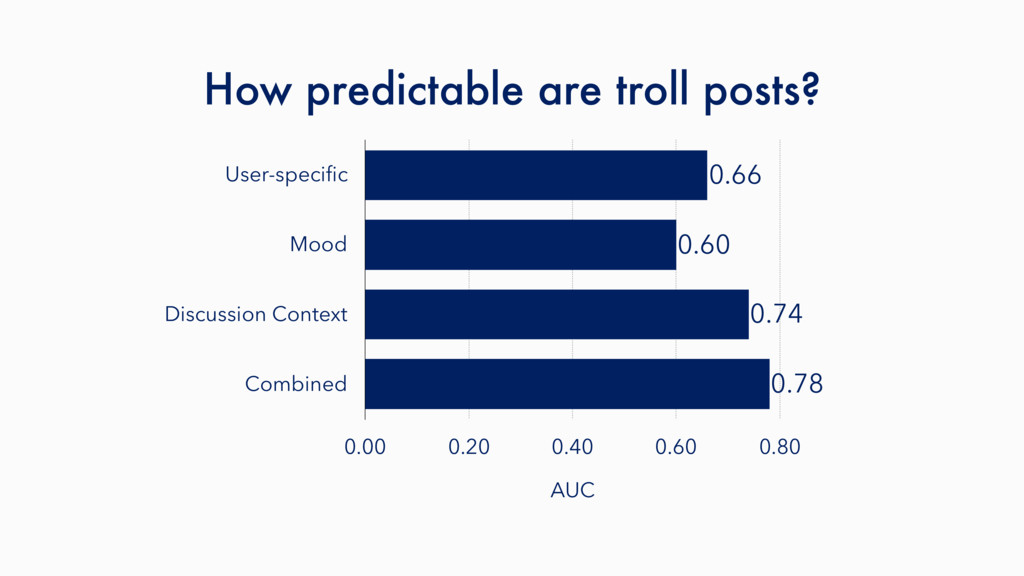
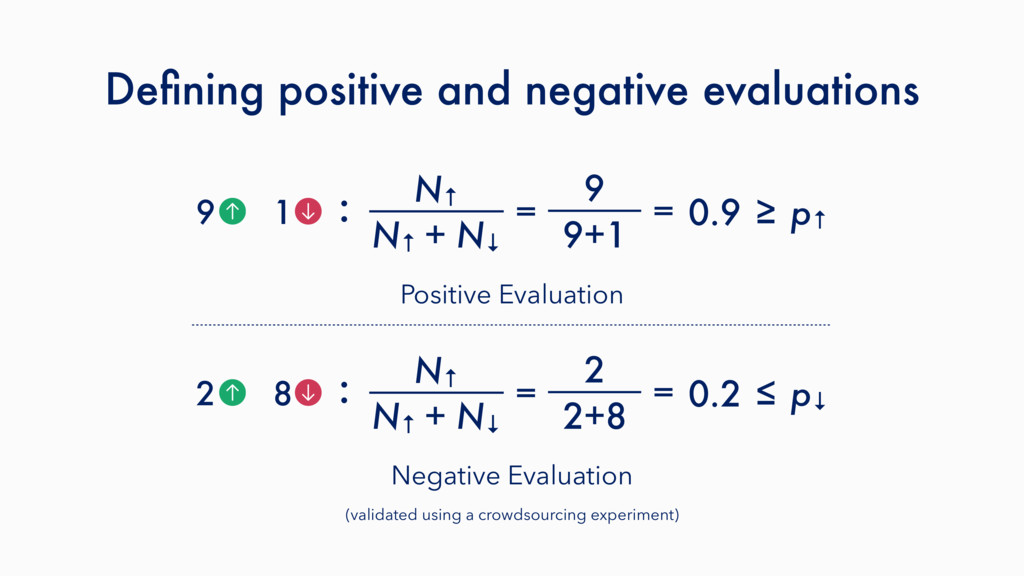
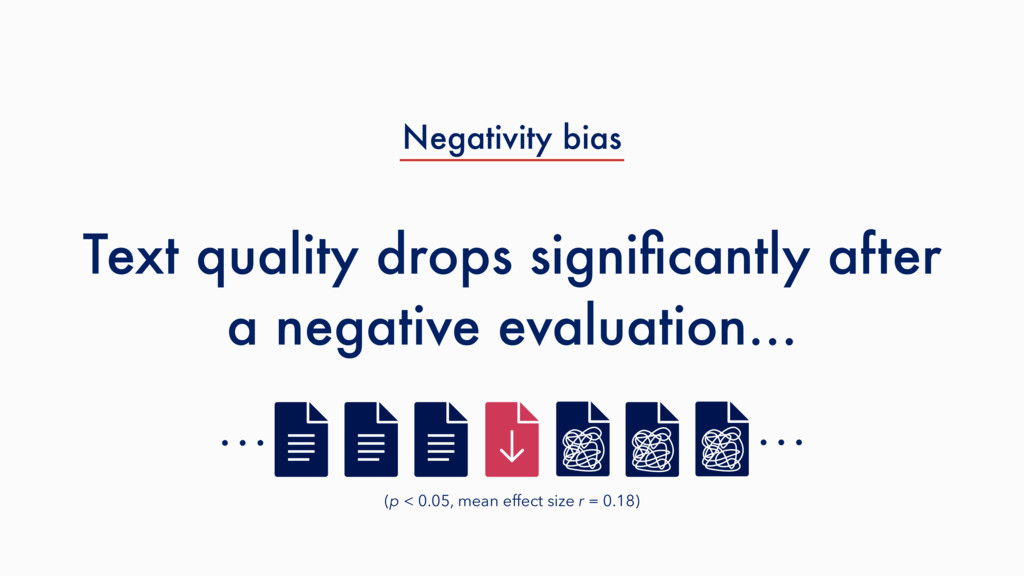
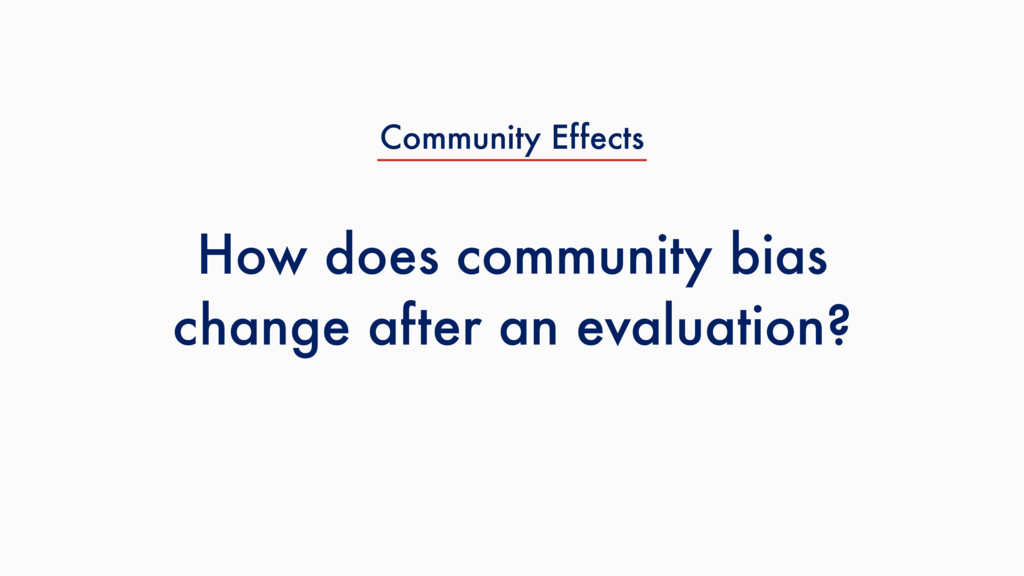
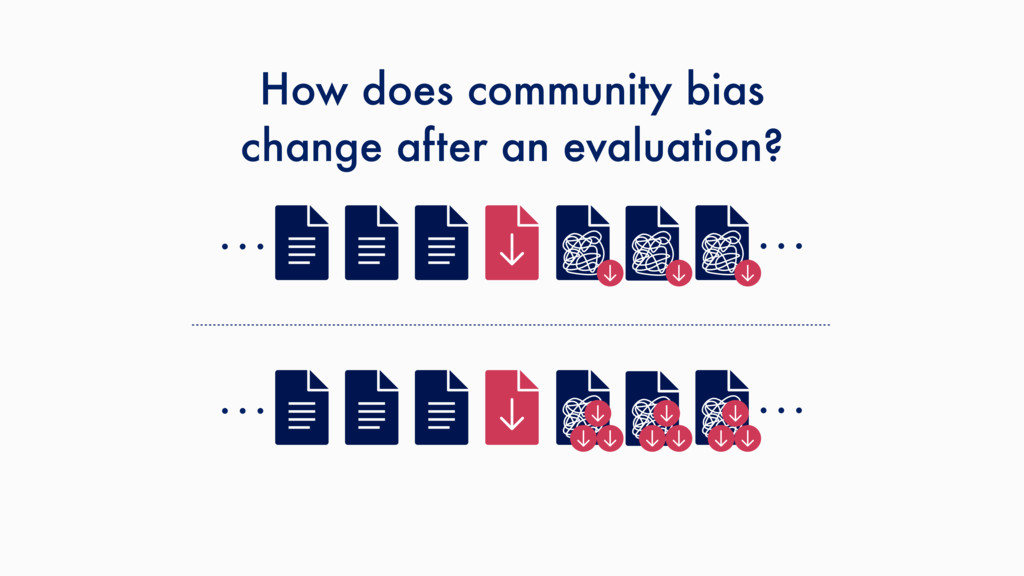
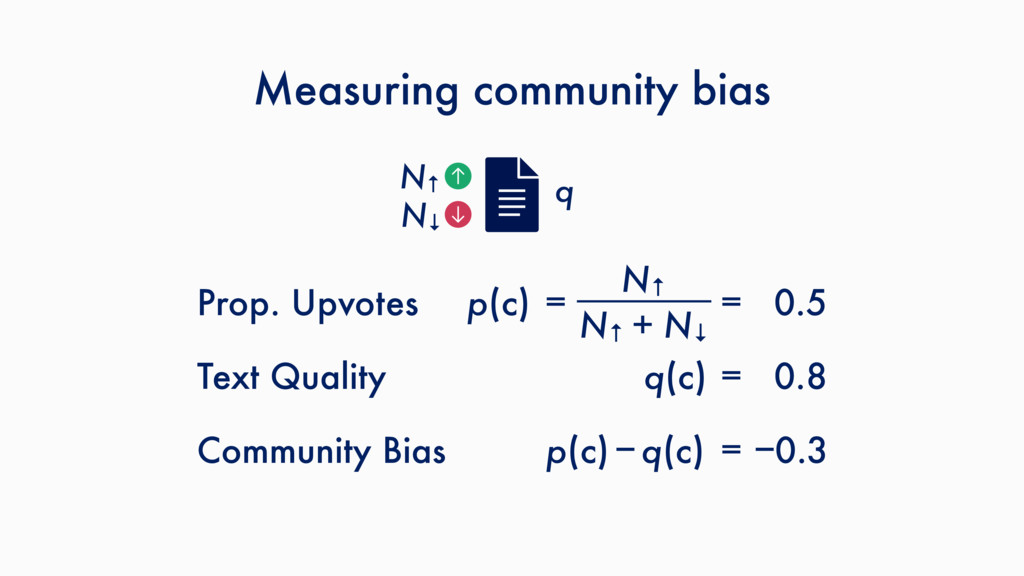
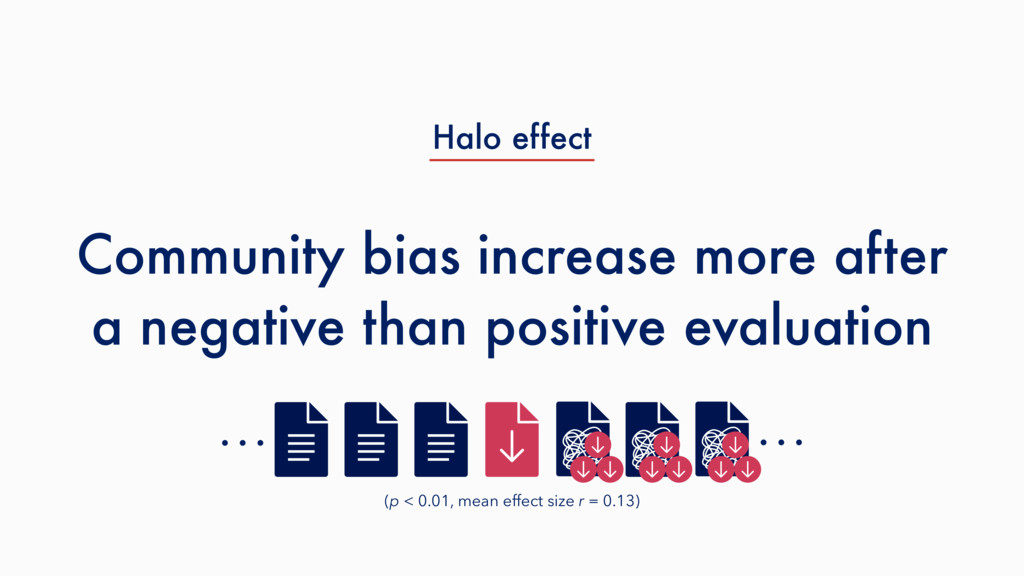
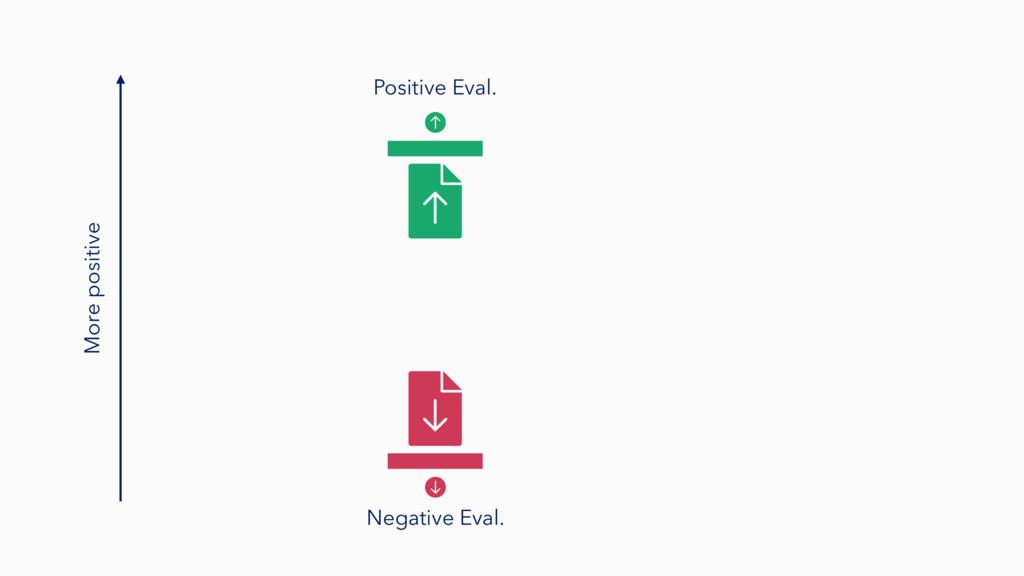
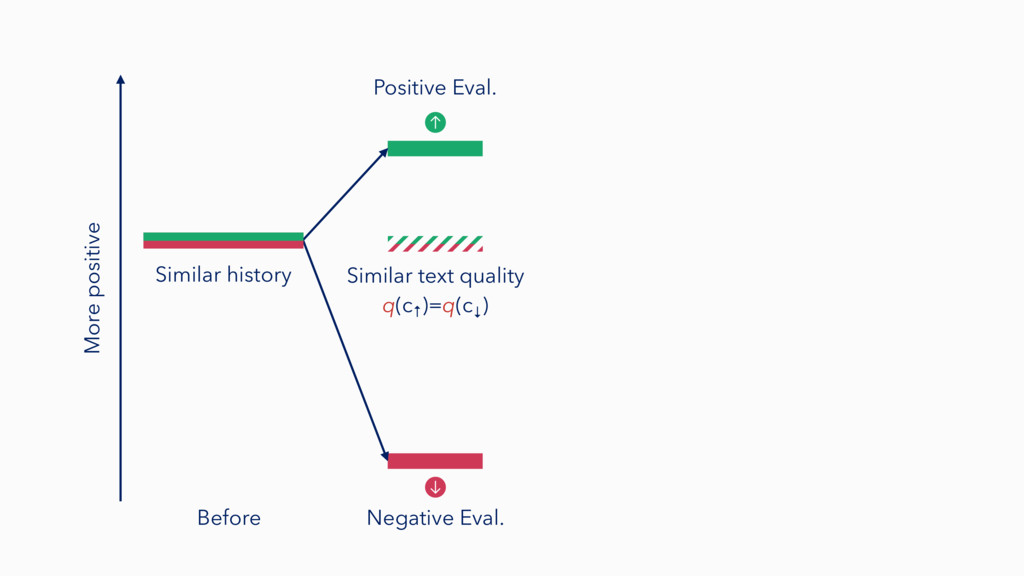
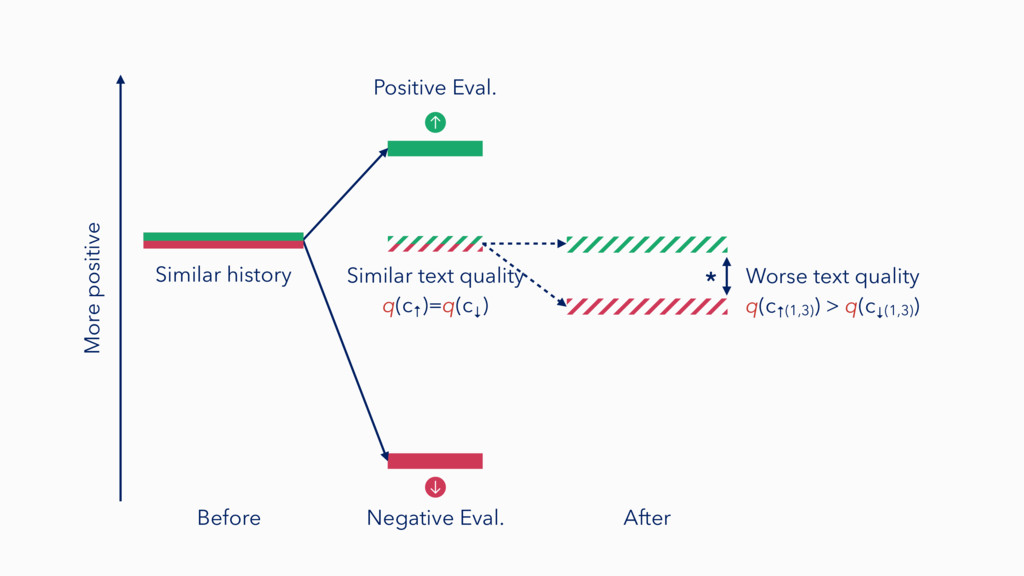
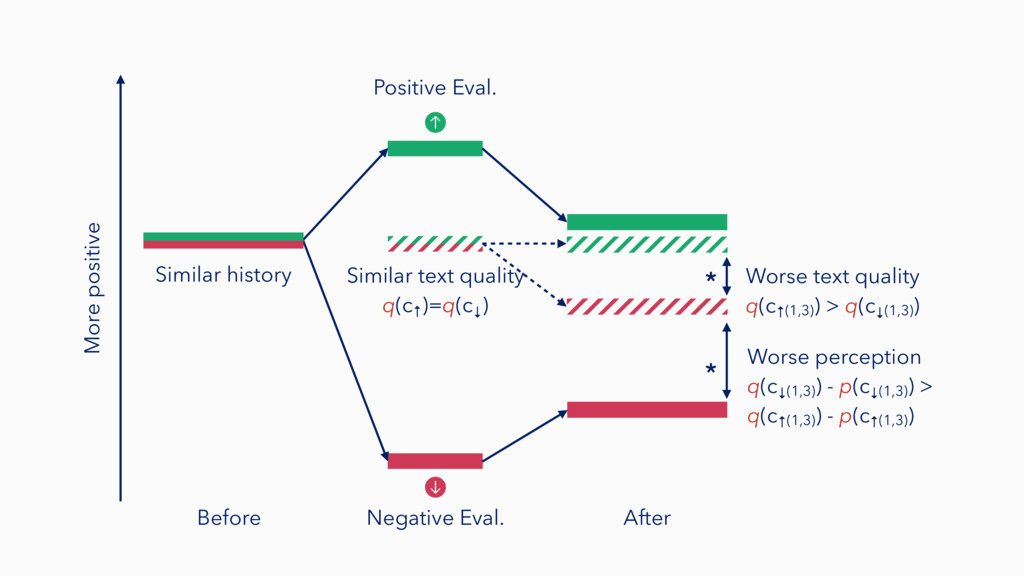
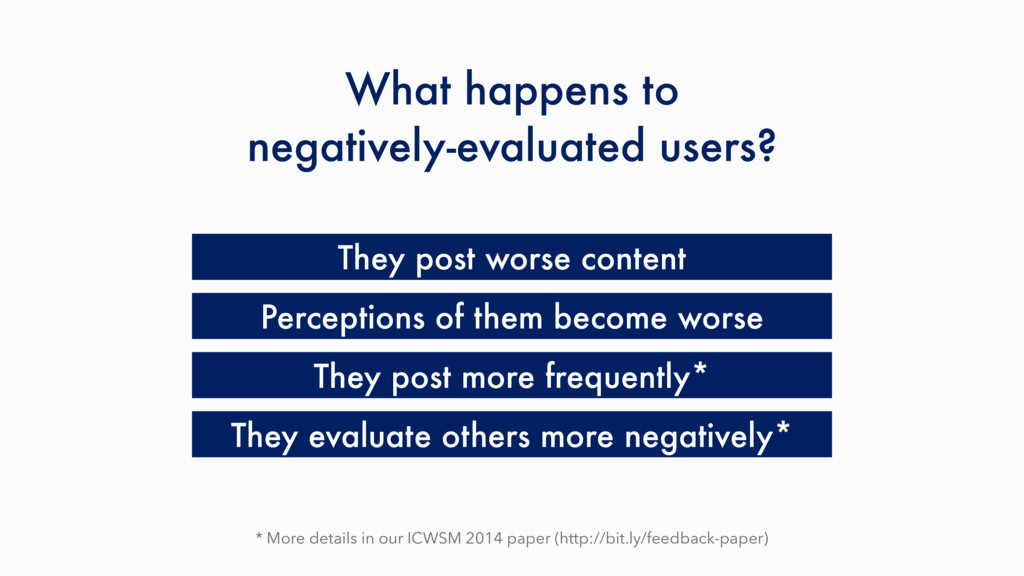
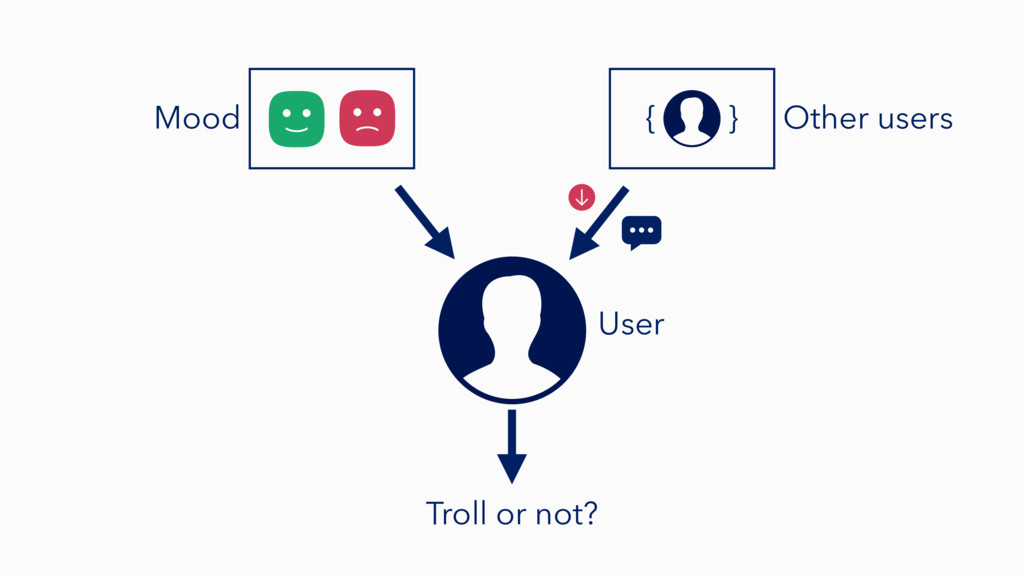
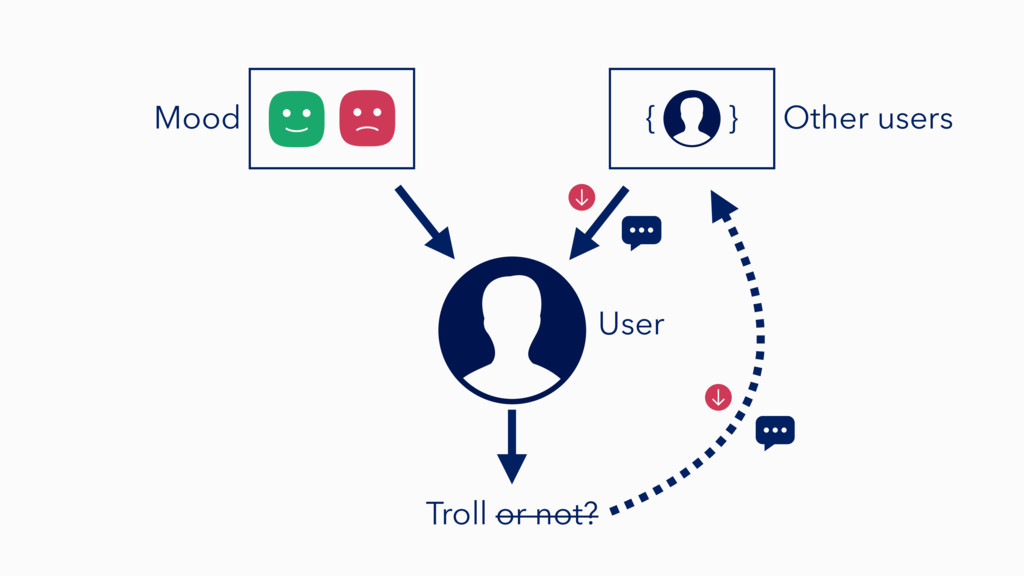
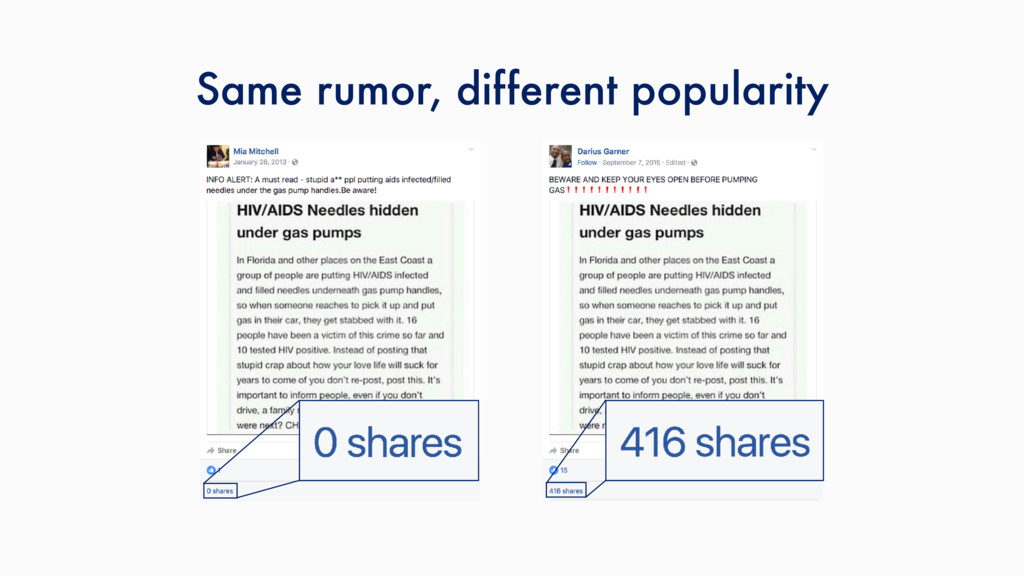
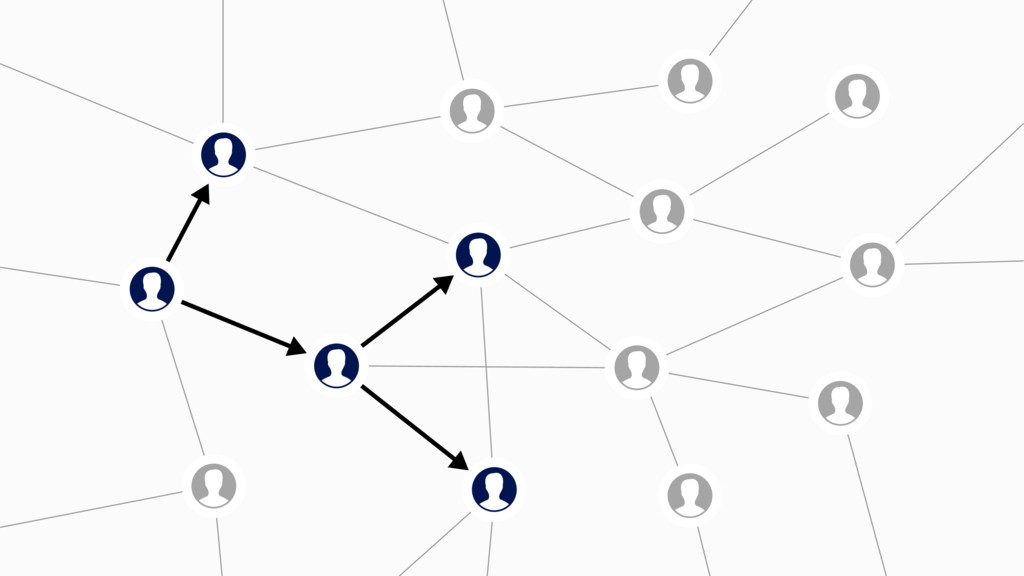
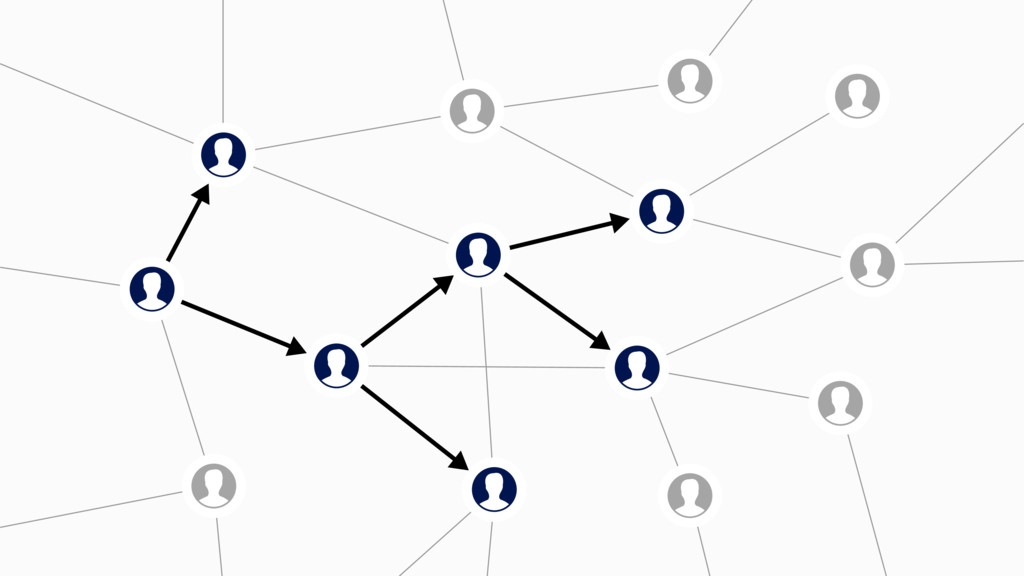
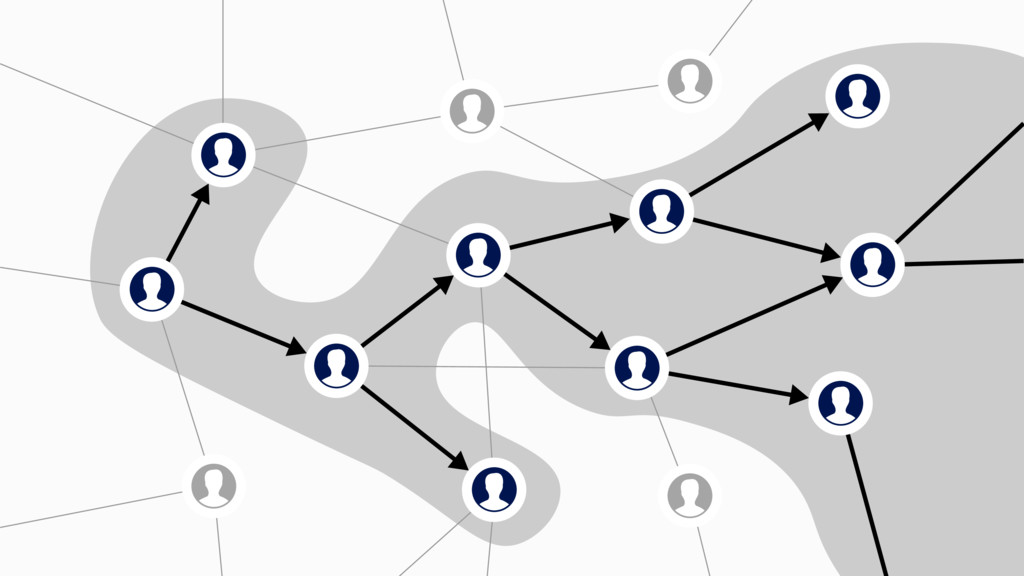
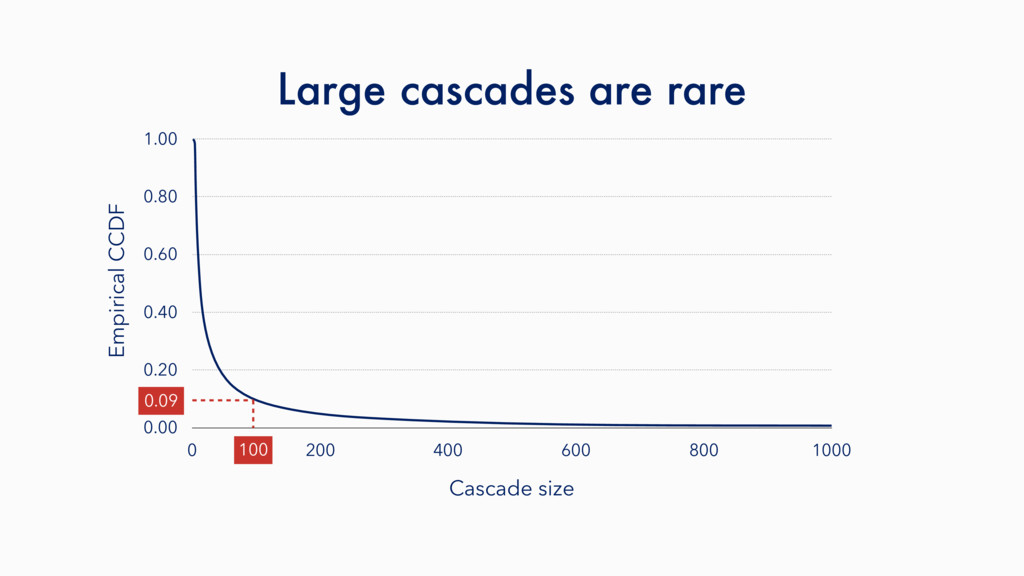
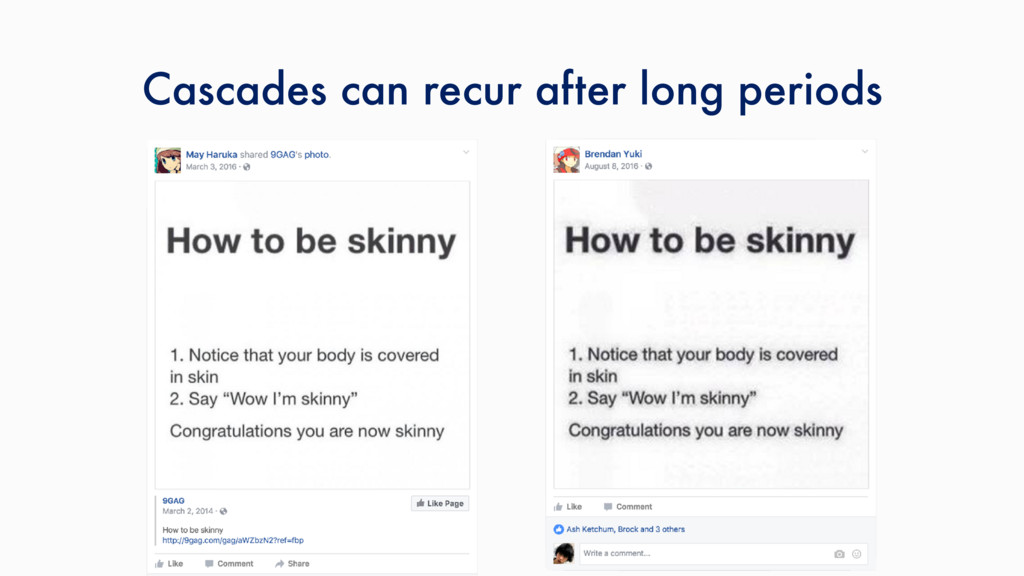
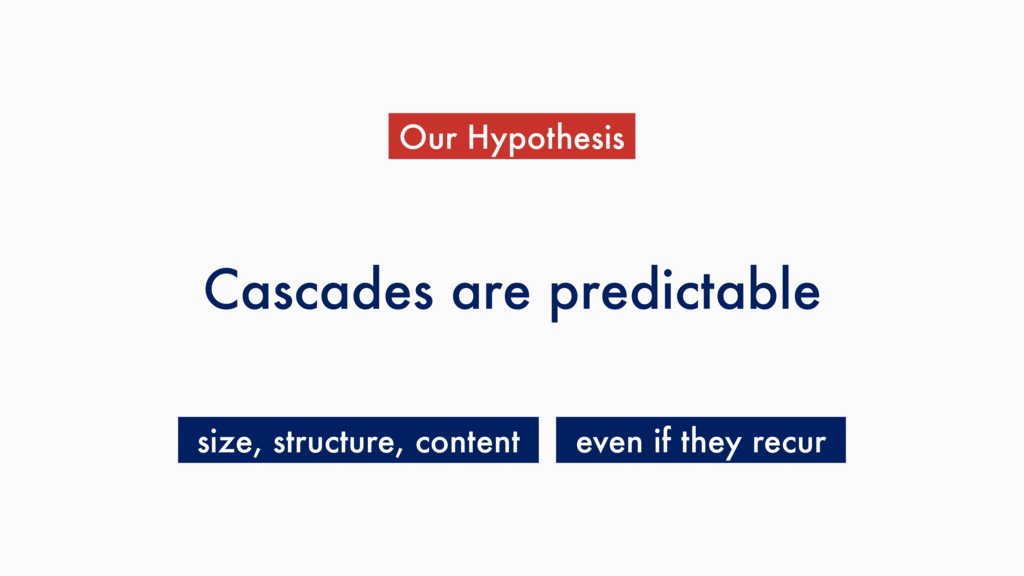
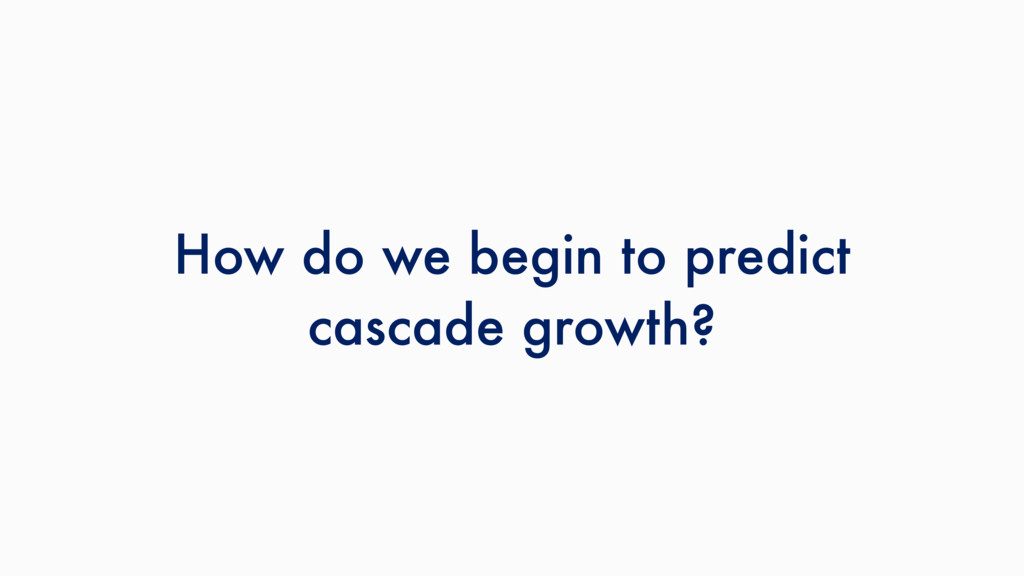
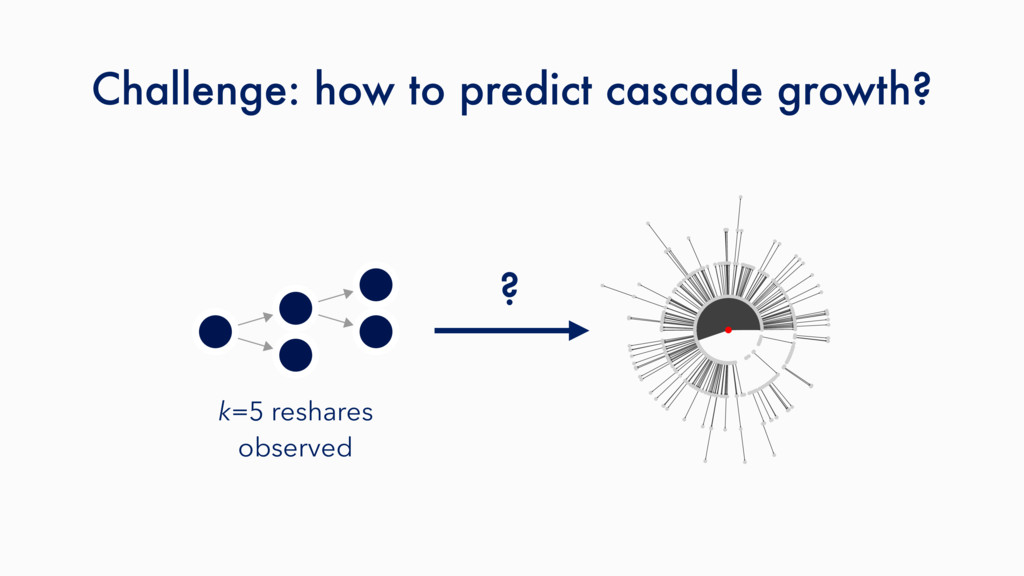
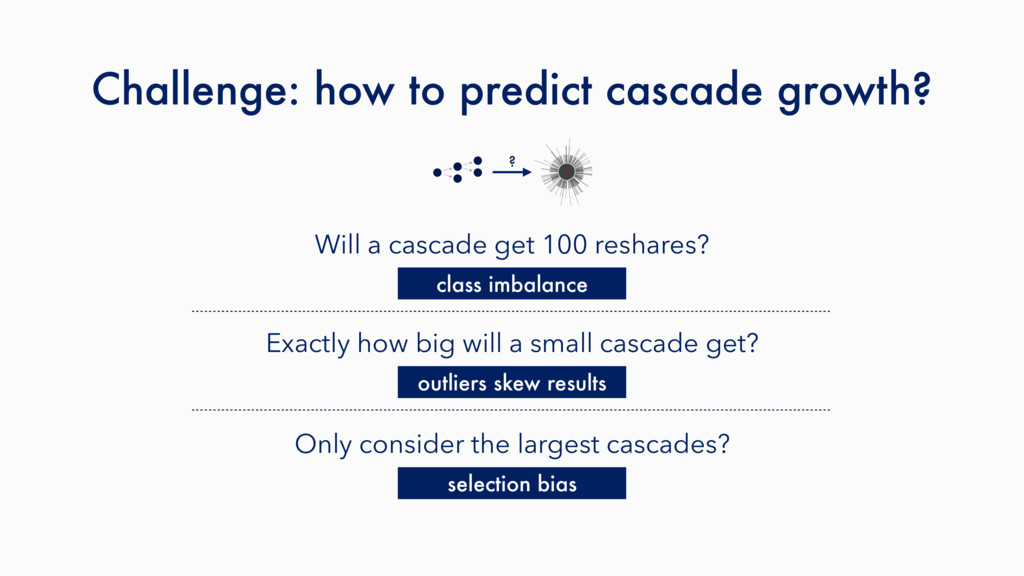
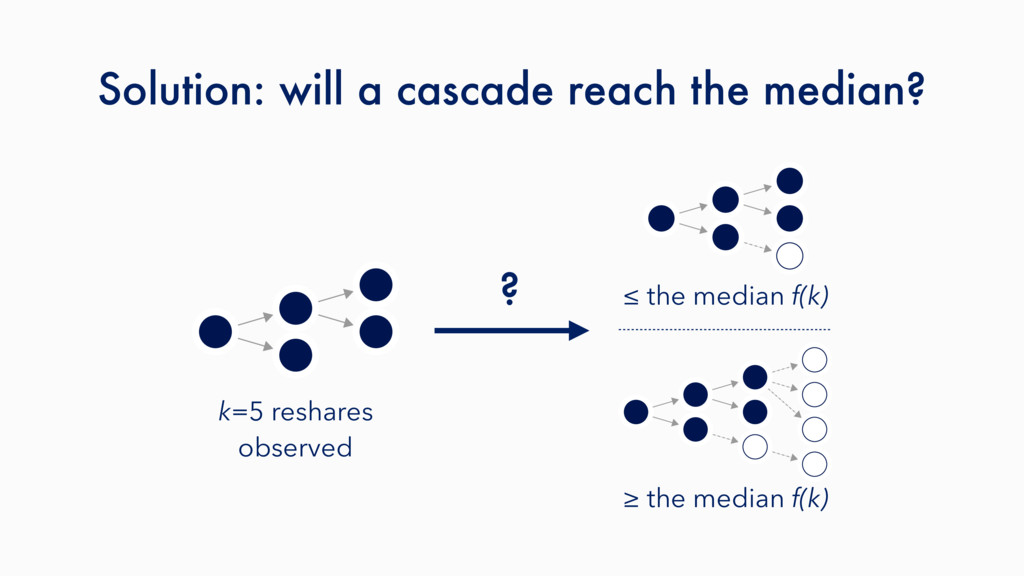
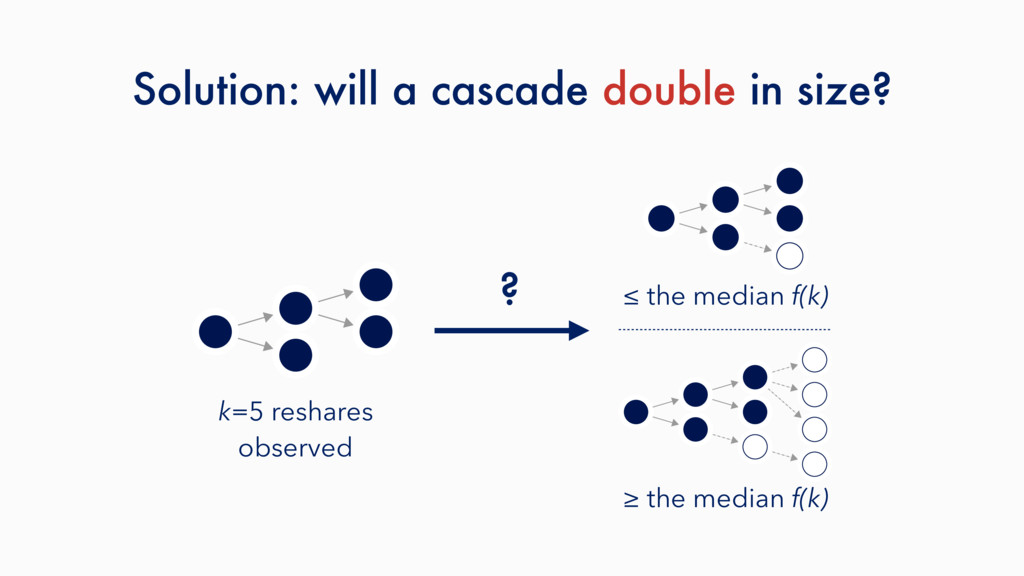
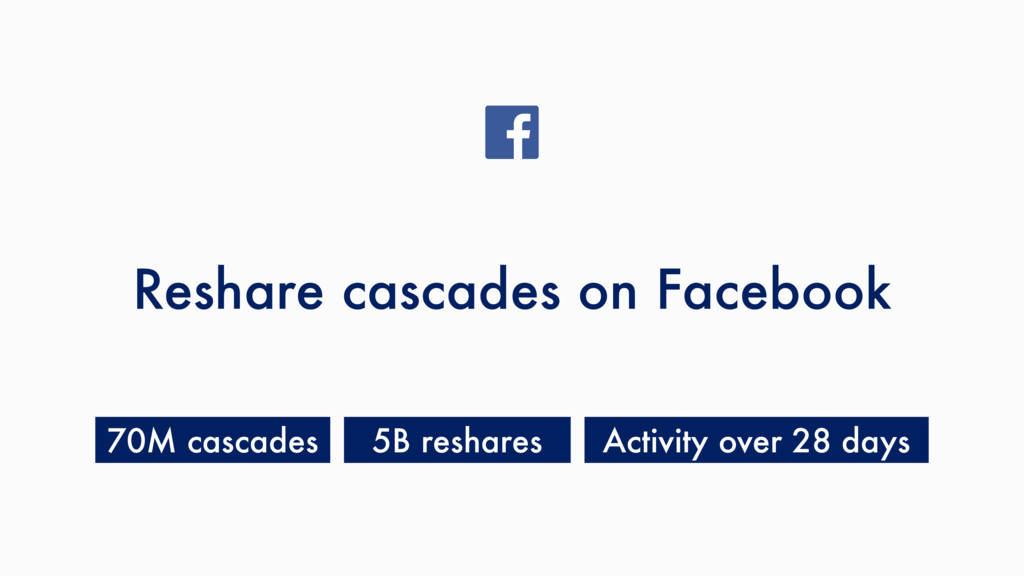
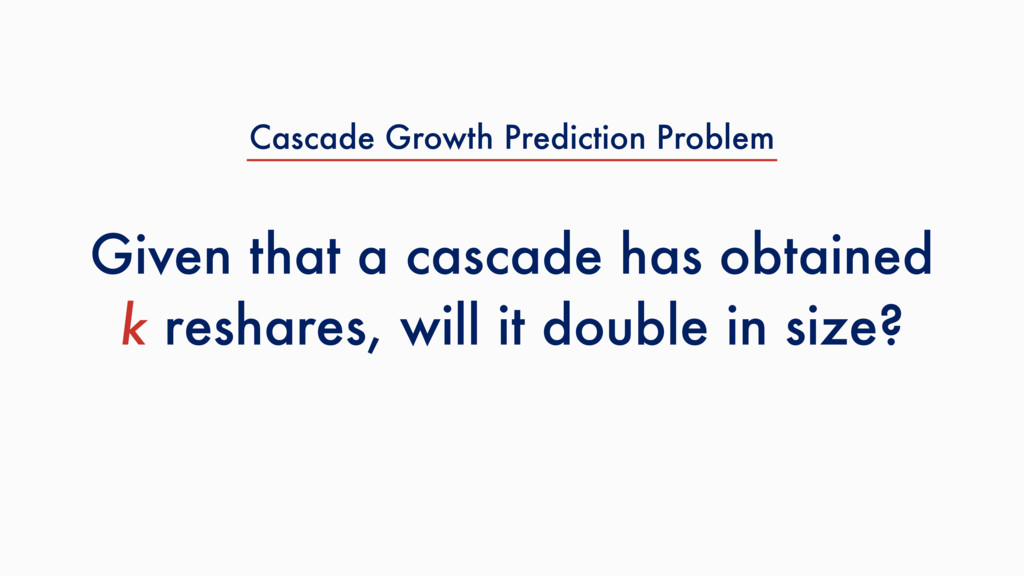
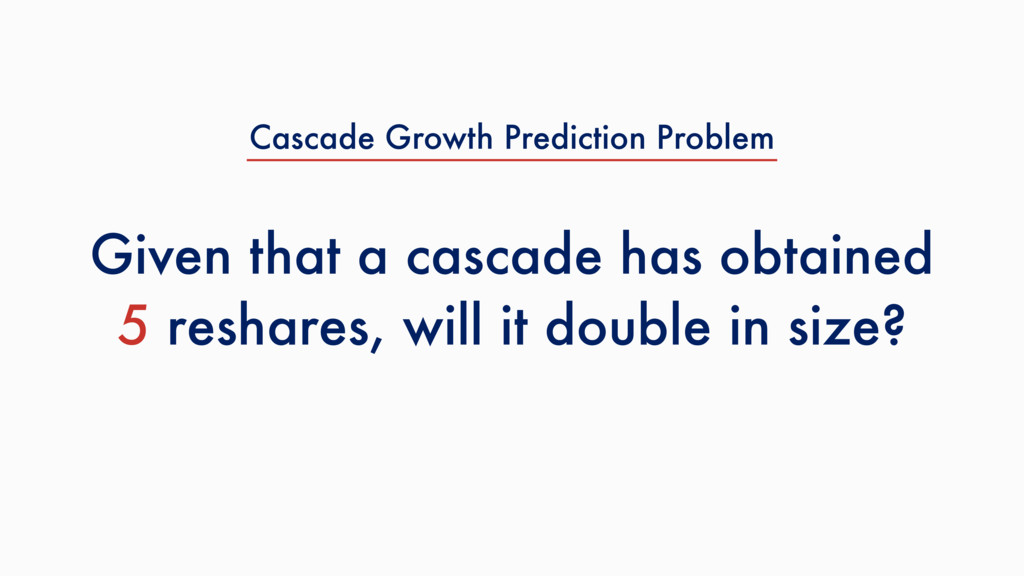
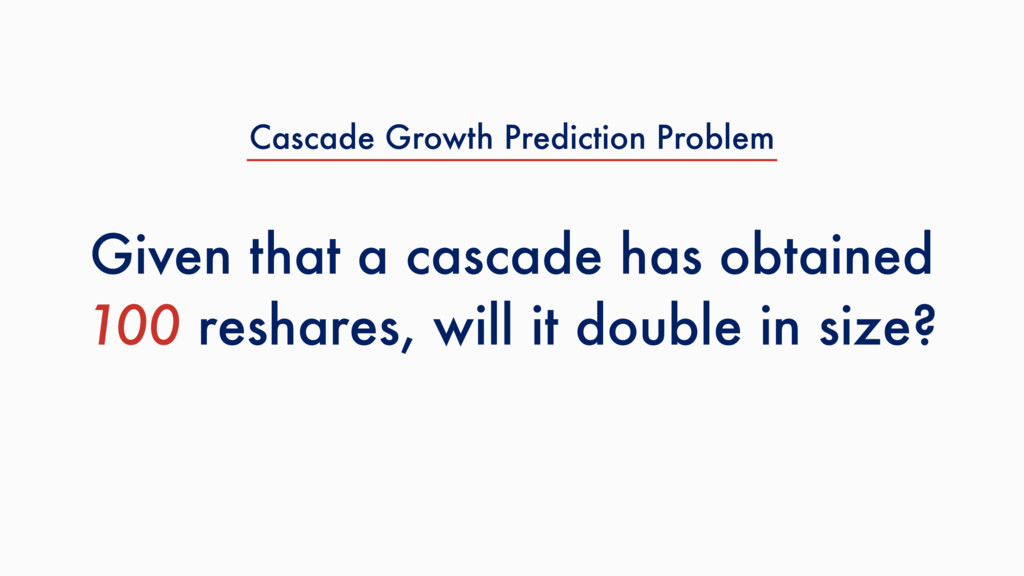
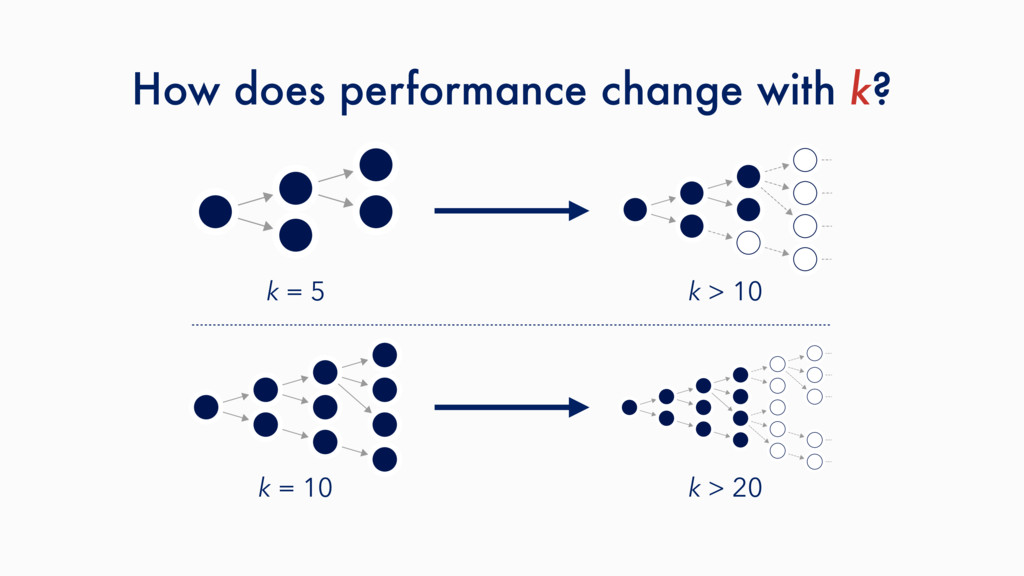
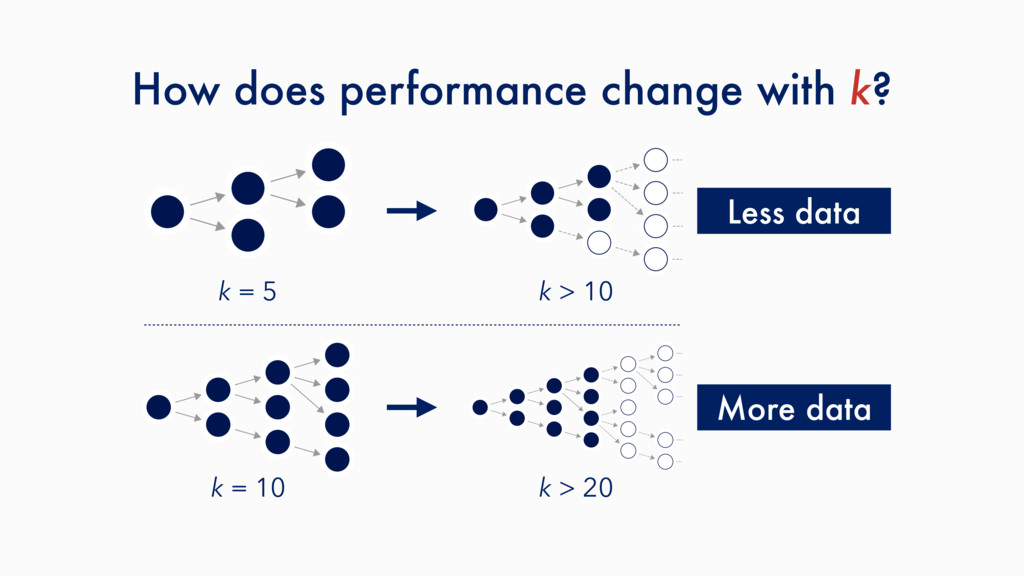
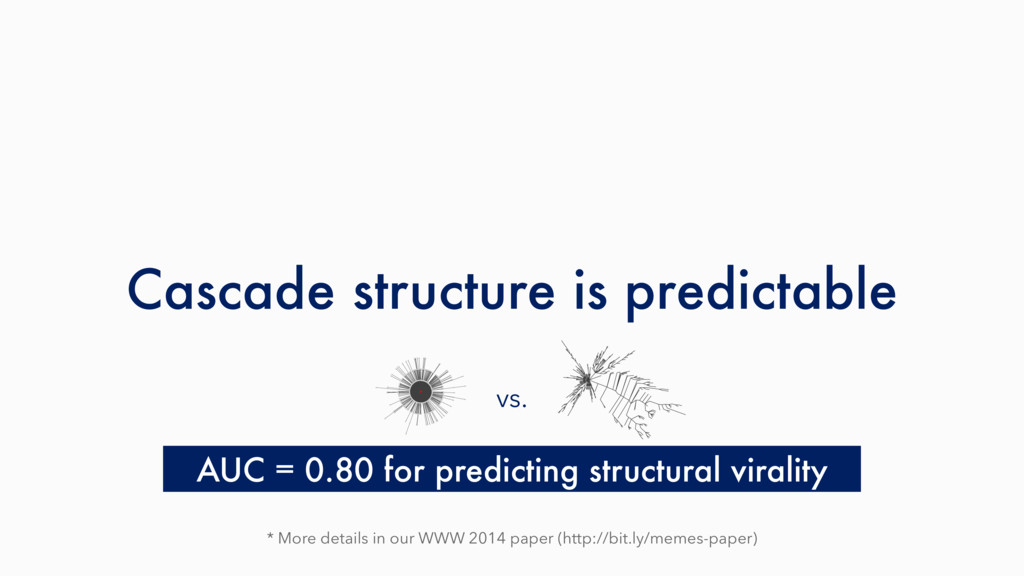
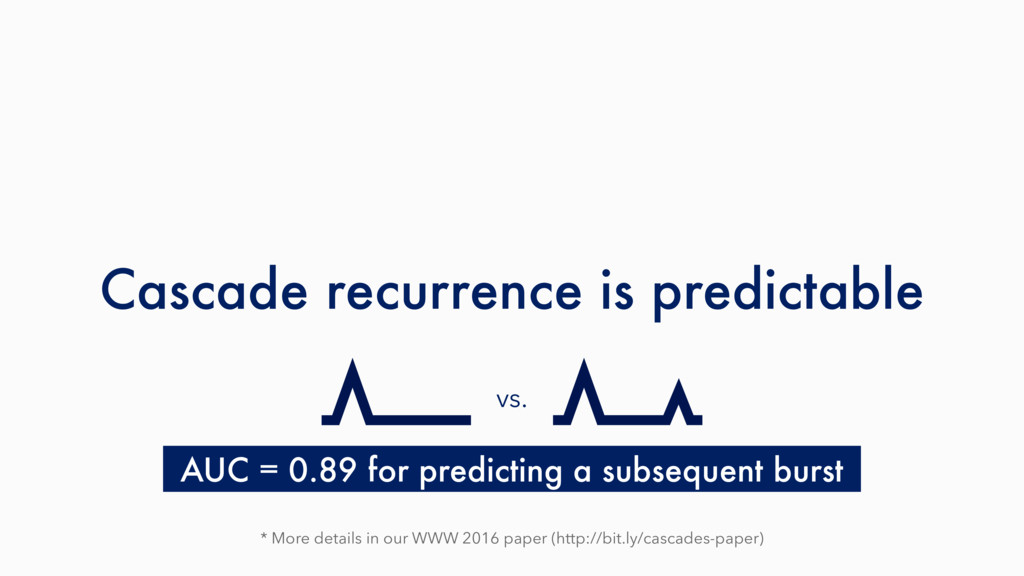
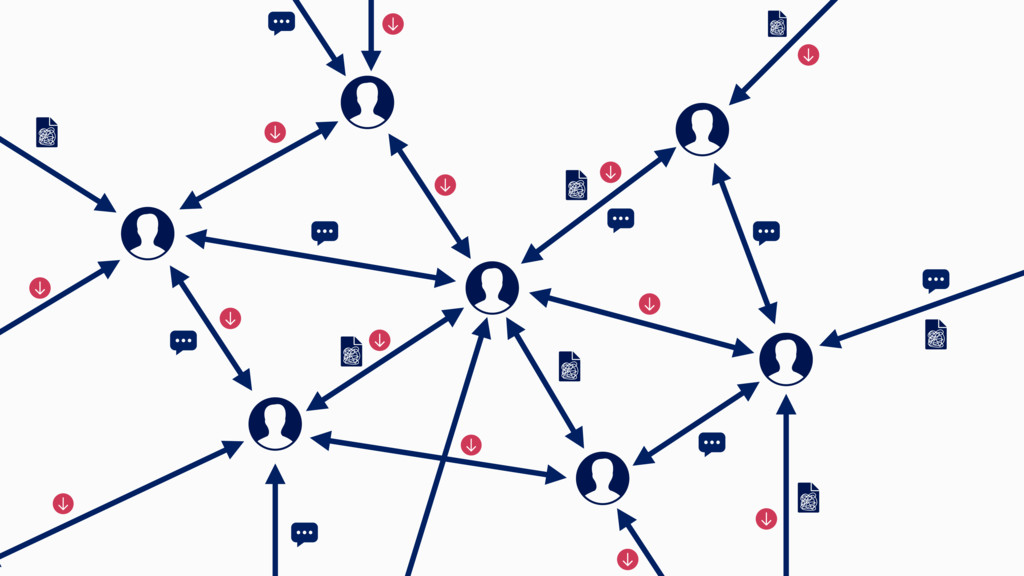
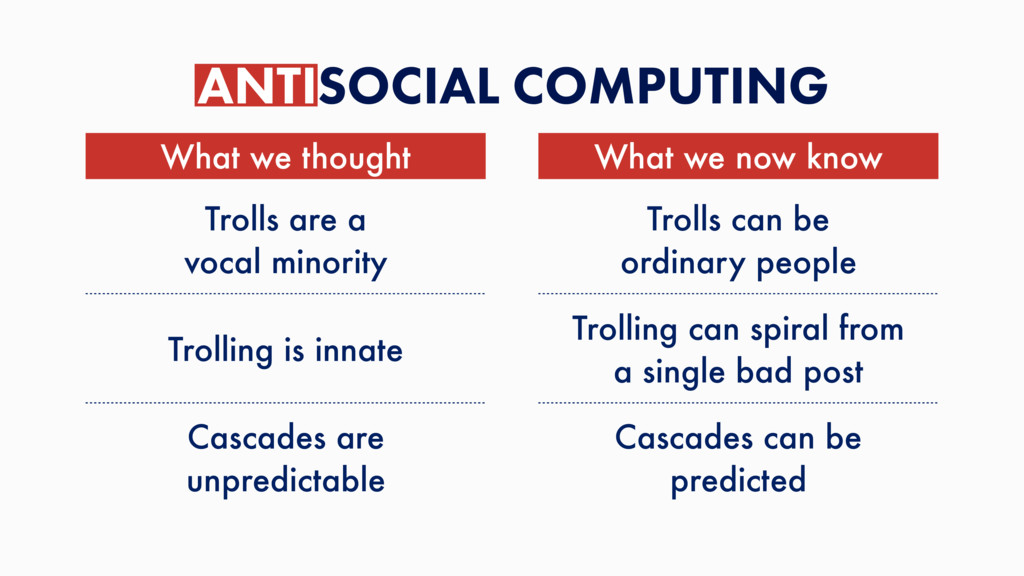
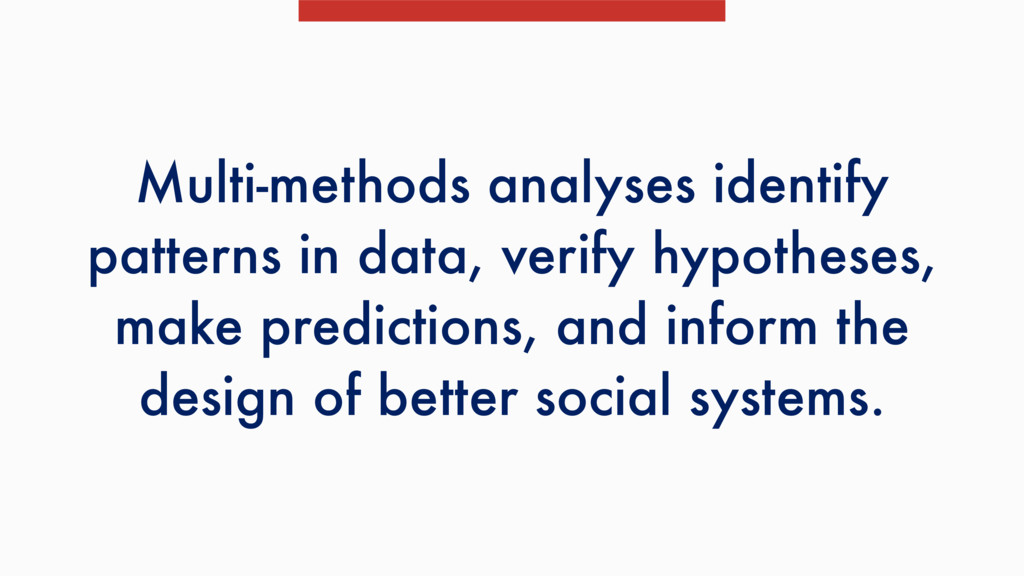
In online social networks, large information cascades can develop as people share content with one another. However, as these cascades develop through complex processes, prior work has argued that their future trajectory may be inherently unpredictable. My research introduces methods for studying the mechanisms of these cascades and predicting their spread. Analyzing billions of interactions by hundreds of millions of users on Facebook, I show how the future growth and structure of these cascades can be predicted, how cascades may resurface after lying dormant for months, and how diverse social protocols can produce large information cascades. Through revealing the mechanisms in which information diffuses in social media, this work explores a future where systems can better promote sharing behavior online.

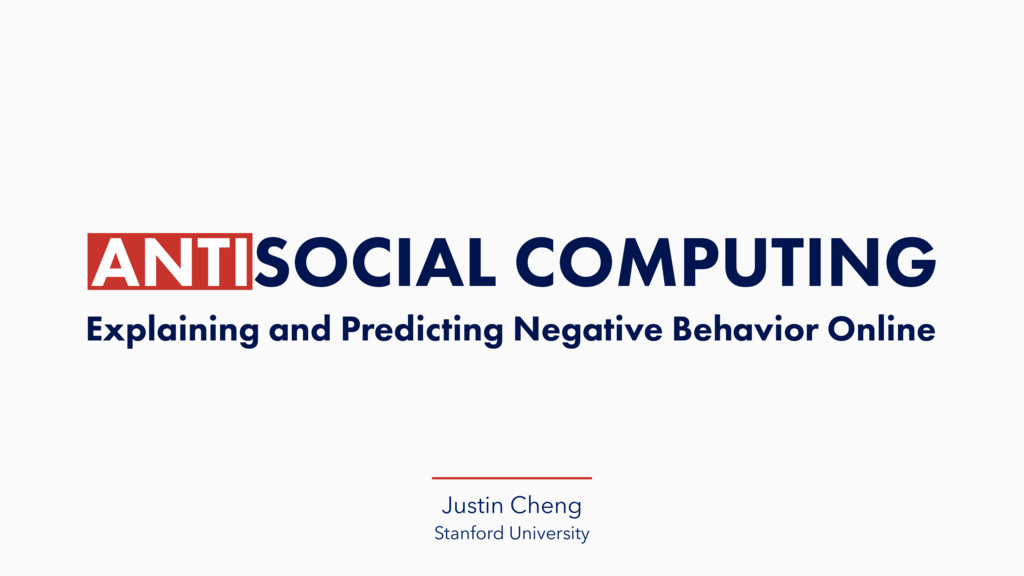
Presented at the Stanford Human-Computer Interaction Seminar.

Justin Cheng

June 02, 2017
Tweet

More Decks by Justin Cheng

Other Decks in Research

Transcript

  1. Antisocial behavior is largely due to sociopaths Prior Work Donath

    (1999); Hardaker (2010); Buckels, et al. (2014)
  2. Antisocial Behavior & Its Spread Talk Outline What causes antisocial

    behavior? Can such cascades be predicted? Does it worsen over time? 1 2 3
  3. Antisocial Behavior & Its Spread Talk Outline 1 2 3

    What causes antisocial behavior? Can such cascades be predicted? Does it worsen over time?
  4. CSCW 2017 (Best Paper); ICWSM 2015 (Honorable Mention) with M.

    Bernstein, C. Danescu-Niculescu-Mizil, J. Leskovec CAN ANYONE BECOME A TROLL? Causes of Antisocial Behavior in Online Discussions
  5. It also shows that Islam and Christianity teaching women to

    dress modest could be right afterall.
  6. It also shows that Islam and Christianity teaching women to

    dress modest could be right afterall. Clearly that is the only logical conclusion to this article. Now if you'll excuse me, I need to iron my tarp. I have work on Monday, and I want to appear 'modest'. fail at life. go bomb yourself. Religious nut alert
  7. What is trolling? Engaging in negatively marked online behavior Taking

    pleasure in upsetting others Not following the rules Disrupting a group while staying undercover Donath (1999); Hardaker (2010); Kirman (2012); Schwartz (2008)
  8. Trolling is behavior that occurs outside community norms. Defined using

    community guidelines Our Definition e.g., name-calling, personal attacks, profanity, threats, hate speech, ethnically/racially offensive material
  9. Are trolls just a vocal minority? Donath (1999); Hardaker (2010);

    Shachaf & Hara (2010); NYT (2008); Wired (2014); Vox (2014)
  10. How much do trolls troll? Proportion of Banned Users 0

    0.1 0.2 0.3 0.4 Proportion of Deleted Posts 0 0.1 0.2 0.3 0.4 0.5 0.6 0.7 0.8 0.9 1
  11. The distribution of trolls is bimodal Proportion of Banned Users

    0 0.1 0.2 0.3 0.4 Proportion of Deleted Posts 0 0.1 0.2 0.3 0.4 0.5 0.6 0.7 0.8 0.9 1
  12. Are there two types of trolls? Proportion of Banned Users

    0 0.1 0.2 0.3 0.4 Proportion of Deleted Posts 0 0.1 0.2 0.3 0.4 0.5 0.6 0.7 0.8 0.9 1 Situational trolling? Lifelong trolling?
  13. People reported being in a worse mood after the difficult

    quiz Easy: 12.2 Difficult: 40.8 (POMS mood disturbance [higher scores = worse mood], p<0.01) Manipulation Check
  14. Initial seed posts in the negative context condition perceived worse

    Positive: 90% upvoted Negative: 36% upvoted (p < 0.01) Manipulation Check
  15. How did trolling differ across conditions? Positive Mood Negative Mood

    Positive Context Negative Context % Troll Posts
  16. Trolling is lowest with positive conditions… Positive Mood Negative Mood

    Positive Context 35% Negative Context % Troll Posts
  17. …and almost doubles in the worst case Positive Mood Negative

    Mood Positive Context 35% 49% Negative Context 47% 68% % Troll Posts (p < 0.05 using a mixed effects logistic regression model)
  18. Negative affect almost triples Positive Mood Negative Mood Positive Context

    1.1% 1.4% Negative Context 2.3% 2.9% % Negative Affect Words (LIWC) (p < 0.05)
  19. Hilary is a solid candidate. As a woman, I appreciate

    that she's a woman, but it's not the only reason I think she would do well in office. Positive Mood + Context
  20. Anyone who votes for her is a complete idiot. These

    supporters are why this country is in such bad shape now. Uneducated people. Negative Mood + Context
  21. Can trolling, like mood, vary with the time of day

    and day of week? Replicating Mood Golder & Macy (2011) Neg. Affect Time of Day ?
  22. How does trolling vary with time of day? Proportion of

    Flagged Posts 0.03 0.033 0.036 0.039 0.042 Time of Day 0 6 12 18 24
  23. Trolling peaks in the evening… Proportion of Flagged Posts 0.03

    0.033 0.036 0.039 0.042 Time of Day 0 6 12 18 24 Negative Affect (Golder & Macy)
  24. …and early in the work week. Proportion of Flagged Posts

    0.03 0.032 0.034 0.036 0.038 0.04 Day of Week Mon Tue Wed Thu Fri Sat Sun
  25. Trolling peaks when moods are worse Time of Day Proportion

    of Flagged Posts Negative Affect Proportion of Downvotes Day of Week
  26. … … … ? … (Discussion) (Unrelated Discussions) … ?

    … Mood spills over from prior discussions
  27. A user who trolled in a previous discussion is twice

    as likely to troll in a later, unrelated discussion (p < 0.01) Replicating Mood
  28. (Separate discussions of same article) … ? ? ? …

    ? ? ? The initial post affects subsequent trolling
  29. Antisocial Behavior & Its Spread Talk Outline 1 2 3

    What causes antisocial behavior? Can such cascades be predicted? Does it worsen over time?
  30. Defining positive and negative evaluations : 9 1 2 8

    N↑
 N↑ + N↓ 2
 2+8 = = 0.2 p↓ ≤ : N↑
 N↑ + N↓ 9
 9+1 = = 0.9 p↑ ≥ Positive Evaluation Negative Evaluation (validated using a crowdsourcing experiment)
  31. Solution: propensity score matching PSM: Rosenbaum (1983); CEM: Iacus, et

    al. (2012) Positively evaluated Negatively evaluated
  32. Computing text quality Learn p with bigrams
 (binomial regression) 1

    3 lorem ipsum… q = ? Lorem… ? ? 9 2 lorem ipsum… … Text quality q is predicted p
  33. Validating text quality Manually label subset (n=171) using crowdsourcing lorem

    ipsum… Good Bad Good Good # Good
 # Total q’=
  34. Validating text quality Manually label subset (n=171) using crowdsourcing lorem

    ipsum… Good Bad Good Good # Good
 # Total q’= ? ? corr(q’, p) = corr(q’, q) =
  35. Validating text quality (n.s.) (p < 0.01) p: actual proportion

    of upvotes q: text quality (predicted proportion) q’: crowd guess corr(q’, q) = corr(q’, p) = 0.11 0.25
  36. Validating text quality |Residuals| 0 0.2 0.4 0.6 0.8 1

    0.6 0.7 0.8 0.9 1 |q − q’| (n.s. using a Breusch-Pagan test) Text Quality q
  37. …as well as other covariates Similar history (# posts, overall

    proportion of upvotes, etc.) { ≈ … … ≈
  38. How much are evaluations due to textual effects (i.e., people

    writing worse)? f***ing a****** i.e., downvoting because of post content
  39. How much are evaluations due to community effects (i.e., inherent

    bias)? We dislike you. i.e., downvoting because of community dislikes author We dislike you.
  40. ≈ … … … … Better/Worse? Do people write better/worse

    after a positive/negative evaluation? ≈
  41. Text quality drops significantly after a negative evaluation… (p <

    0.05, mean effect size r = 0.18) … … Negativity bias
  42. Measuring community bias N↑ q N↓ N↑
 N↑ + N↓

    = 0.5 p(c) = = 0.8 q(c) p(c) q(c) = 0.3 Prop. Upvotes Text Quality Community Bias − −
  43. Community bias increase more after a negative than positive evaluation

    (p < 0.01, mean effect size r = 0.13) … … Halo effect
  44. More positive Before After Negative Eval. Positive Eval. Similar history

    Similar text quality
 q(c↑ )=q(c↓ ) Worse text quality
 q(c↑(1,3) ) > q(c↓(1,3) ) *
  45. More positive Before After Negative Eval. Positive Eval. Similar history

    Similar text quality
 q(c↑ )=q(c↓ ) Worse text quality
 q(c↑(1,3) ) > q(c↓(1,3) ) Worse perception
 q(c↓(1,3) ) - p(c↓(1,3) ) > q(c↑(1,3) ) - p(c↑(1,3) ) * *
  46. They post worse content Perceptions of them become worse They

    post more frequently* They evaluate others more negatively* * More details in our ICWSM 2014 paper (http://bit.ly/feedback-paper) What happens to negatively-evaluated users?
  47. Communities may worsen over time (?) Proportion of Upvotes 0.6

    0.65 0.7 0.75 0.8 Time December 2012 February 2013 April 2013 June 2013 August 2013
  48. Antisocial Behavior & Its Spread Talk Outline 1 2 3

    What causes antisocial behavior? Can such cascades be predicted? Does it worsen over time?
  49. The Predictability of Information Cascades in Social Networks CAN C

    S BE PREDICTED? AS A C DE WWW 2014; WWW 2016 with L. Adamic, P. A. Dow, J. Kleinberg, J. Leskovec
  50. Large cascades are rare Empirical CCDF 0.00 0.20 0.40 0.60

    0.80 1.00 Cascade size 0 200 400 600 800 1000 0.09 100
  51. “Increasing the strength of social influence increased both inequality and

    unpredictability of success.” Salganik, Dodds & Watts (2006)
  52. Challenge: how to predict cascade growth? ? Will a cascade

    get 100 reshares? Exactly how big will a small cascade get? Only consider the largest cascades?
  53. Challenge: how to predict cascade growth? ? Will a cascade

    get 100 reshares? Exactly how big will a small cascade get? Only consider the largest cascades? class imbalance outliers skew results selection bias
  54. Solution: will a cascade reach the median? ? ≤ the

    median f(k) ≥ the median f(k) k=5 reshares
 observed
  55. Solution: will a cascade double in size? ? ≤ the

    median f(k) ≥ the median f(k) k=5 reshares
 observed
  56. Given that a cascade has obtained k reshares, will it

    double in size? balanced track growth over time Cascade Growth Prediction Problem
  57. Content
 has overlaid text captions … User
 friend count
 gender

    … Structural
 tree depth outdegree … Temporal
 time between shares change in time … What factors affect predictability?
  58. How predictable is cascade doubling? All Temporal All but temporal

    Structural User Content AUC (k=5) 0.00 0.23 0.45 0.68 0.90 0.58 0.71 0.74 0.79 0.87 0.88 All but temporal
  59. Given that a cascade has obtained k reshares, will it

    double in size? Cascade Growth Prediction Problem
  60. Given that a cascade has obtained 5 reshares, will it

    double in size? Cascade Growth Prediction Problem
  61. Given that a cascade has obtained 100 reshares, will it

    double in size? Cascade Growth Prediction Problem
  62. How does performance change with k? k = 5 k

    > 10 k = 10 k > 20 Less data More data
  63. How does performance change with k? k = 5 k

    > 10 k = 10 k > 20 Shorter-term Longer-term
  64. Easier to predict larger cascades doubling Accuracy 0.78 0.79 0.8

    0.81 0.82 Number of reshares observed, k 0 25 50 75 100
  65. Cascade structure is predictable AUC = 0.80 for predicting structural

    virality * More details in our WWW 2014 paper (http://bit.ly/memes-paper) vs.
  66. Cascade recurrence is predictable AUC = 0.89 for predicting a

    subsequent burst * More details in our WWW 2016 paper (http://bit.ly/cascades-paper) vs.
  67. What we now know What we thought Trolls are a

    vocal minority Trolls can be ordinary people Trolling is innate Trolling can spiral from a single bad post Cascades can be predicted Cascades are unpredictable ANTISOCIAL COMPUTING
  68. Predicting the demise of communities Proportion of Upvotes 0.6 0.65

    0.7 0.75 0.8 Time December February April June August Future Directions
  69. Munger (2016) Introducing conversation mediators Future Directions Don’t be a

    n****r. Hey man, just remember that there are real people who are hurt when you harass them with that kind of language. (e.g., bots)
  70. WWW 2017 (with S. Kumar, J. Leskovec, and V.S. Subrahmanian)

    Identifying different types of trolling Future Directions Possibly the best blog I’ve ever read major props to you Thanks. I knew Marvel fans would try to flame me, but they have nothing other than “oh that’s your opinion” Quit talking to yourself […] (e.g., sockpuppets)
  71. Holistic approaches for analyzing and building social systems Large-scale Analysis

    Experimentation + Macro-scale Micro-scale + Understand Build + Research Approach
  72. Multi-methods analyses identify patterns in data, verify hypotheses, make predictions,

    and develop social systems. Multi-methods analyses identify patterns in data, verify hypotheses, make predictions, and inform the design of better social systems.
  73. Justin Cheng / @jcccf / clr3.com Stanford University More resources

    and credits: http://bit.ly/jobtalkcredits ANTISOCIAL COMPUTING Explaining and Predicting Negative Behavior Online