Upgrade to Pro — share decks privately, control downloads, hide ads and more …

Understanding Perceptions of Problematic Facebook Use

Understanding Perceptions of Problematic Facebook Use

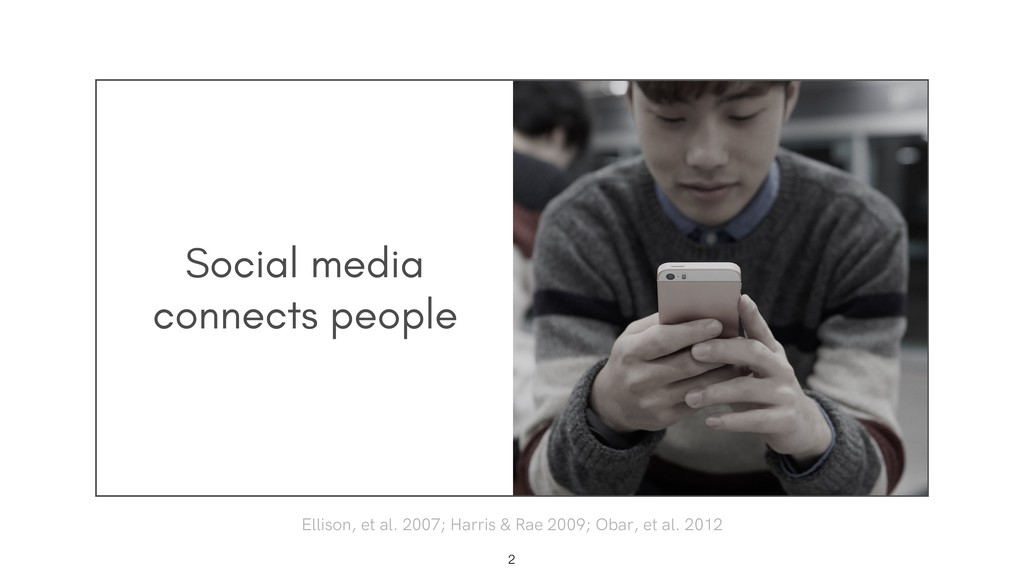
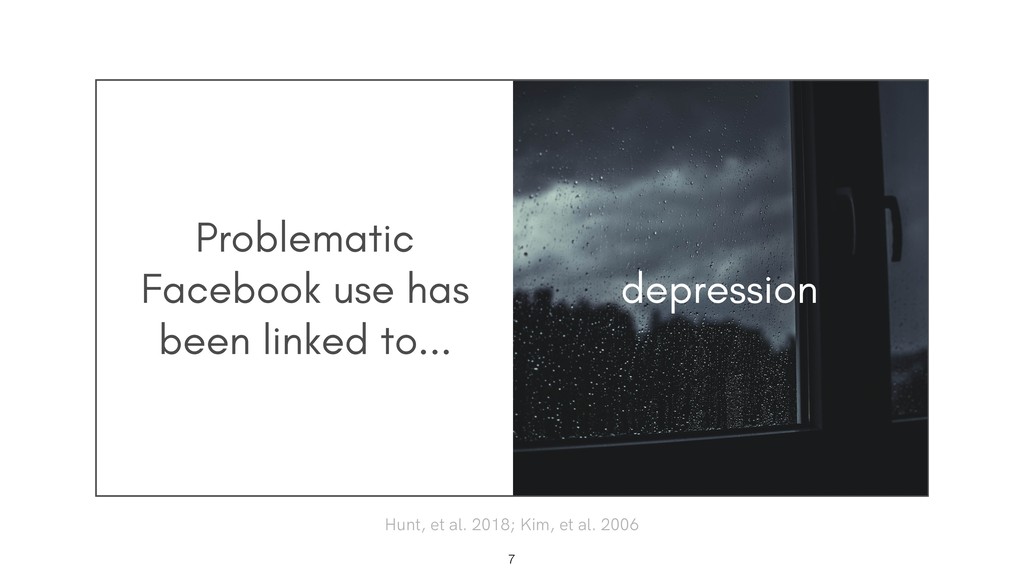
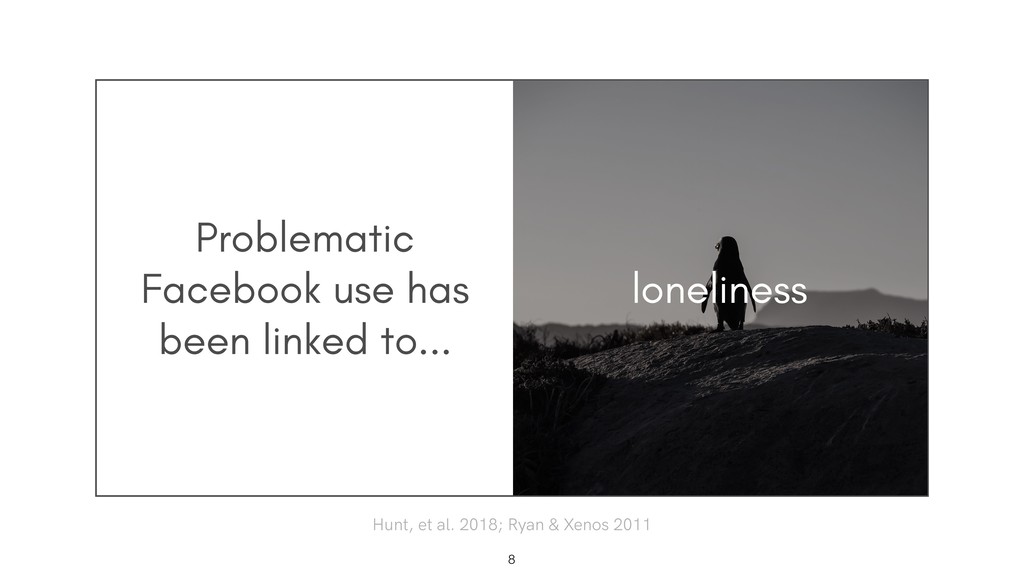
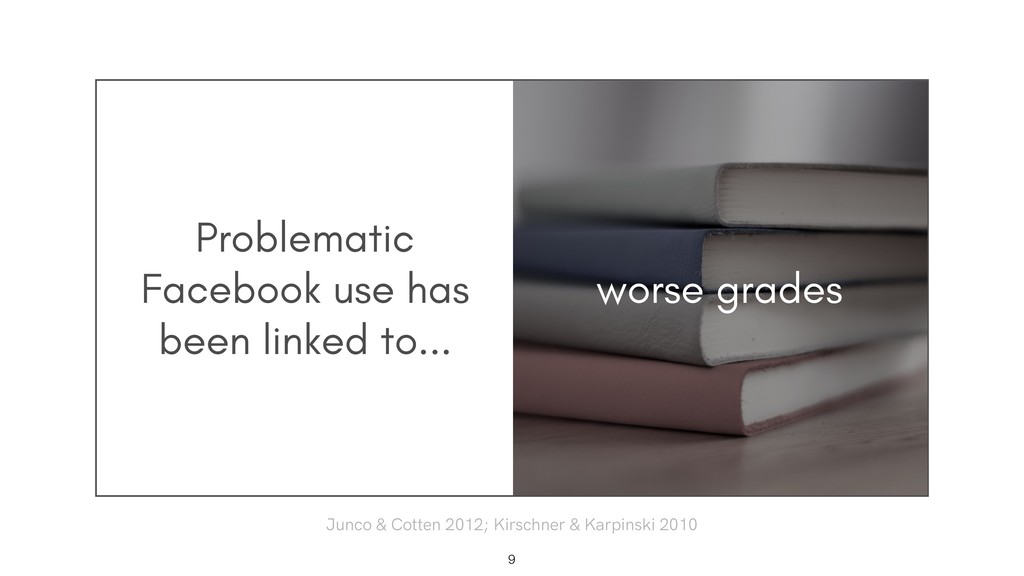
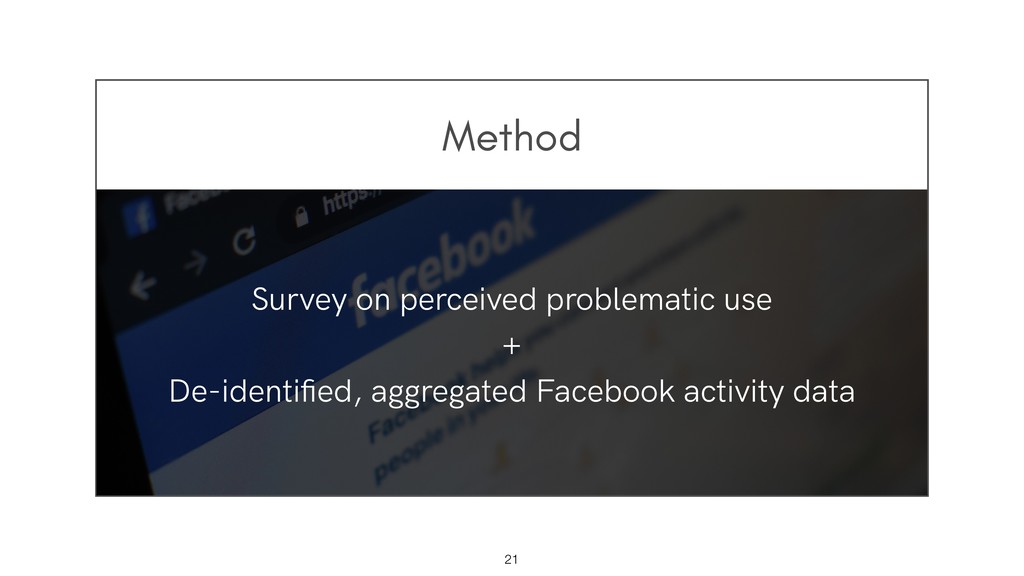
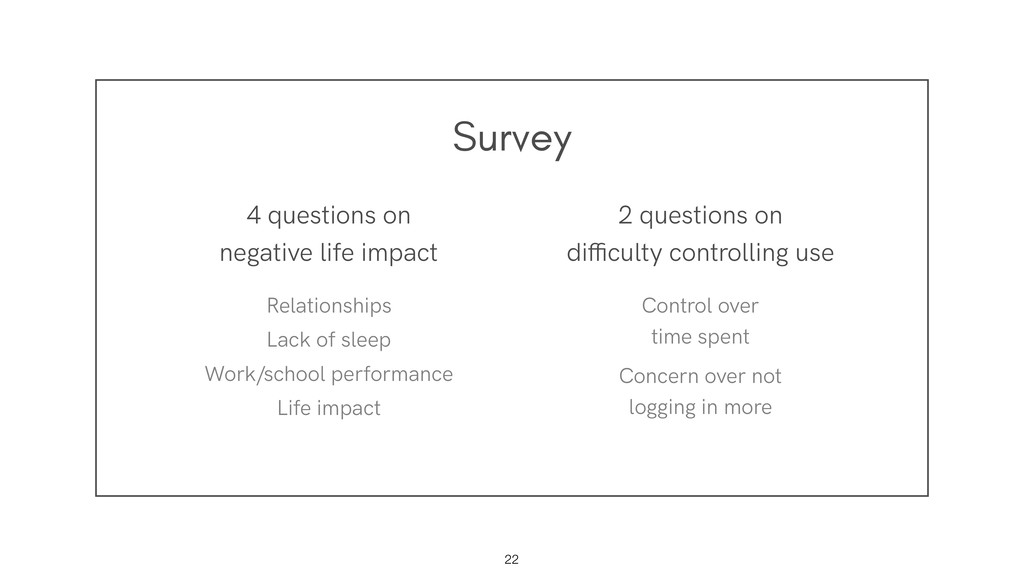
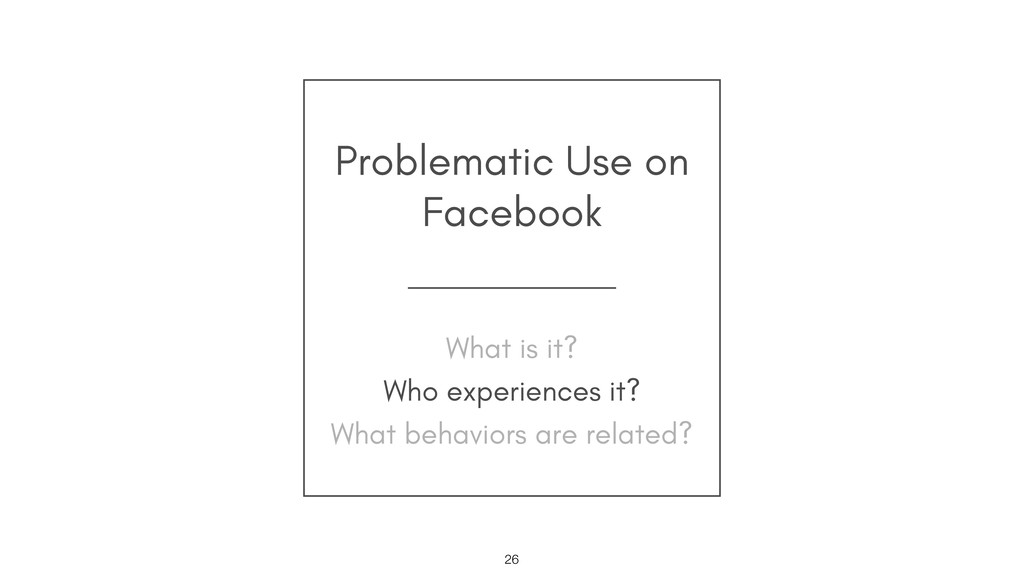
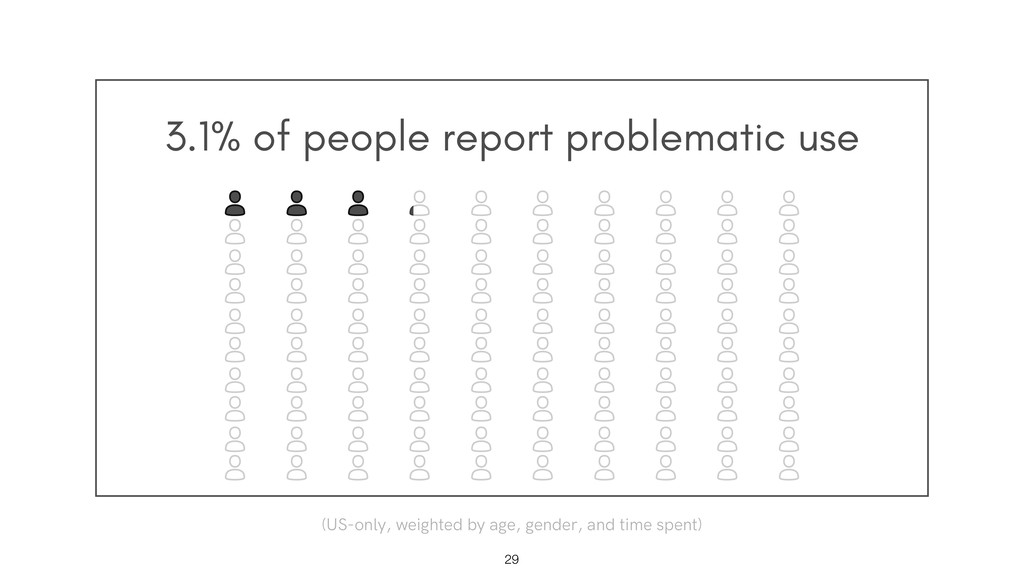
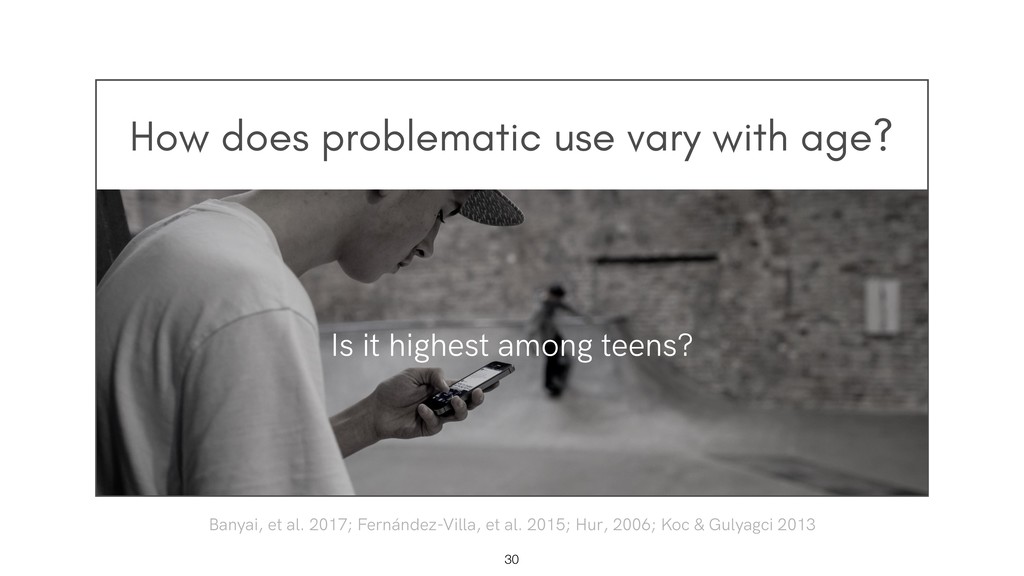
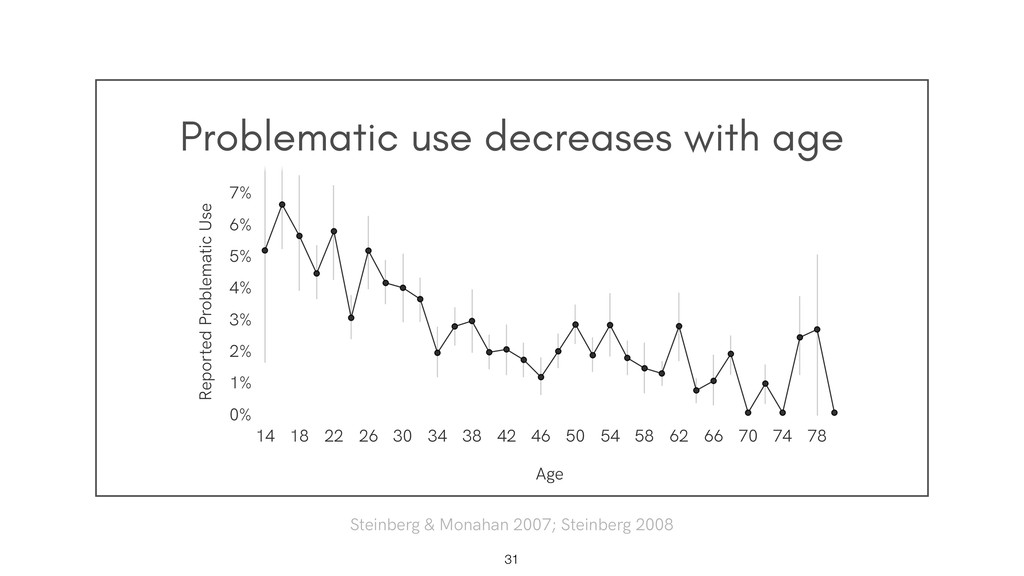
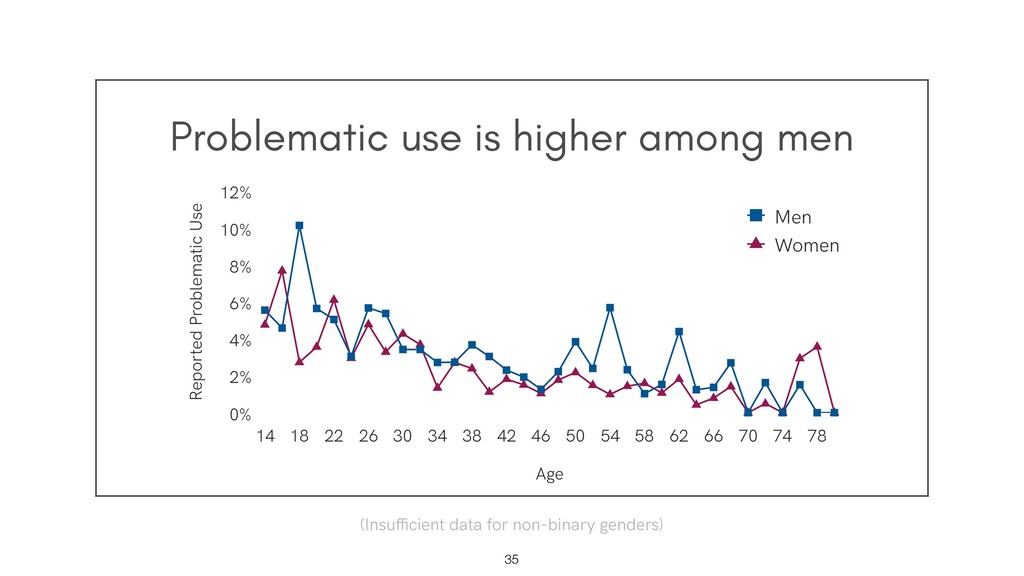
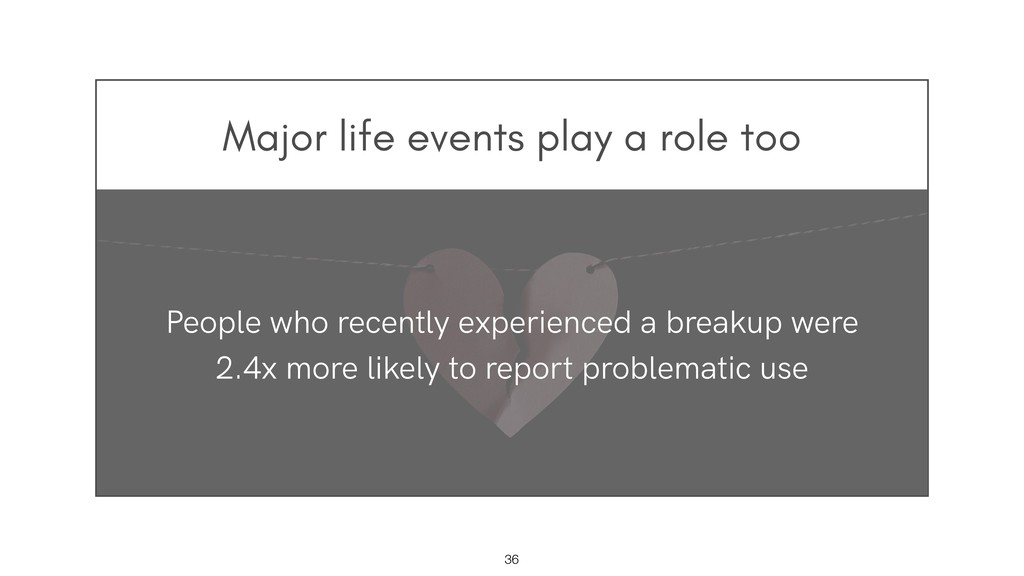
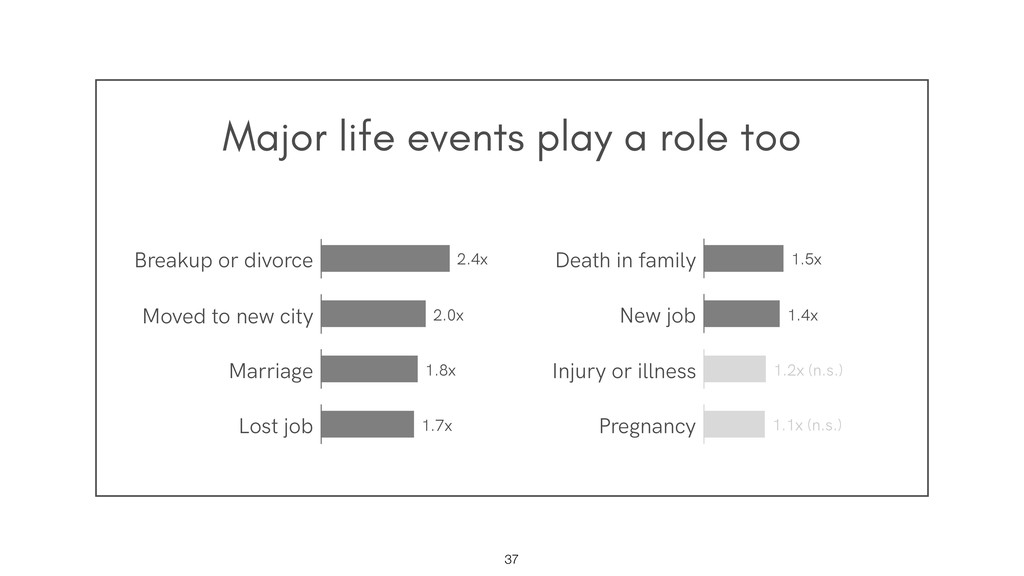
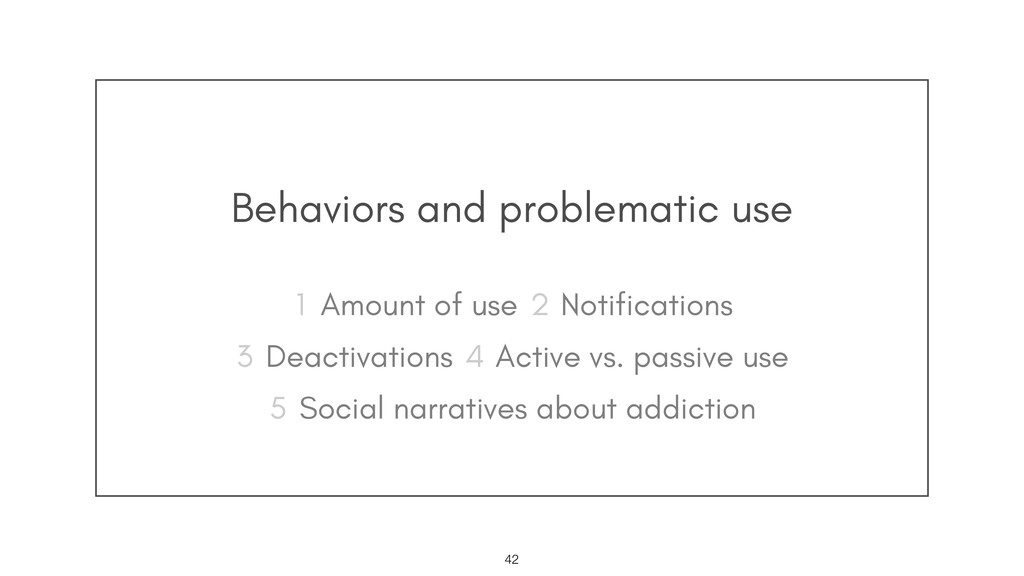
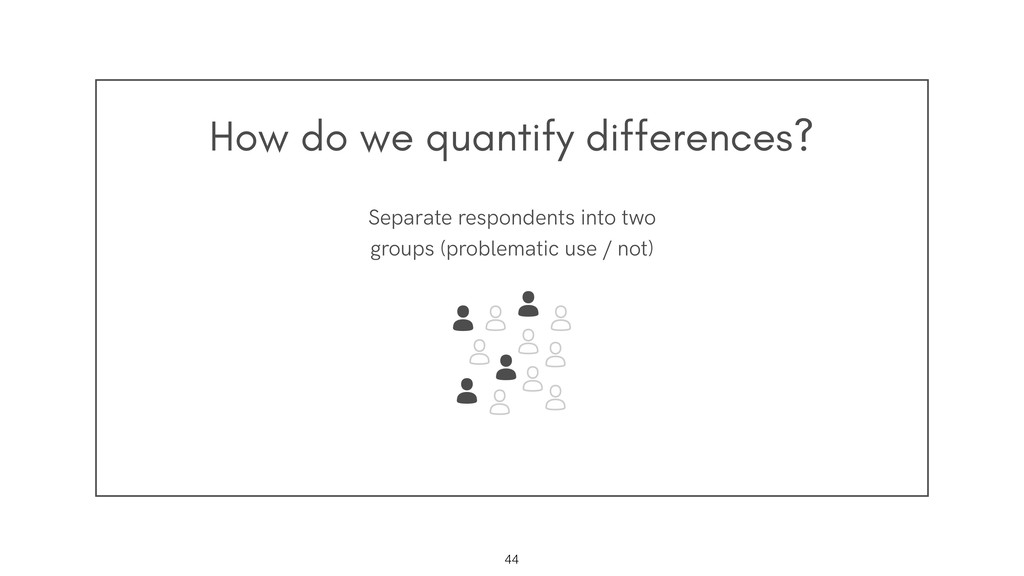
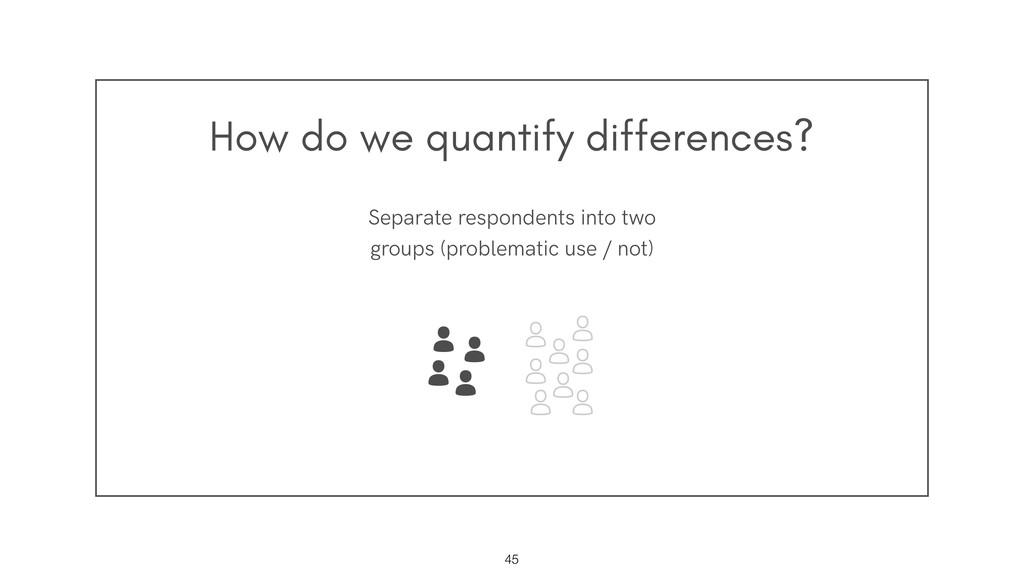
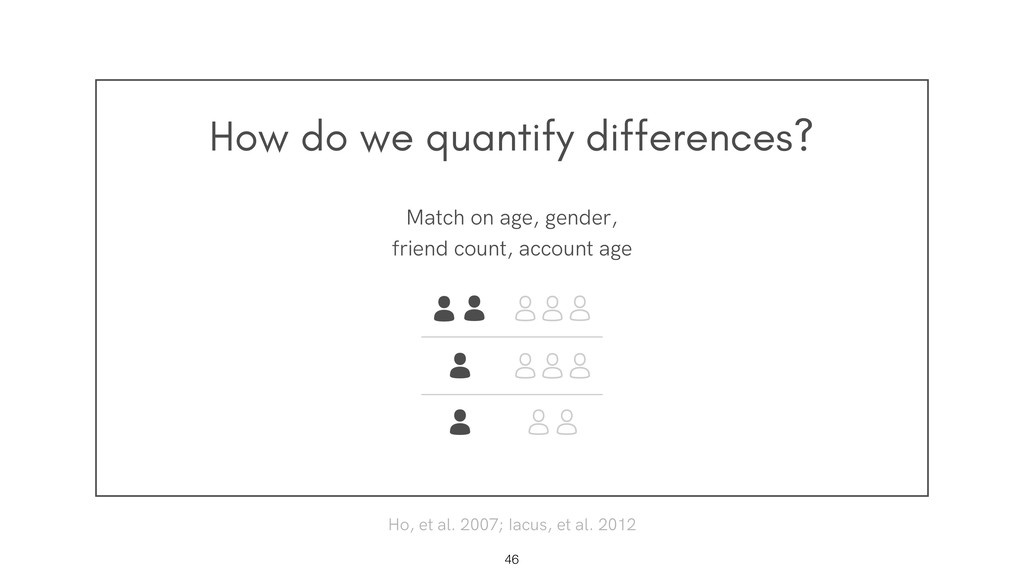
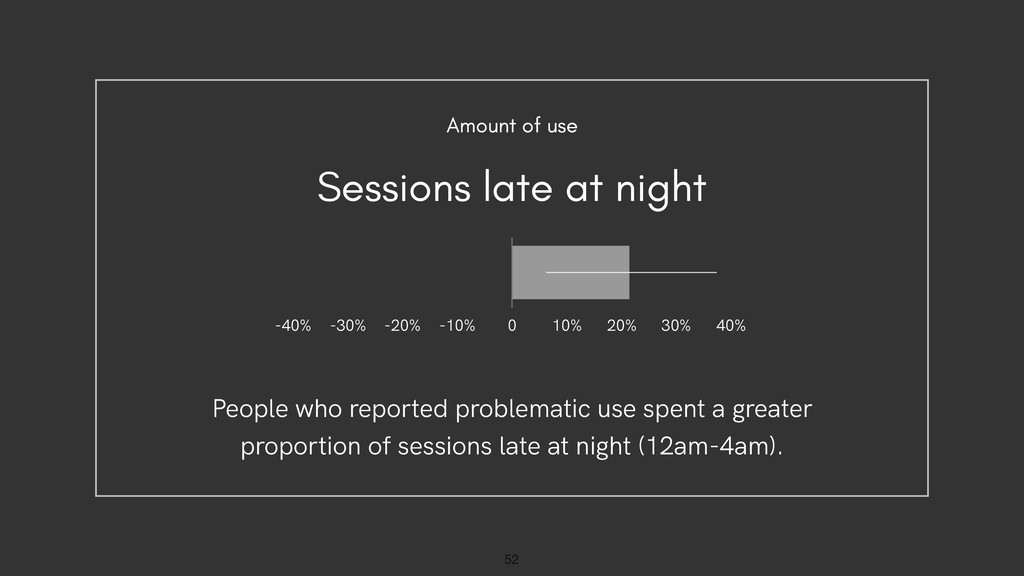
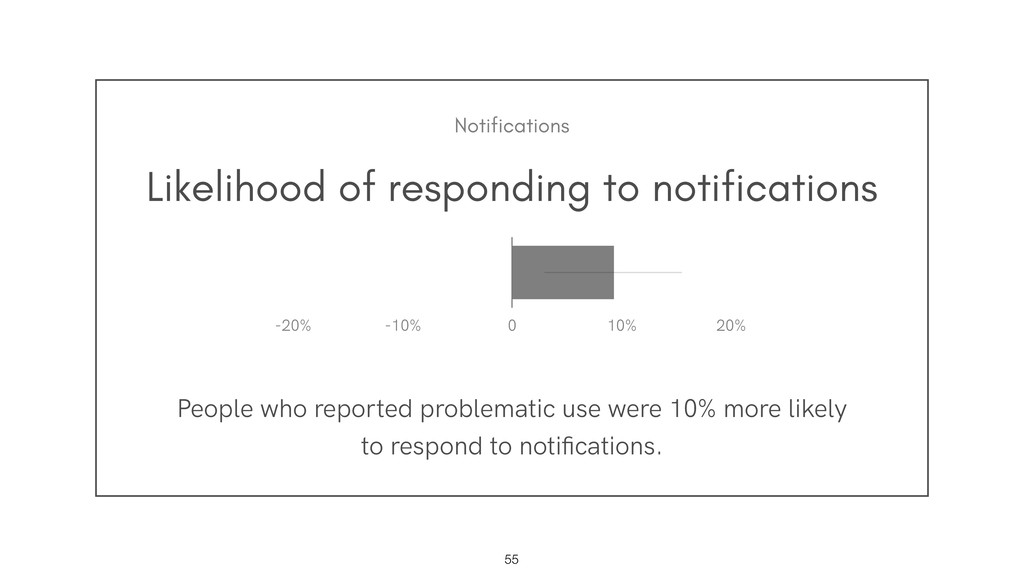
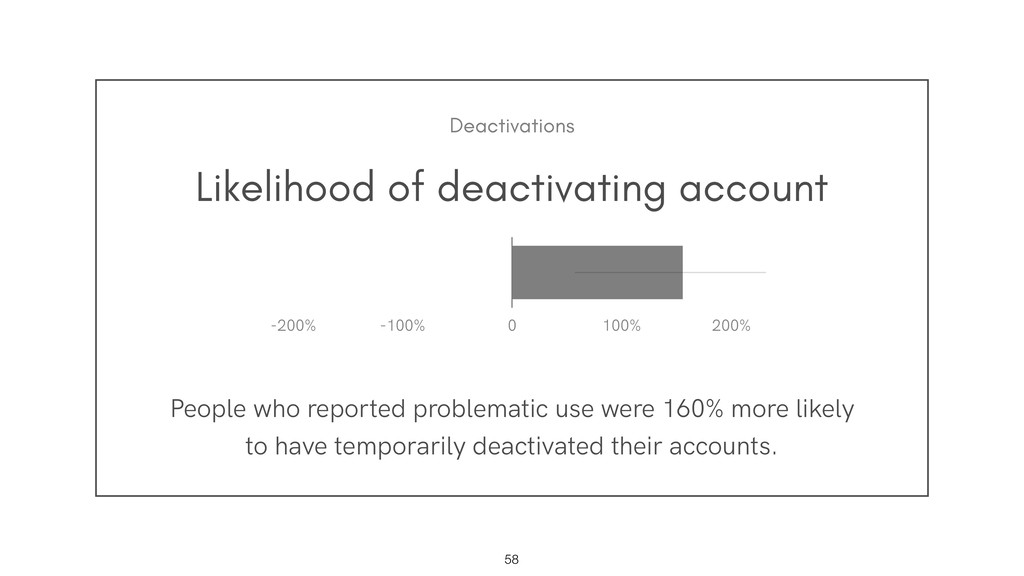
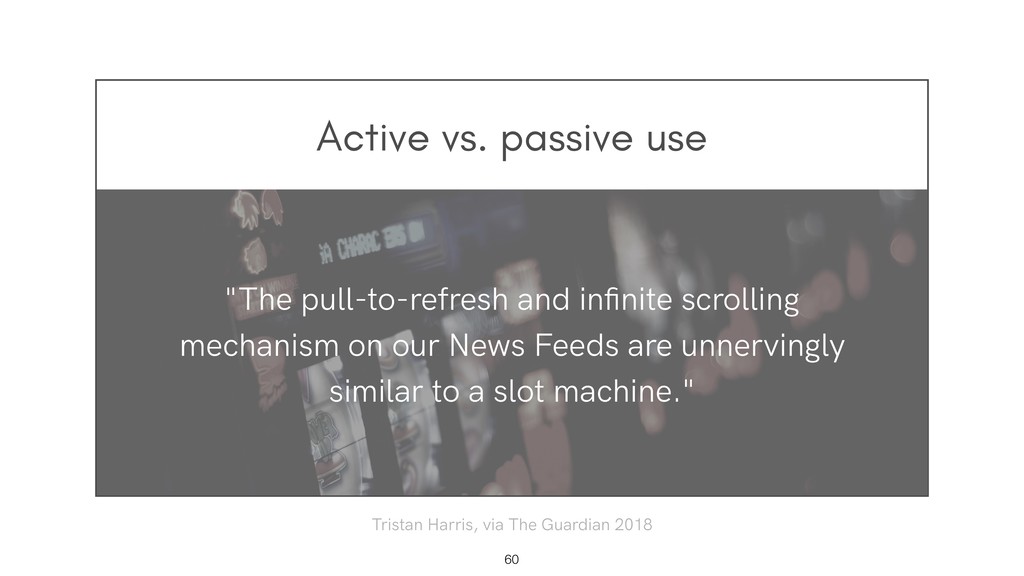
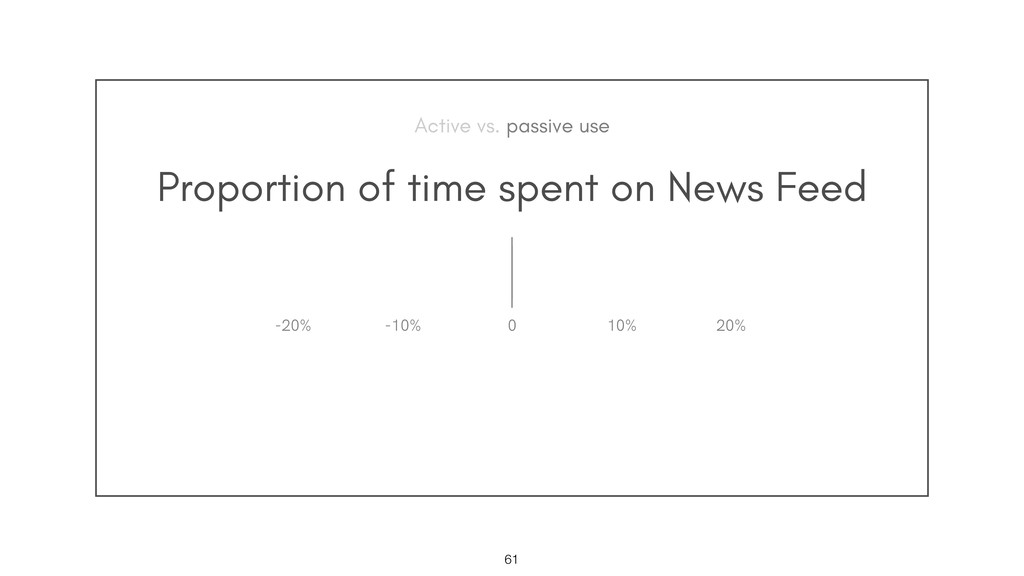
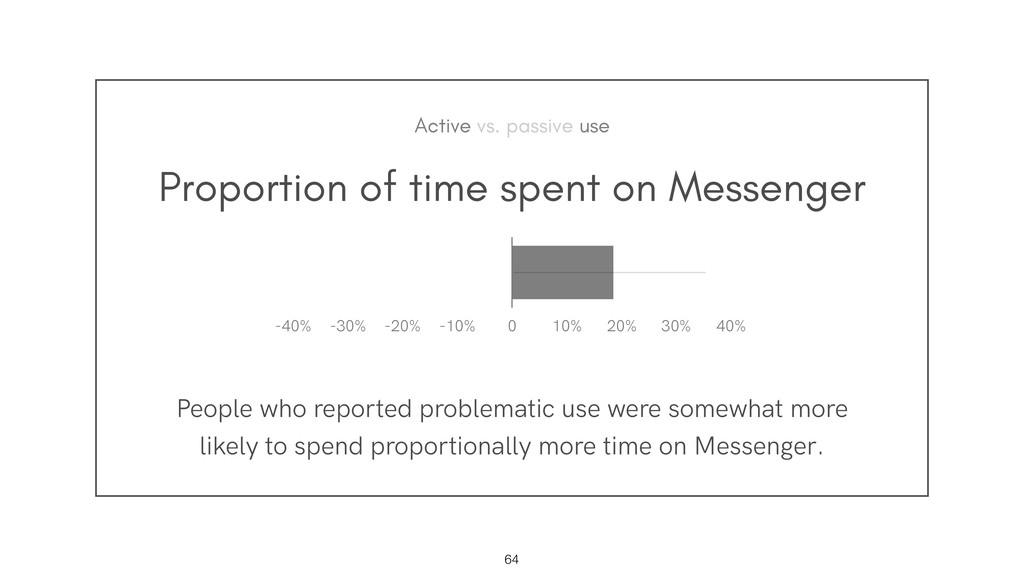
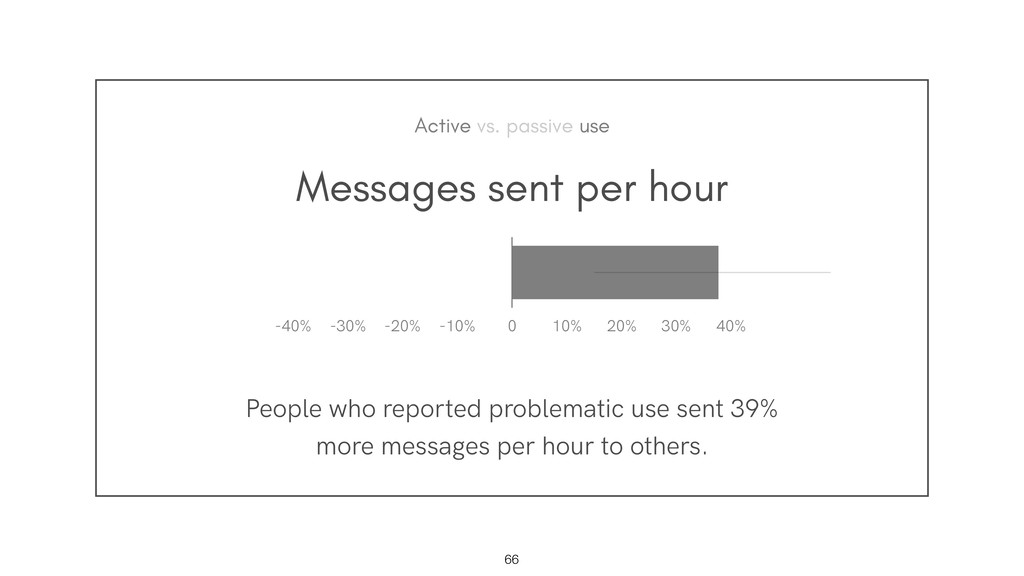
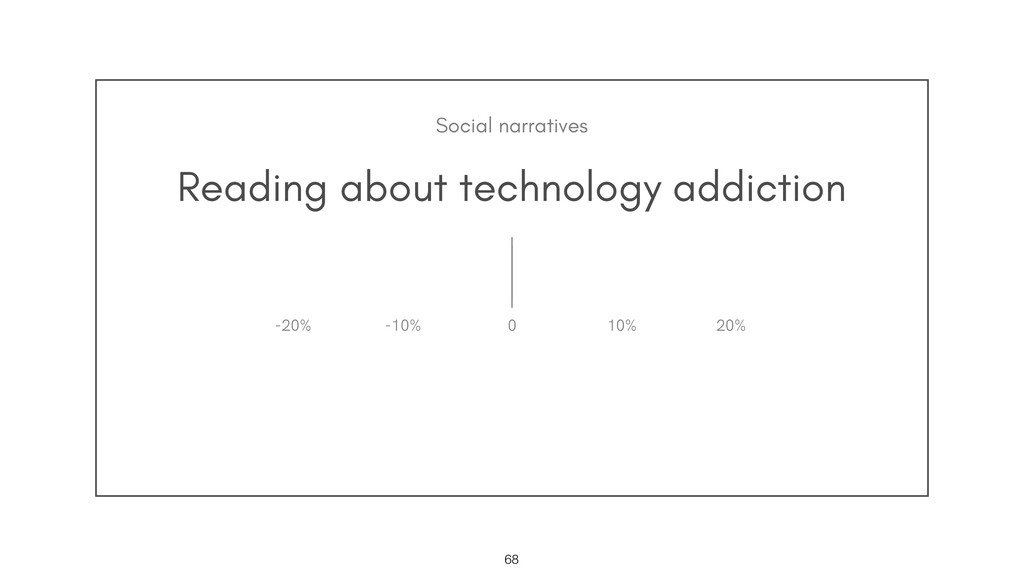
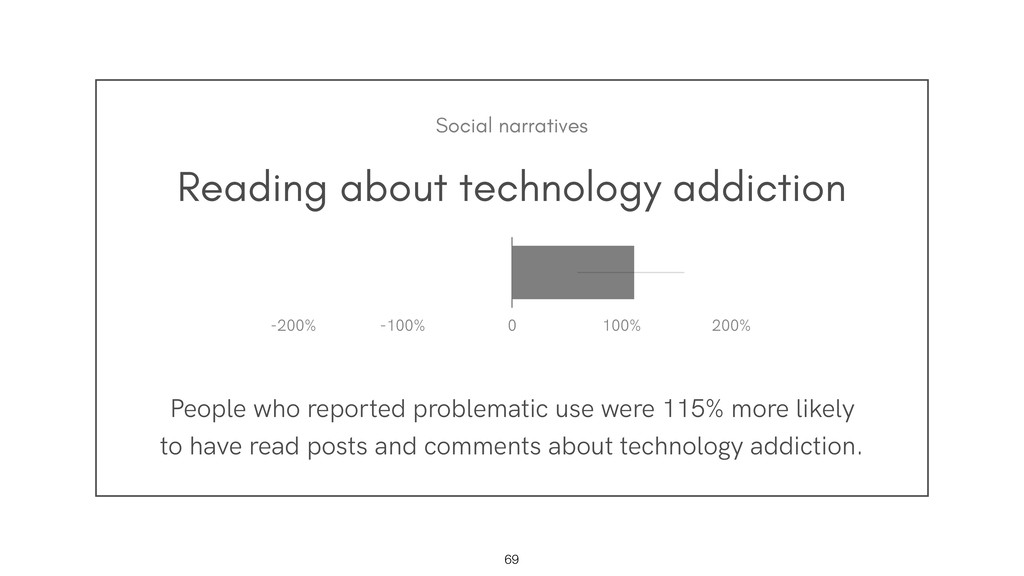
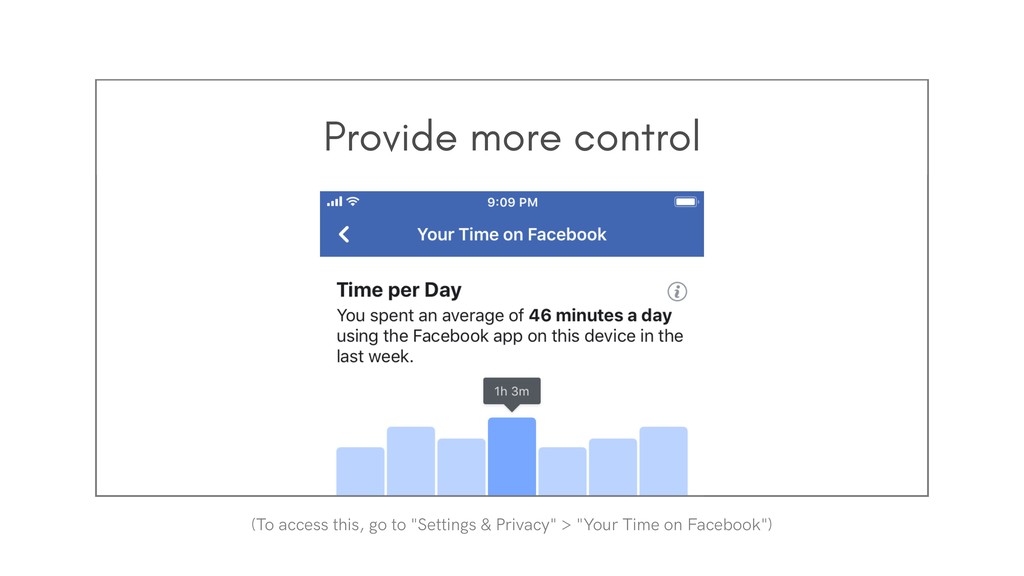
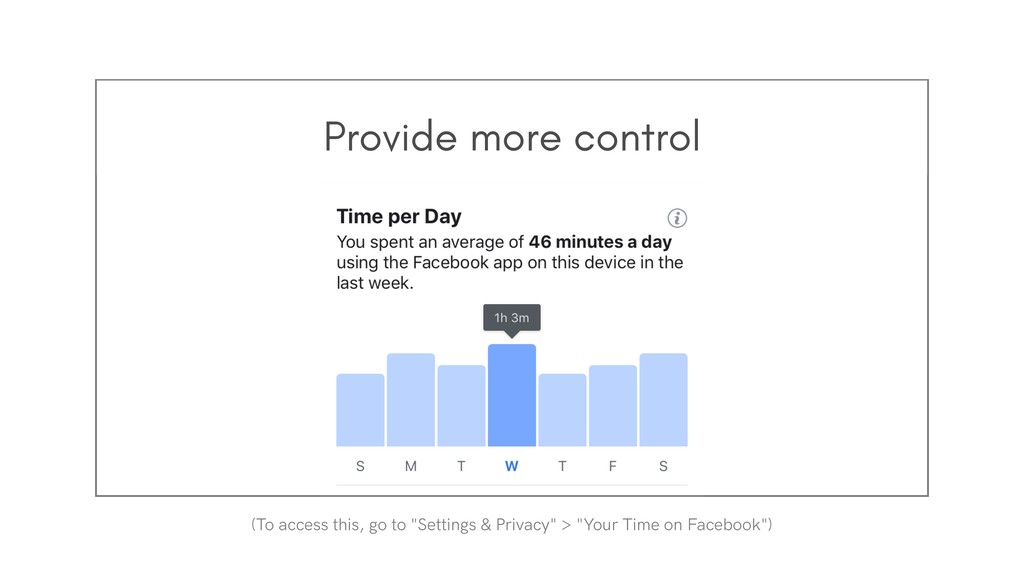
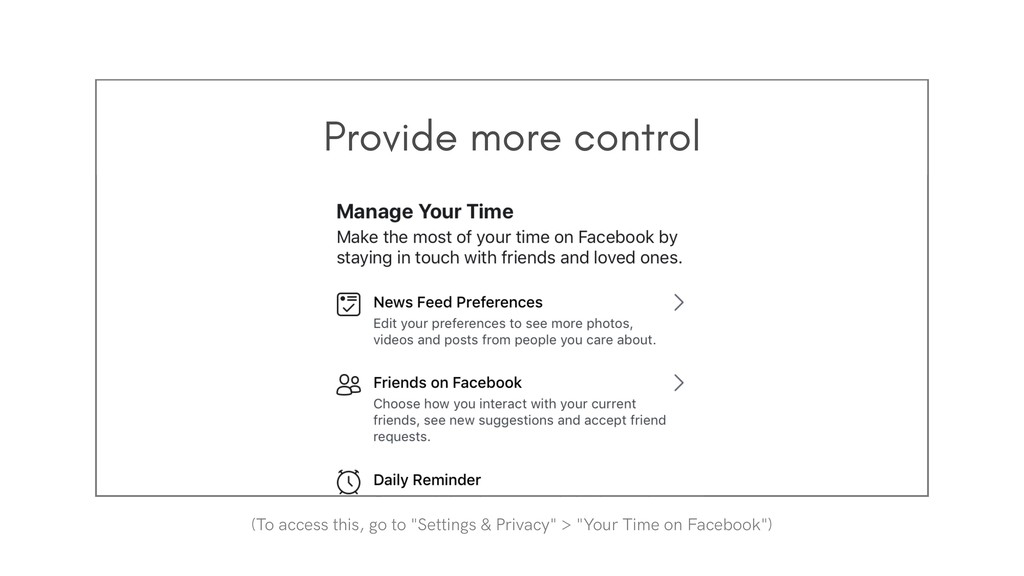
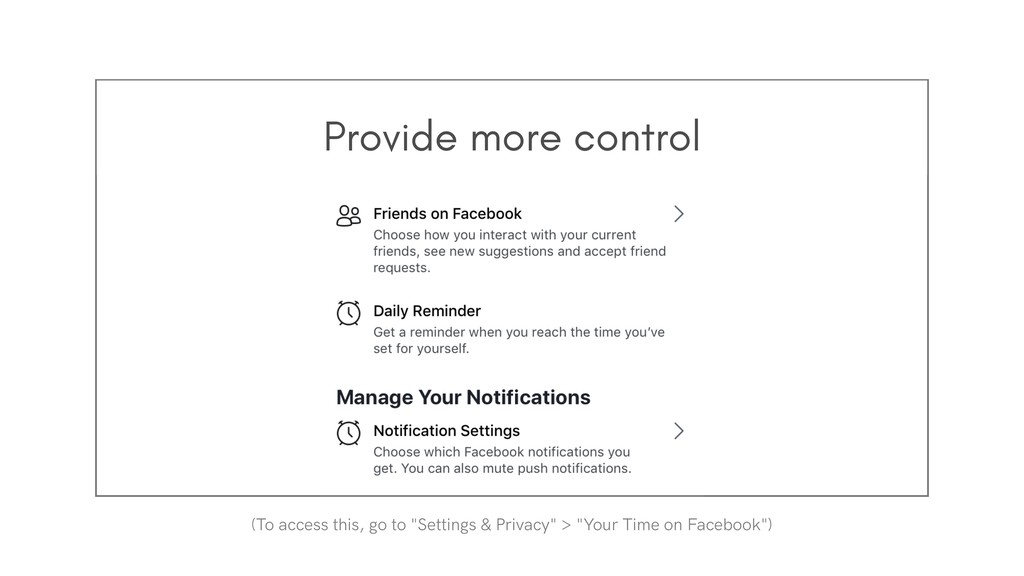
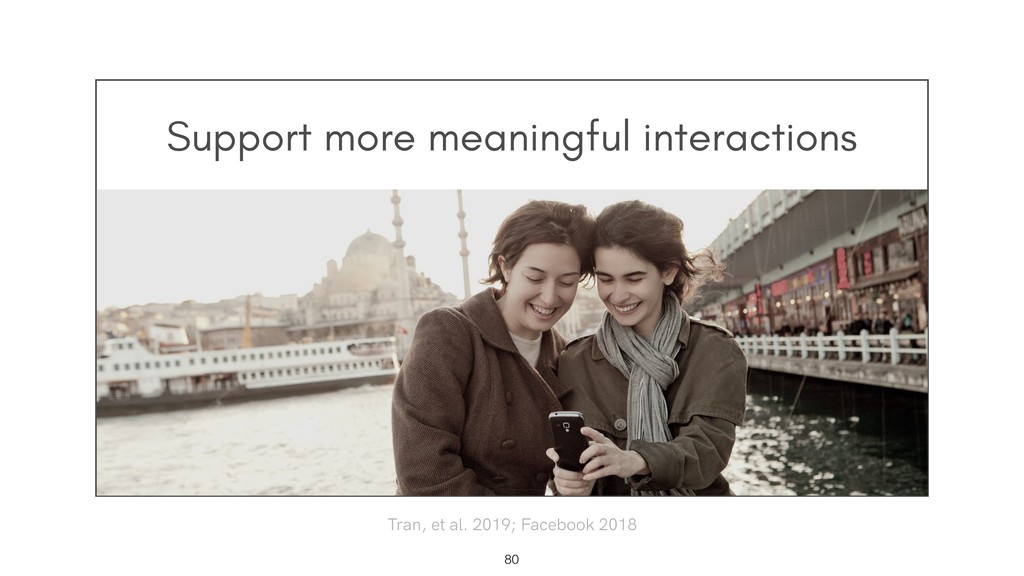
While many people use social network sites to connect with friends and family, some feel that their use is problematic, seriously affecting their sleep, work, or life. Pairing a survey of 20,000 Facebook users measuring perceptions of problematic use with behavioral and demographic data, we examined Facebook activities associated with problematic use as well as the kinds of people most likely to experience it. People who feel their use is problematic are more likely to be younger, male, and going through a major life event such as a breakup. They spend more time on the platform, particularly at night, and spend proportionally more time looking at profiles and less time browsing their News Feeds. They also message their friends more frequently. While they are more likely to respond to notifications, they are also more likely to deactivate their accounts, perhaps in an effort to better manage their time. Further, they are more likely to have seen content about social media or phone addiction. Notably, people reporting problematic use rate the site as more valuable to them, highlighting the complex relationship between technology use and well-being. A better understanding of problematic Facebook use can inform the design of context-appropriate and supportive tools to help people become more in control.

Presented at CHI 2019.

Justin Cheng

May 07, 2019
Tweet

More Decks by Justin Cheng

Other Decks in Research

Transcript

  1. Understanding
    Perceptions of
    Problematic
    Facebook Use
    Justin Cheng, Moira Burke, and Elena Davis
    !1

    View Slide

  2. Social media
    connects people
    !2
    Ellison, et al. 2007; Harris & Rae 2009; Obar, et al. 2012

    View Slide

  3. But sometimes, people feel that
    their social media use is

    problematic
    !3

    View Slide

  4. But sometimes, people feel that
    their social media use is

    problematic
    !4
    (i.e., negative life impact + difficulty controlling use)

    View Slide

  5. But sometimes, people feel that
    their social media use is

    problematic
    !5
    (or addictive?)

    View Slide

  6. Problematic
    Facebook use has
    been linked to...
    !6

    View Slide

  7. Problematic
    Facebook use has
    been linked to...
    !7
    depression
    Hunt, et al. 2018; Kim, et al. 2006

    View Slide

  8. Problematic
    Facebook use has
    been linked to...
    !8
    loneliness
    Hunt, et al. 2018; Ryan & Xenos 2011

    View Slide

  9. Problematic
    Facebook use has
    been linked to...
    !9
    worse grades
    Junco & Cotten 2012; Kirschner & Karpinski 2010

    View Slide

  10. A large-scale survey and behavioral
    analysis to understand problematic
    Facebook use and how we can reduce it.
    !10
    Today

    View Slide

  11. Problematic Use on
    Facebook
    !11

    View Slide

  12. Problematic Use on
    Facebook
    !12

    View Slide

  13. Problematic Use on
    Facebook
    !13
    What is it?
    Who experiences it?
    What behaviors are related?

    View Slide

  14. Problematic Use on
    Facebook
    !14
    What is it?

    Who experiences it?
    What behaviors are related?

    View Slide

  15. Defining
    Problematic Use
    !15

    View Slide

  16. Challenge: no formal definition exists
    !16

    View Slide

  17. Challenge: no formal definition exists
    !17
    Multiple

    proposed symptoms
    Negative Life Impact

    Lack of Control

    Salience

    Tolerance

    Mood Modification

    ...
    Billieux, et al. 2015; Cash, et al. 2012; Chakraborty, et al. 2010; Kuss & Griffiths 2011; Ryan, et al. 2014

    View Slide

  18. Challenge: no formal definition exists
    !18
    Wildly varying

    prevalence estimates
    0.3% (US)

    3.5% (Korea)
    8.1% (US)
    18% (UK)
    38% (China)
    ...
    Billieux, et al. 2015; Cash, et al. 2012; Chakraborty, et al. 2010; Kuss & Griffiths 2011; Ryan, et al. 2014

    View Slide

  19. Problematic Facebook use is...
    !19
    Negative life impact
    +
    Difficulty controlling use
    Our Broad Definition
    Peng, et al. 2010; Griffiths 2005

    View Slide

  20. Measuring
    Problematic Use
    !20
    (and its associated behaviors)

    View Slide

  21. Method
    !21
    Survey on perceived problematic use

    +

    De-identified, aggregated Facebook activity data

    View Slide

  22. Survey
    !22
    4 questions on

    negative life impact
    2 questions on

    difficulty controlling use
    Relationships
    Lack of sleep
    Work/school performance
    Life impact
    Control over

    time spent
    Concern over not

    logging in more

    View Slide

  23. Survey
    !23
    4 questions on

    negative life impact
    2 questions on

    difficulty controlling use
    Relationships
    Lack of sleep
    Work/school performance
    Life impact
    Control over

    time spent
    Concern over not

    logging in more
    (and a question on major life events as a control)

    View Slide

  24. Behavioral Data
    !24
    De-identified

    Facebook activity
    Time spent
    Interactions
    Viewed content
    (and demographics)

    View Slide

  25. Population
    !25
    ≈20,000 people in the US on Facebook

    View Slide

  26. Problematic Use on
    Facebook
    !26
    What is it?

    Who experiences it?
    What behaviors are related?

    View Slide

  27. Who experiences
    problematic use?
    !27

    View Slide

  28. How prevalent is problematic use?
    !28

    View Slide

  29. 3.1% of people report problematic use
    !29
    (US-only, weighted by age, gender, and time spent)

    View Slide

  30. How does problematic use vary with age?
    !30
    Banyai, et al. 2017; Fernández-Villa, et al. 2015; Hur, 2006; Koc & Gulyagci 2013
    Is it highest among teens?

    View Slide

  31. Reported Problematic Use
    0%
    1%
    2%
    3%
    4%
    5%
    6%
    7%
    Age
    14 18 22 26 30 34 38 42 46 50 54 58 62 66 70 74 78
    !31
    Problematic use decreases with age
    Steinberg & Monahan 2007; Steinberg 2008

    View Slide

  32. Is problematic use higher among...
    !32
    Men? Women?

    View Slide

  33. Is problematic use higher among...
    !33
    Men? Women?
    Andreassen, et al. 2012
    Banyai, et al. 2017
    De Cock, et al. 2014
    Cam & Isbulan 2012
    Durkee, et al. 2012
    Yen, et al. 2009

    View Slide

  34. Is problematic use higher among...
    !34
    Neither?
    Blachnio, et al. 2016; Rumpf, et al. 2014; Tang, et al. 2016
    Men? Women?
    Andreassen, et al. 2012
    Banyai, et al. 2017
    De Cock, et al. 2014
    Cam & Isbulan 2012
    Durkee, et al. 2012
    Yen, et al. 2009

    View Slide

  35. Problematic use is higher among men
    !35
    Reported Problematic Use
    0%
    2%
    4%
    6%
    8%
    10%
    12%
    Age
    14 18 22 26 30 34 38 42 46 50 54 58 62 66 70 74 78
    Men
    Women
    (Insufficient data for non-binary genders)

    View Slide

  36. Major life events play a role too
    !36
    People who recently experienced a breakup were

    2.4x more likely to report problematic use

    View Slide

  37. Major life events play a role too
    !37
    2.4x
    2.0x
    Breakup or divorce
    Moved to new city
    Marriage
    Lost job
    Death in family
    New job
    Injury or illness
    Pregnancy
    1.8x
    1.7x
    1.5x
    1.4x
    1.2x (n.s.)
    1.1x (n.s.)

    View Slide

  38. 3% of people report problematic use.

    It's more common among younger people
    and among men.
    !38
    The story so far...

    View Slide

  39. Problematic Use on
    Facebook
    !39
    What is it?

    Who experiences it?
    What behaviors are related?

    View Slide

  40. What behaviors
    are related to
    problematic use?
    !40

    View Slide

  41. Behaviors and problematic use
    !41

    View Slide

  42. Behaviors and problematic use
    !42
    Amount of use
    1
    Social narratives about addiction
    5
    Notifications
    2
    Deactivations
    3 Active vs. passive use
    4

    View Slide

  43. How do we quantify differences?
    !43

    View Slide

  44. How do we quantify differences?
    !44
    Separate respondents into two
    groups (problematic use / not)

    View Slide

  45. How do we quantify differences?
    !45
    Separate respondents into two
    groups (problematic use / not)

    View Slide

  46. How do we quantify differences?
    !46
    Match on age, gender,

    friend count, account age
    Ho, et al. 2007; Iacus, et al. 2012

    View Slide

  47. How do we quantify differences?
    !47
    Estimate difference

    using linear regression
    E(Y|X1
    )
    Ho, et al. 2007; Iacus, et al. 2012
    E(Y|X)

    View Slide

  48. Amount of use
    !48
    Is more time spent associated with problematic use?
    Hong, et al. 2014; Koc & Gulyagci, 2013

    View Slide

  49. Time spent on Facebook
    !49
    0 10% 20%
    -20% -10%
    Amount of use

    View Slide

  50. Time spent on Facebook
    People who reported problematic use spent 22% more time on
    Facebook than those who do not report problematic use.
    !50
    0 10% 20%
    -20% -10%
    Amount of use
    All differences were computed using matching, followed by regression.

    View Slide

  51. Sessions late at night
    !51
    0 10% 20%
    -20% -10%
    Amount of use

    View Slide

  52. !52
    0 20% 40%
    -40% -20%
    Amount of use
    10% 30%
    -30% -10%
    Sessions late at night
    People who reported problematic use spent a greater
    proportion of sessions late at night (12am-4am).

    View Slide

  53. Notifications
    !53
    How do notifications relate to problematic use?
    Kushlev, et al. 2016

    View Slide

  54. Likelihood of responding to notifications
    !54
    0 10% 20%
    -20% -10%
    Notifications

    View Slide

  55. Likelihood of responding to notifications
    People who reported problematic use were 10% more likely

    to respond to notifications.
    !55
    0 10% 20%
    -20% -10%
    Notifications

    View Slide

  56. Deactivations
    !56
    How do deactivations relate to problematic use?
    Baumer, et al. 2013

    View Slide

  57. Likelihood of deactivating account
    !57
    0 10% 20%
    -20% -10%
    Deactivations

    View Slide

  58. Likelihood of deactivating account
    People who reported problematic use were 160% more likely

    to have temporarily deactivated their accounts.
    !58
    0 100% 200%
    -200% -100%
    Deactivations

    View Slide

  59. Active vs. passive use
    !59
    How does active or passive use

    relate to problematic use?
    Shaw, et al. 2015, Verduyn, et al. 2015, Nontasil & Payne, 2019

    View Slide

  60. Active vs. passive use
    !60
    "The pull-to-refresh and infinite scrolling

    mechanism on our News Feeds are unnervingly

    similar to a slot machine."
    Tristan Harris, via The Guardian 2018

    View Slide

  61. Proportion of time spent on News Feed
    !61
    0 10% 20%
    -20% -10%
    Active vs. passive use

    View Slide

  62. Proportion of time spent on News Feed
    People who reported problematic use spent proportionally

    less time browsing their News Feeds.
    !62
    0 10% 20%
    -20% -10%
    Active vs. passive use

    View Slide

  63. Proportion of time spent on Messenger
    !63
    0 10% 20%
    -20% -10%
    Active vs. passive use

    View Slide

  64. Proportion of time spent on Messenger
    People who reported problematic use were somewhat more
    likely to spend proportionally more time on Messenger.
    !64
    Active vs. passive use
    0 20% 40%
    -40% -20% 10% 30%
    -30% -10%

    View Slide

  65. Messages sent per hour
    !65
    0 10% 20%
    -20% -10%
    Active vs. passive use

    View Slide

  66. Messages sent per hour
    People who reported problematic use sent 39%

    more messages per hour to others.
    !66
    Active vs. passive use
    0 20% 40%
    -40% -20% 10% 30%
    -30% -10%

    View Slide

  67. Social narratives
    !67
    Does reading about addiction

    relate to problematic use?
    McCombs 2002; Lanette, et al. 2018

    View Slide

  68. Reading about technology addiction
    !68
    0 10% 20%
    -20% -10%
    Social narratives

    View Slide

  69. Reading about technology addiction
    People who reported problematic use were 115% more likely

    to have read posts and comments about technology addiction.
    !69
    0 100% 200%
    -200% -100%
    Social narratives

    View Slide

  70. Behaviors associated with problematic use
    !70
    +22%
    Total time spent
    Late-night sessions
    Close friend content
    Network density
    Time on News Feed
    +22%
    -2% (n.s.)
    -4% (n.s.)
    -8%
    +19%
    Time in Messenger
    Messages per hour
    Notification response
    Deactivation
    Read about addiction
    +39%
    +10%
    +160%
    +115%

    View Slide

  71. People nonetheless perceive value
    !71
    The solution to problematic use isn't as

    straightforward as not using social media.

    View Slide

  72. What should
    designers do?
    !72

    View Slide

  73. Provide more control
    !73
    Encourage breaks

    View Slide

  74. Provide more control
    !74
    Encourage breaks
    Allow people to better manage notifications

    View Slide

  75. Provide more control
    !75
    Encourage breaks
    Allow people to better manage notifications
    Discourage late-night use

    View Slide

  76. !76
    (To access this, go to "Settings & Privacy" > "Your Time on Facebook")
    Provide more control

    View Slide

  77. !77
    (To access this, go to "Settings & Privacy" > "Your Time on Facebook")
    Provide more control

    View Slide

  78. !78
    (To access this, go to "Settings & Privacy" > "Your Time on Facebook")
    Provide more control

    View Slide

  79. !79
    (To access this, go to "Settings & Privacy" > "Your Time on Facebook")
    Provide more control

    View Slide

  80. Support more meaningful interactions
    !80
    Tran, et al. 2019; Facebook 2018

    View Slide

  81. About 3% of people in the US
    report problematic Facebook use.
    !81
    Summary

    View Slide

  82. They spend more time on Facebook (at
    night), but spend proportionally less time
    browsing their News Feeds.
    !82
    Summary

    View Slide

  83. They are more likely to respond to
    notifications, deactivate their accounts, or
    have read about technology addiction.
    !83
    Summary

    View Slide

  84. Understanding their experiences

    can inform the design of

    more supportive tools.
    !84
    Summary

    View Slide

  85. Understanding
    Perceptions of
    Problematic
    Facebook Use
    !85
    Justin Cheng, Moira Burke, and Elena Davis
    http://bit.ly/problematic_use

    View Slide